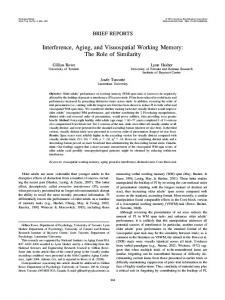
Prefrontal Cortical Representation of Visuospatial Working Memory in Monkeys Examined by Local Inactivation With Muscimol TOSHIYUKI SAWAGUCHI AND MICHIYO IBA Laboratory of Neurobiology, Hokkaido University School of Medicine, Sapporo 060-8638; and Core Research for Evolutional Science and Technology, Japan Science and Technology, Saitama 332-0012, Japan Received 20 November 2000; accepted in final form 21 May 2001
Sawaguchi, Toshiyuki and Michiyo Iba. Prefrontal cortical representation of visuospatial working memory in monkeys examined by local inactivation with muscimol. J Neurophysiol 86: 2041–2053, 2001. In primates, dorsolateral areas of the prefrontal cortex (PFC) play a major role in visuospatial working memory. To examine the functional organization of the PFC for representing visuospatial working memory, we produced reversible local inactivation, with the local injection of muscimol (5 g, 1 l), at various sites (n ⫽ 100) in the dorsolateral PFC of monkeys and observed the behavioral consequences in an oculomotor delayed-response task that required memory-guided saccades for locations throughout both visual fields. At 82 sites, the local injection of muscimol induced deficits in memoryguided saccades to a few specific, usually contralateral, target locations that varied with the location of the injection site. Such deficits depended on the delay length, and longer delays were associated with larger deficits in memory-guided saccades. The injection sites and affected spatial locations of the target showed a gross topographical relationship. No deficits appeared for a control task in which the subject was required to make a visually guided saccade to a visible target. These findings suggest that a specific site in the dorsolateral PFC is responsible for the working memory process for a specific visuospatial coordinate to guide goal-directed behavior. Further, memoranda for specific visuospatial coordinates appear to be represented in a topographical memory map within the dorsolateral PFC to represent visuospatial working memory processes.
To address this problem, we produced reversible local inactivation, with the local injection of muscimol (MUS), at various sites in the dorsolateral PFC of monkeys and observed the behavioral consequences in an oculomotor delayed-response (ODR) task that required memory-guided saccades for locations throughout both visual fields. Reversible local inactivation with MUS has been demonstrated to be useful for mapping the normal function of a small region of frontal cortical areas of monkeys, such as the premotor cortex (Kurata and Hoffman 1994) and the frontal eye field (Dias and Segraves 1999; Sommer and Tehovnik 1997). We obtained evidence that memoranda for specific visuospatial coordinates are represented in a “memory map” within the dorsolateral PFC to represent visuospatial working-memory processes. METHODS
Subjects and behavioral tasks
Working memory is a brain system for the temporary storage and manipulation of information and is critical for various cognitive operations (Baddeley 1986, 1992). In primates, dorsolateral areas of the prefrontal cortex (PFC) play a major role in working memory for visuospatial information (for reviews, see Funahashi and Kubota 1994; Goldman-Rakic 1995), and single-neuron recording in this area has revealed that different neurons code different “memory fields” in delayed-response visuospatial working memory tasks (Chafee and Goldman-Rakic 1998; Funahashi et al. 1989; Sawaguchi and Yamane 1999). The specificity of this activity suggests that visuospatial memory in the PFC may be organized as a place map where memory-related neurons are topographically organized. We have obtained limited evidence on this hypothesis in preliminary studies with chemical dysfunction (Sawaguchi and Goldman-Rakic 1990, 1994), but there have been no systematic examinations.
Two male rhesus monkeys (Macaca mulatta, ⬃6 –7 kg) were used in the present study. Throughout the experiment, the subjects were treated in accordance with the Guide for Care and Use of Laboratory Animals (National Institutes of Health) and the Guide for Care and Use of Laboratory Animals of our institute. The monkeys were trained to perform an ODR task and a control (CON) task. Before training, each monkey was habituated to a monkey chair, and then preliminary surgery was performed under deep anesthesia with pentobarbital sodium (⬃25 mg/kg iv) and aseptic conditions. Two hollow rods (8 mm ID), for restraining the head of the monkey, were implanted on the anterior and posterior portions of the skull with dental acrylic. Small stainless-steel bolts (3 mm ID), for grounding, were anchored to the marginal portions of the skull and fixed with dental acrylic. To prevent infection, antibiotics were injected intramuscularly on the day of the surgery and daily for 1 wk afterward. A few weeks after surgery, each monkey began training on the ODR and CON tasks. During daily sessions, the monkey sat in a monkey chair and faced a multiscan 21-in cathode ray tube (CRT) monitor (PC-TV471, NEC, Tokyo) placed ⬃60 cm in front of him. The monkey’s head was rigidly fixed by two stainless steel bars (8 mm diam) to a stereotaxic frame located at the top of the monkey chair, and a water spout was positioned close to the monkey’s mouth. The task and the recordings were controlled by a system consisting of an infrared eye-camera system (R-21C-A, RMS, Hirosaki, Japan), two personal computers (PC9801FE and PC9801BX, NEC, Tokyo) that were networked by RS232C and parallel I/O, and other associated peripherals. The eye-camera system was
Address for reprint requests: T. Sawaguchi, Laboratory of Neurobiology, Hokkaido University School of Medicine, N15 W7, Kita-ku, Sapporo 0608638, Japan (E-mail:
[email protected]).
The costs of publication of this article were defrayed in part by the payment of page charges. The article must therefore be hereby marked ‘‘advertisement’’ in accordance with 18 U.S.C. Section 1734 solely to indicate this fact.
INTRODUCTION
www.jn.org
0022-3077/01 $5.00 Copyright © 2001 The American Physiological Society
2041
2042
T. SAWAGUCHI AND M. IBA
connected to the personal computers via A/D converters (AB98-05A/4, ADTEK, Yokohama, Japan) and was used for monitoring and sampling eye positions. One of the personal computers (PC9801FE) controlled the task and generated visual stimuli on the CRT monitor, and the other computer (PC9801BX) monitored and sampled eye positions and task events. The computer programs were written in C and partially in Assembly languages. The phases of the ODR and CON tasks are illustrated in Fig. 1A. The ODR task was started when the monkey fixated on a central spot (a white square, 0.2 ⫻ 0.2°) on the CRT. One second later, a visual cue (white square, 0.5 ⫻ 0.5°) was presented for 0.5 s, and this was followed by a delay period. The cue was presented randomly at 1 of 16 peripheral locations; their directions were from 0 (right) to 360° counter-clockwise at 45° intervals, with eccentricities of 10 and 20° (Fig. 1B). After a delay period of 2– 6 s (usually 4 s), the fixation spot was then extinguished (“go” signal), which instructed the monkey to make a memory-guided saccade to the location that had been cued prior to the delay period. Correct responses were defined as eye movement which fell within a diameter of 5–10° around the target location. A correct response was rewarded by a drop of water 0.2 s
after the response. When the eye movements did not fall within the prescribed window or when the monkey failed to respond within the allotted 0.7 s, the response was defined as an error and was not rewarded. Trials were separated by an intertrial interval of 2 s. The CON task was exactly the same as the ODR task except that the visual cue remained on during the “delay” and response periods, and the subject made a visually guided saccade to the visible target. The monkeys performed ⬃500 –700 trials for each task during daily training or recording sessions. The correct-response rate was 95% in the final stages of training sessions and in the predrug period of daily recording sessions. In the predrug period of a typical recording session, the latency of saccades from the onset of the go signal was ⬃180 –220 ms with SDs of ⬃10 –25 ms for the ODR task and ⬃200 –240 ms with SDs of ⬃15–30 ms for the CON task; this onset latency varied somewhat by the target location and by the subject.
Experimental procedures and data analysis After the training was completed, surgery for the experiment was performed under aseptic conditions as in the preliminary surgery.
FIG. 1. The behavioral task and injection sites. A: the oculomotor delayed-response (ODR) and control (CON) tasks. In the ODR task, monkeys fixated on a fixation spot on a CRT monitor, and a visual cue came on for 0.5 s, followed by a delay period. After the delay period (usually 4 s), the fixation spot turned off, instructing the monkeys to make a memory-guided saccade (arrow) to the location that had been indicated by the cue prior to the delay. The correct response was rewarded by a drop of water 0.2 s after the response. Trials were separated by an intertrial interval (ITI) of 2 s. The CON task was exactly the same as the ODR task except that the cue remained on during the “delay” period, and the monkeys made a visually guided saccade to the visible target at the end of the “delay” period. B: locations of cue presentation. The central square indicates the fixation spot. The cue was presented at 16 locations, which were separated by 45° with eccentricities of 10 and 20°. C: tracing of injection sites on the surface of the dorsolateral prefrontal cortex (PFC) of the 2 monkeys (SA and TA). Muscimol (MUS) was injected at a total of 100 sites in the dorsolateral PFC and at 8 sites in the frontal eye field (FEF). The injection sites associated with deficits in the ODR task by MUS are indicated (●). -, ineffective sites; ‚, injection sites in the FEF. PS, principal sulcus; AS, arcuate sulcus.
J Neurophysiol • VOL
86 • OCTOBER 2001 •
www.jn.org
PREFRONTAL REPRESENTATION OF VISUOSPATIAL MEMORY
Each monkey was anesthetized with pentobarbital sodium (⬃25 mg/kg iv), and an oval opening was made in the skull to expose the dura over the frontal cortex. An oval cylinder (18 ⫻ 36 mm ID) was positioned over the opening and fitted in place with dental acrylic. Prophylactic antibiotics were injected intramuscularly on the day of the surgery and daily for 1 wk afterward. A few weeks after surgery, the experimental session was started. While the monkeys performed the ODR and CON tasks, 1 l of muscimol hydrochloride (MUS, 5 g/l, dissolved in 0.9% saline) was locally injected into the dorsolateral PFC using a microsyringe (MS-NP10; Ito, Osaka, Japan). The methods of injection were similar to those in our previous study for the monkey frontal cortex (Sawaguchi et al. 1996). Briefly, injections were made 3–5 mm from the dural surface. The needle (0.52 mm OD, 0.13 mm ID, ⬃0.008 mm2 open surface area) had a sharp angle (⬃27°) at the tip, and the opening of the tube was located ⬃0.5 mm from the tip. The needle was positioned using a micromanipulator (MO-95, Narishige, Tokyo) and a plastic grid with numerous small holes (0.7 mm ID, 1.5 mm apart from each other) attached to the cylinder. This method allowed us to precisely control the location of the insertion with an accuracy of ⬃0.2 mm and its relocation in subsequent sessions. Furthermore, the needle of the syringe was coated with polyurethane, and multiple neuronal activities at the injection site were recorded using the tip (resistance, 0.2– 0.5 M⍀). Thus we were able to confirm that the tip of the needle was located within the gray matter of the cortex. The experimental sessions consisted of blocks of trials 5 min long. In each block, the monkey performed the ODR or CON task, and blocks associated with the CON task were usually intermixed with those associated with the ODR task. The monkeys performed four or six blocks for each task (i.e., 40 or 60 min) before the injection of MUS. After the predrug period, testing was interrupted for 2–3 min while 1 l of MUS was injected at a rate of ⬃0.5 l/min, and postdrug trials were started. The postdrug period consisted of at least eight blocks of each task (i.e., 80 min) after the injection. The following behavioral parameters were examined and compared between the pre- and postdrug trials: discrepancy between the target location and the end point of the saccade during the response period; the onset latency of the response after the onset of the go signal; two-dimensional trajectories of saccades; and the amplitude and velocity of saccades. The predrug blocks were combined into one score for each task, and this value was compared with every postdrug block by a one-way ANOVA followed by the Newman-Keuls procedure for multiple comparisons. Furthermore, since MUS usually produced a significant effect within a few minutes after injection, which lasted for ⱖ60 min, data during this time period (i.e., 0 – 60 min) were pooled for each target location, to increase the sample size, and compared with the predrug data, using Mann-Whitney’s U test.
Intracortical microstimulation and injection sites To identify the frontal eye field (FEF), intracortical microstimulation (ICMS, 22 cathodal pulses of 0.2-ms duration at 333 Hz, ⱕ100 A) was applied through the tip of metal electrodes at various depths at several injection sites in the frontal cortex. When eye movements were elicited by ICMS at a certain site, the site was considered to be located in the FEF (cf. Bruce et al. 1985). We focus here on data obtained in the sites outside the FEF, and data for the FEF are described just briefly. After the experiments were complete, the monkey was deeply anesthetized with an overdose of pentobarbital sodium and perfused with 0.9% saline (200 ml) followed by 10% formalin (500 ml). The cortical surface was examined to detect the points of penetration. Figure 1C illustrates the sites of injection on the surface of the left hemisphere of monkey SA and the left and right hemispheres of TA. Overall, 100 injections were made in the PFC of these hemispheres. The injection sites were scattered throughout the dorsal convexity and periprincipal sulcal area, which has cytoarchitectural features of areas J Neurophysiol • VOL
2043
9 and 46 (Walker 1940). Since virtually every injection was made 3–5 mm from the surface of the dura (see preceding text), all injection sites were located superficially in the dorsolateral PFC; none of the injection sites were located within the banks of the principal sulcus. No evidence of severe damage was found in the area of the injection sites; this is consistent with the fact that each monkey performed the ODR and CON tasks almost perfectly (i.e., correct-response rate of 95%) at least during the predrug period of daily recording sessions throughout the present experiment. RESULTS
General In each monkey, injections were made in an area limited by the size of the cylinder used for single-neuron recording. Therefore we only explored the surface of the dorsolateral PFC. At most sites, however, 1 l of MUS (5 g) induced deficits in ODR performance unaccompanied by deficits in the CON task. The effective sites were located in the dorsal convexity and near the principal sulcus, and ineffective sites were mainly confined to sites nearby but outside the perimeter of the effective sites (Fig. 1C). At some of these effective sites (n ⫽ 5), different doses of MUS (5 g, 1 l; and 10 g, 2 l) were also injected in different daily sessions to examine the effects of dose. Furthermore, at some of these effective sites (n ⫽ 14), 0.9% saline (1 or 2 l) was injected at different daily sessions, and no clear changes were observed following the injection in either the ODR or CON task. The deficit in ODR performance induced by the injection of MUS was particularly characterized by misdirection/ distortion of memory-guided saccades and a decrease in accuracy as measured by the discrepancy between the endpoint of the saccade relative to the exact position of the target presented before the delay. The onset latency of memory-guided saccades was also increased in most cases but only to a modest degree (by ⬃30 ms, ⫹15–20% change). Premature saccades before the go signal, which have frequently been found following MUS injections into the FEF (Dias and Segraves 1999), seldom appeared. The deficit observed was usually restricted to a few specific, and in fact most often one, target locations that varied with the injection site but were mainly contralateral to the injection site. Signs of impairment were usually observed within 1 min after injection, with the maximum effect evident at ⬃40 – 60 min after injection, and the predrug control level was gradually restored during the experimental sessions, although this level was not quite achieved. Furthermore, the effects of MUS on ODR performance were sensitive to the length of the delay period: longer delays were associated with larger deficits in ODR performance, although this was examined in only a few sessions (n ⫽ 8). Effects of local injections of MUS on ODR and CON performance The injection of MUS affected task performance for 82 of the 100 injection sites in the dorsolateral PFC. The results for one such site are shown in Fig. 2. In this case, MUS (5 g, 1 l) was injected into the left dorsolateral PFC (Fig. 2, inset). Prior to injection, the monkey performed the ODR and CON tasks for ⬃60 min without error. The length of the delay period was 4 s, and the visuospatial cue was randomly presented at 1
86 • OCTOBER 2001 •
www.jn.org
2044
T. SAWAGUCHI AND M. IBA
FIG. 2. Effects of MUS injection on performance in the ODR and CON tasks. MUS (5 g/l, 1 l) was injected into a site in the left PFC (inset) while the monkey (SA) performed the ODR and the CON tasks. A: percent change in the discrepancy between the position of the target and the end point of the saccades made to it after injection for each target location. Data are from 60 min before injection and from 0 to 60 min after injection. Squares with dashed lines indicate 0% changes, and larger squares indicate greater percentage increases. The shaded square is the target location for which the discrepancy increased significantly after injection (P ⬍ 0.01, Mann-Whitney’s U test). The deficit was limited to a specific target location (10° in eccentricity, 0° in direction) during ODR task performance. No deficit appeared in performance of the CON task, which required only visually guided saccades. B: horizontal (H) and vertical (V) traces of eye movements from the onset of the go signal, and 2-dimensional trajectories (T) of saccades to the 0° target location (10° in eccentricity) for which memory-guided saccades were significantly affected, before (Pre) and after (Post) injection.
of 16 locations (8 directions and 2 eccentricities of 10 and 20°). Figure 2A shows percent changes, compared with the predrug period, in mean values of the discrepancy during the postdrug period of 60 min after injection for each target location. In this figure, the percent change in this value after injection is indicated by a solid square (the dashed square indicates 0% change). As shown in Fig. 2A, the accuracy of the memoryguided saccade, as measured by the discrepancy between the end point of the saccade relative to the exact position of the target, decreased for a specific target location; i.e., to the right (0°) with 10° eccentricity. The discrepancy for this target location was significantly larger for trials after injection than for those before injection (mean ⫾ SD; 1.46 ⫾ 1.07°, n ⫽ 8, for predrug trials; 6.43 ⫾ 1.74°, n ⫽ 11, for postdrug trials; P ⬍ 0.01, U test). The trajectories of the memory-guided saccades to this target location are illustrated in Fig. 2B. In Fig. 2B, superimposed horizontal, vertical, and two-dimensional trajectories of saccades made to the affected target over repeated trials reflect performance before injection and within 60 min after injection. As shown in Fig. 2B, following MUS J Neurophysiol • VOL
injection, the variability of the memory-guided saccades increased and they were less accurate. To examine the time course of the effect induced by MUS injection, the accuracy of saccades before and after injection was calculated for the injection described in the preceding text. Figure 3A shows the results in which the discrepancy for a specific target location (0° direction and 10° eccentricity) is illustrated. As shown, the discrepancy in the memory-guided saccade increased within 20 min after MUS injection, reached a peak at ⬃40 min, and gradually returned to the predrug control level, although the discrepancy did not reach the control level within this session. To examine whether or not the velocity of the memory-guided saccade was affected by MUS, the relationship between the amplitude and the peak velocity of the saccades was examined. In Fig. 3B, velocity is plotted against amplitude for memory-guided saccades in ODR trials before (E) and within 60 min after MUS injection (F). Only the memory-guided saccades to the two targets located in the 0° direction (eccentricities, 10 and 20°) were examined because this direction was the most strongly affected by
86 • OCTOBER 2001 •
www.jn.org
PREFRONTAL REPRESENTATION OF VISUOSPATIAL MEMORY
2045
FIG. 3. A: time courses of the change in the discrepancy between the target location and the end point of the saccade for the ODR and CON tasks. Data are the same as those in Fig. 2, and data for the target location (inset) that was significantly affected by MUS injection are shown. Means and SE (bar) based on 3–7 trials per time point. B: relationships between amplitude and peak velocity of memory-guided saccades in the ODR task before and after MUS injection. The data are the same as those for Fig. 2, and the data for target locations in the 0° direction (eccentricities of 10 and 20°) (inset) are shown. Each point represents a memory-guided saccade. E, data before injection; ●, data within 60 min after the injection. The relationship between the amplitude and velocity of the saccade was similar before and after the injection.
injection. As shown in Fig. 3B, the velocity of the memory-guided saccades did not change after injection. In contrast to the ODR task, performance in the CON task was not affected by MUS injection: performance in the CON task was 100% correct for all target locations throughout the experimental session, and the discrepancy did not significantly change for any target location after injection (Fig. 2A), including the target located at 0° (10° eccentricity), for which memory-guided saccades were impaired (1.36 ⫾ 0.65°, n ⫽ 7, for the predrug trial; 1.25 ⫾ 0.39°, n ⫽ 11, for the postdrug trial; P ⬎ 0.05, NS, U test). The trajectories of visually guided
saccades to this target location were similar before and after injection (Fig. 2B). Furthermore, the accuracy of the visually guided saccade in the CON task was constant throughout the experimental period (Fig. 3A). Another example of the effect of MUS injection into the dorsolateral PFC on task performance is illustrated in Fig. 4. MUS was injected into a site close to the rostral edge of the upper arcuate sulcus, and errors in ODR performance appeared for a specific target in the upper-right (45°) visual field with 20° eccentricity (Fig. 4A). Memory-guided saccades toward this target location were misdirected or distorted after injection
FIG. 4. Effects of MUS injection on performance in the ODR and CON tasks. MUS (5 g/l, 1 l) was injected into a site in the left PFC (inset) while the monkey (SA) performed the ODR and CON tasks. Format as in Fig. 2.
J Neurophysiol • VOL
86 • OCTOBER 2001 •
www.jn.org
2046
T. SAWAGUCHI AND M. IBA
(Fig. 4B). The discrepancy for this target location significantly increased after injection (3.84 ⫾ 1.07°, n ⫽ 11, for the predrug trial; 11.08 ⫾ 6.23°, n ⫽ 15, for the postdrug trial; P ⬍ 0.01, U test). In contrast, performance in the CON task was not affected by MUS. The discrepancy did not significantly change for any target location after injection (Fig. 4A), including the target location (45° in direction and 20° in eccentricity) for which memory-guided saccades were impaired (2.92 ⫾ 0.84°, n ⫽ 10, for the predrug trial; 3.17 ⫾ 1.02°, n ⫽ 13, for the postdrug trial; P ⬎ 0.05, NS, U test). The trajectories of visually guided saccades to this target location were similar before and after injection (Fig. 4B). Thus local injections into the dorsolateral PFC induced deficits in ODR performance unaccompanied by deficits in the CON task. In the ODR task, affected targets were limited to a specific location, and the trajectories of the memory-guided saccades to such targets were abnormal after injection; they were frequently misdirected or distorted.
more strongly impaired for trials with longer delays. The percent increase in the discrepancy for the affected target was the smallest for trials with a 2-s delay, followed by trials with a 4-s delay; the largest increase in discrepancy was observed with a 6-s delay. The mean discrepancy for the affected target location during predrug trials was 3.34 ⫾ 1.36° (n ⫽ 8) for a 2-s delay, 3.64 ⫾ 1.43° (n ⫽ 8) for a 4-s delay, and 2.81 ⫾ 1.41° (n ⫽ 7) for a 6-s delay, with no significant differences among trials with different delays (ANOVA, df ⫽ 2, 20, F ⫽ 0.666, P ⫽ 0.525, NS). The mean discrepancy during postdrug trials was 10.13 ⫾ 8.04° (n ⫽ 8) for a 2-s delay, 17.37 ⫾ 11.01° (n ⫽ 8) for a 4-s delay, and 24.02 ⫾ 10.27° (n ⫽ 12) for a 6-s delay, with a significant difference among trials with different delays (ANOVA, df ⫽ 2, 27, F ⫽ 6.054, P ⬍ 0.01). The discrepancy for a 2-s delay was significantly smaller than those for a 4-s delay (P ⬍ 0.05, U test) and a 6-s delay (P ⬍ 0.01), although there was no significant difference between trials with 4- and 6-s delays (P ⬎ 0.05, NS).
Delay dependency
Dose dependency
The effect of MUS depended on the delay length: longer delays were associated with larger deficits in ODR performance for all eight injection sites examined. An example is shown in Fig. 5. In this case, MUS was injected into a site in the left dorsolateral PFC of monkey TA while it was performing the ODR task with delay periods of 2, 4, and 6 s. As shown in Fig. 5, the largest deficit appeared at the 315° target location with 20° eccentricity for trials with each delay. The trajectories of memory-guided saccades toward this target location were
The effect of MUS was dose dependent: a larger dose of MUS (10 g, 2 l) induced larger deficits in ODR performance, compared with the standard dose (5 g, 1 l), for all five injection sites examined; no deficits occurred for CON performance even with the highest dose of MUS in all of the injection sites. For the case shown in Fig. 6, the largest deficit in the ODR task appeared for the right (0°) target direction with 10° eccentricity when the standard dose (5 g, 1 l) of MUS was injected (Fig. 6A). For this target location, the discrepancy was significantly increased
FIG. 5. Delay-dependent effect of MUS on ODR performance. MUS (5 g/l, 1 l) was injected into a site in the left PFC (inset) while the monkey (TA) performed the ODR task with delays of 2, 4, and 6 s. A: percent change in the discrepancy between the target location and the end point of the saccades made to it after injection for each target location. Data are for 40 min before injection and from 0 to 60 min after injection and are shown separately for different delays. 1, the target location for which the discrepancy increased significantly after the injection (P ⬍ 0.05, Mann-Whitney’s U test). B: 2-dimensional trajectories of saccades to the 315° target location (20° in eccentricity) for which memory-guided saccades were significantly affected, before (Pre) and after (Post) injection. Data are shown separately for different delays.
J Neurophysiol • VOL
86 • OCTOBER 2001 •
www.jn.org
PREFRONTAL REPRESENTATION OF VISUOSPATIAL MEMORY
2047
FIG. 6. Dose-dependent effect of MUS injections on ODR performance. Different doses of MUS (5 g, 1 l; and 10 g, 2 l) were injected into the same site (inset, monkey TA) at different daily sessions. A: data for a standard dose of MUS (5 g, 1 l). Percent change in the discrepancy between the position of the target and the end point of the saccades made to it after injection for each target location. Data are for 40 min before injection and from 0 to 60 min after injection. 1, the target location for which the discrepancy increased significantly after the injection (P ⬍ 0.01, Mann-Whitney’s U test). Two-dimensional trajectories of saccades are illustrated for 4 different target locations (1, 2, 3, 4), before (Pre) and after (Post) injection. B: data for a higher dose of MUS (10 g, 2 l). Format as in A.
(2.67 ⫾ 1.72°, n ⫽ 14, for the predrug trial; 7.76 ⫾ 5.99°, n ⫽ 10, for postdrug trials; P ⬍ 0.01, U test), and memory-guided saccades were misdirected or distorted (Fig. 6A). No other target location was affected by injection, as with other cases examined with the standard dose of MUS. When a higher dose (10 g, 2 l) of MUS was injected in a different daily session (Fig. 6B), memory-guided saccades for the same target location (0° in direction, 10° in eccentricity) were impaired: the discrepancy for this target location was significantly increased after injection (1.79 ⫾ 1.24°, n ⫽ 8, for the predrug trial; 7.36 ⫾ 5.80°, n ⫽ 12, for postdrug trials; P ⬍ 0.01, U test). Furthermore, memoryguided saccades were also impaired for three target locations surrounding this target location; i.e., the upper-right (45°) location with 10° eccentricity, right (0°) location with 20° eccentricity, and lower-right (315°) location with 10° eccentricity. The discrepancy values (predrug vs. postdrug trials) were 2.13 ⫾ 0.99° (n ⫽ 10) J Neurophysiol • VOL
versus 7.63 ⫾ 4.54° (n ⫽ 12; P ⬍ 0.01) for the 45° direction with 10° eccentricity, 3.55 ⫾ 1.46° (n ⫽ 8) versus 9.74 ⫾ 6.43° (n ⫽ 11; P ⬍ 0.05) for the 0° direction with 20° eccentricity, and 1.93 ⫾ 1.47° (n ⫽ 7) versus 6.59 ⫾ 5.44° (n ⫽ 13; P ⬍ 0.05) for the 315° direction with 10° eccentricity. Thus a higher dose of MUS induced deficits in memory-guided saccades for additional target locations surrounding the particular target location that was impaired with the standard dose of MUS. Relationships between injection sites and target locations affected There was a constant relationship between injection sites and target locations that were affected in the ODR task by MUS injection, as shown in the example in Fig. 7. In this figure, the percent change in discrepancy in memory-guided saccades in
86 • OCTOBER 2001 •
www.jn.org
2048
T. SAWAGUCHI AND M. IBA
FIG. 7. Effects of MUS injection into different sites of the dorsolateral PFC on ODR task performance. MUS was injected into 4 different sites of the left prefrontal cortex of monkey SA. Data are for 40 min before injection and from 0 to 60 min after injection for each injection site. Conventions are the same as in Fig. 2A. The deficit was limited to a specific target location in every case, and the target location that was affected varied by the site of the injection.
ODR performance is illustrated for four typical injection sites in the left hemisphere of monkey SA. Injection into a caudal site close to the principal sulcus affected the memory-guided saccade toward the upper, peripheral target location (90° direction, 20° eccentricity); injection into a site close to the middle of the principal sulcus affected the memory-guided saccade toward the lower-right, peripheral target location (315° direction, 20° eccentricity); injection into a more rostral site in the dorsal convexity affected the memory-guided saccade toward the lower, more central target location (270° direction, 10° eccentricity); and injection into a caudal site of the dorsolateral PFC affected the memory-guided saccade toward the upper-right, more central target location (45° direction, 10° eccentricity). Figure 8 summarizes the relationships between each injection site and the direction and eccentricity of the target location that was the most strongly affected by each injection for three hemispheres of the two monkeys (SA and TA). In all three hemispheres, the deficits in memory-guided saccades caused by MUS injection were limited to a few specific, usually contralateral, target locations. In the left hemisphere of monkey SA, injection into rostral sites of the dorsolateral PFC induced deficits in memory-guided saccades to lower target locations, whereas injection into caudal sites affected memory-guided saccades to upper locations. Injection into lateral sites affected memory-guided saccades to a peripheral target location (i.e., 20° in eccentricity), and injection into more medial sites affected memory-guided saccades to a more central location (10° in eccentricity). The injection sites associated with deficits for horizontal target locations (i.e., 0°) were arranged J Neurophysiol • VOL
from medial to lateral, and those associated with deficits in vertical target locations (90 or 270°) appeared to be arranged from caudal to rostral. Similar topographic relationships were found in both hemispheres of the other monkey TA (TA-L and TA-R in Fig. 8). Injections into the FEF As a comparison, MUS was injected into a total of eight sites in the FEF, although we did not extensively test in the FEF. In all of the injection sites, MUS affected saccades in the both ODR and CON tasks, and a typical example is shown in Fig. 9. In this case, MUS was injected into a site close to the arcuate sulcus of the left hemisphere, where ICMS induced eye movement. MUS injection affected memory-guided saccades during ODR performance as well as visually guided saccades during CON performance; the effect was the most significant for lower-right target locations (225°), in particular, with 20° eccentricity (Fig. 9A). Memoryguided saccades toward this target location (i.e., 225°, 20° eccentricity) were misdirected or distorted after injection, as were visually guided saccades, but not to the same extent; smaller saccades were more frequently observed after injection (Fig. 9B). Indeed, the amplitude of visually guided saccades toward this location in the CON task was significantly shorter for postdrug trials (17.56 ⫾ 2.62°, n ⫽ 9) than for predrug trials (20.92 ⫾ 1.26°, n ⫽ 11; P ⬍ 0.01, U test). The discrepancy for this target location significantly increased after injection for both the ODR and CON tasks (2.16 ⫾ 1.15°, n ⫽ 7, for the predrug trial; 8.96 ⫾ 6.72°, n ⫽ 10, for the postdrug trial; P ⬍ 0.01, for ODR; and
86 • OCTOBER 2001 •
www.jn.org
PREFRONTAL REPRESENTATION OF VISUOSPATIAL MEMORY
2049
FIG. 8. Topographic relationships between the site of injection and the direction and eccentricity of the affected target location, illustrated on surfaces of the 3 hemispheres of monkeys SA and TA (L, left hemisphere; R, right hemisphere). Different-shaded symbols indicate injection sites that were associated with deficits of memory-guided saccades to different directions (0 –360° at 45° intervals) or eccentricities (10 and 20°; insets); when the injection affected 1 target location, the target location that was most strongly affected by the injection was shown. ●, ineffective sites. Injections into more lateral regions of the dorsolateral prefrontal cortex affected more peripheral locations in the visual field, and injections into more caudal portions preferentially affected upper-field locations.
1.91 ⫾ 1.15°, n ⫽ 9, for the predrug trial; 4.04 ⫾ 1.88°, n ⫽ 11, for the postdrug trial; P ⬍ 0.05, for CON). The onset latency also significantly increased after injection for the both the ODR and CON tasks (257 ⫾ 19 ms for the predrug trial; 345 ⫾ 73 ms for the postdrug trial; P ⬍ 0.01 for ODR; and 265 ⫾ 27 ms for the predrug trial; 380 ⫾ 53 ms for the postdrug trial; P ⬍ 0.01, for CON). Further, the velocities of both memory- and visually guided saccades appeared to become slower after injection, as evident in Fig. 10, in which the peak velocity is plotted against amplitude for saccades in the ODR (left) and CON (right) trials before (E) and after MUS injection (F). Thus MUS injection into the FEF increased the discrepancy and onset latency of both memory- and visually guided saccades and made both saccades slower. DISCUSSION
Involvement of a specific site in the PFC in working memory for a specific visuospatial coordinate In the present study, we locally injected MUS (usually 5 g, 1 l) at various sites in the dorsolateral PFC of monkeys and J Neurophysiol • VOL
observed the behavioral consequences in an ODR task. The ODR task required memory-guided saccades for locations throughout both visual fields and, hence, required working memory for visuospatial information (Funahashi et al. 1989). Since the intracerebral injection of a few microliters of MUS suppresses the activity of neurons within a few cubed millimeters of the injection site for some hours (cf. Kurata and Hoffman 1994), the present method is useful for mapping the normal function of a small region of the cerebral cortex. One microliter of solution injected into cerebral tissue has been demonstrated to spread ⬃1 mm in diameter (Myers 1966). The local injection of 1 l MUS induced deficits in memoryguided saccades to a few specific, usually contralateral, target locations that varied with the location of the injection site. The deficit was characterized by misdirection/distortion of memoryguided saccades and a decrease in accuracy as measured by the discrepancy between the end point of the saccade relative to the remembered target location. No deficits appeared for the CON task in which the subject was required to make a visually guided saccade to a visible target. The CON task required sustained attention, and all of the perceptual and motor features
86 • OCTOBER 2001 •
www.jn.org
2050
T. SAWAGUCHI AND M. IBA
FIG. 9. Effects of MUS injection into the frontal eye field (FEF) on performance in the ODR and CON tasks. MUS (5 g/l, 1 l) was injected into a site in the left FEF (inset) while the monkey (SA) performed the ODR and CON tasks. Format as in Fig. 2. The eye traces (B) are for saccades to the 225° target location (20° in eccentricity) for which saccades were the most affected by the injection.
of the ODR task, but did not require working memory. Therefore factors other than the mnemonic demand, such as deficits in global attention, sensory perception, or execution of movements, can be excluded as explanations for the deficit in ODR
performance, suggesting that such deficits specifically involve the working memory process. Furthermore, the effect of MUS depended on the delay length, and longer delays were associated with larger deficits in ODR performance. In contrast to the
FIG. 10. Relationships between amplitude and peak velocity of memory-guided saccades in the ODR task and visually guided saccades in the CON task before and after MUS injection into the FEF. The data are the same as those for Fig. 9, and the data for target locations in the 225° direction (eccentricities of 10° and 20°; inset) are shown. E, data before injection; ●, data within 60 min after injection.
J Neurophysiol • VOL
86 • OCTOBER 2001 •
www.jn.org
PREFRONTAL REPRESENTATION OF VISUOSPATIAL MEMORY
dorsolateral PFC, MUS injections into the FEF affected both memory-guided saccades in the ODR task and visually guided saccades in the CON task, which is consistent with a previous study with MUS injection into the FEF (Dias and Segraves 1999); the FEF is considered to be involved in the voluntary saccade-generation/control mechanism itself, as has been emphasized by other authors (e.g., Bruce et al. 1985; Dias and Segraves 1999). These findings emphasize the basic mnemonic function of the dorsolateral PFC: it is essential for guiding behavior by internal cues, rather than by external sensory cues. We previously dissociated mnemonic and sensorimotor components of the ODR in our study of D1 dopamine receptor antagonism in the dorsolateral PFC (Sawaguchi and GoldmanRakic 1991, 1994), which is consistent with the present finding. Thus a specific site in the dorsolateral PFC appears to be responsible for the working memory process for a specific visuospatial coordinate to guide goal-directed behavior. “Memory map” representation in the PFC One of the striking findings in the present study is that the injection sites and affected spatial locations of the target showed a gross topographic relationship; injections into more caudal sites of the dorsolateral PFC induced deficits in memory-guided saccades to upper target locations, and injections into more lateral sites affected memory-guided saccades to more peripheral target locations. The affected target locations were mainly located in the visual field contralateral to the injection site. These findings suggest that the dorsolateral PFC of each hemisphere contains a topographical memory map for representing visuospatial working memory, mainly for the contralateral visual field, as schematically illustrated in Fig. 11. The memory map in each hemisphere appears to contain a horizontal meridian of the memory field oriented perpendicular to the principal sulcus, and a vertical meridian on the dorsomedial convexity that might form a U-shaped curve surrounding the horizontal meridian. This conclusion is consistent with evidence from studies using physiological recordings (Funahashi et al. 1989), surgical lesions (Funahashi et al. 1993), and chemical dysfunction with dopamine antagonists (Sawaguchi and Goldman-Rakic 1990, 1994) that individual neurons of
2051
the dorsolateral PFC have memory fields, mainly for the contralateral visual field, and appear to be distributed topographically, although neuronal data on this point are still scarce. In previous studies using bicuculline methiodide (BMI), a GABA antagonist, and a manual delayed-response (DR) task with left-right cues in monkeys, injections of BMI into the dorsolateral PFC induced directional errors in the DR task (Sawaguchi et al. 1988, 1989). The effective site for BMI injection was limited to the bottom of the principal sulcus. Based on the results of the present study, the memory map appears to be represented mainly in the dorsal convexity of the PFC, in which BMI injections did not induce any directional errors in previous studies. The discrepancy between the present and previous studies may be due to the fact that the previous studies did not control eye movements of monkeys, and the subjects were not required to maintain fixation during trials. Under these conditions, the monkey may be able to receive visuospatial cues in a given visual filed and no deficits occurred following BMI injection into any sites in the dorsal convexity that are associated with specific visuospatial coordinates in the memory map. It is also possible, and more likely, that injection sites in the dorsolateral convexity in the previous studies were limited and outside of sites that are specifically associated with the left-right coordinate (with eccentricities of 10 and 20°) in the memory map. In addition, there is another possibility that the memory map in the dorsal convexity is just for eye movement, although this is less likely since the dorsal convexity has connections with nonprimary motor cortical areas, such as the premotor cortex (Barbas et al. 1999; Watanabe-Sawaguchi et al. 1991). On the other hand, the present study did not explore the depth of the principal sulcus, and it is unknown whether or not there is an additional memory map in the principal sulcal cortex. However, previous lesion studies have demonstrated that the principal sulcal area is critical for manual DR (Gross and Weiskrantz 1962) and ODR (Funahashi et al. 1993) tasks, and the BMI-injection studies indicated that the bottom of the principal sulcus is critical for the manual DR task. Therefore it is plausible that an additional memory map might be represented in the principal sulcal cortex. This problem should be examined by further studies.
FIG. 11. Memory map representation in the dorsolateral PFC. Data regarding direction and eccentricity in Fig. 8 were combined to illustrate schematically the relationship between the injection site and the target location affected. Colored areas and solid curves indicate directions and eccentricities of the memory field, respectively (inset). Dashed curves indicate putative horizontal and vertical meridians of the memory map.
J Neurophysiol • VOL
86 • OCTOBER 2001 •
www.jn.org
2052
T. SAWAGUCHI AND M. IBA
Relations to visuospatial topographic representation in other cortical areas Topographic representation of visual fields has been suggested in extrastriate cortical areas that are connected to the dorsolateral PFC and are involved in visuospatial information processing. For example, in areas 7a and PO, which are connected to the dorsolateral PFC, visual fields appear to be topographically organized because different regions of area 7a are topographically connected to different regions of area PO, which are in turn connected topographically to different regions of V1 and V2 that are associated with different portions of the visual field (Colby et al. 1988). Neuronal activities of area 7a during ODR performance are very similar to those of the dorsolateral PFC and are involved in visuospatial working memory processes (Chafee and Goldman-Rakic 1998). Therefore it is likely that the dorsolateral PFC is topographically connected to the posterior parietal area, as noted by GoldmanRakic (1988). The posterior parietal area might also contain a memory map that is interconnected and interacts with the memory map of the dorsolateral PFC for representing visuospatial working memory processes; this problem should be examined in further studies. In their study of the activity of single neurons, Suzuki and Azuma (1983) demonstrated that visual fields for visual perception/attention are topographically represented on caudolateral regions of the PFC (this region seems to involve part of rostral area 8 and part of caudal area 46). Based on their findings, more peripheral visual fields are represented in a more medial region of the caudolateral area of the PFC, and more central visual fields are represented in more lateral regions. In the case of a memory map, more peripheral memory fields are represented in more medial regions of the dorsal convexity of the PFC, and more central memory fields are represented in more lateral regions. Therefore the memory field represented in the dorsolateral PFC appears to be a mirror image of the representation of the visual field in the caudolateral region of the PFC. Furthermore, in the FEF, which occupies part of area 8, the amplitude of the saccade evoked by electrical stimulation is represented topographically, with large and small saccades represented medially and laterally, respectively (Bruce et al. 1985). This representation also appears to be a mirror image of the representation of eccentricity in the memory map in the dorsolateral PFC. Since the dorsolateral PFC is connected to area 8 (Arikuni et al. 1980, 1988; Watanabe-Sawaguchi et al. 1991), it is likely that these two regions are connected topographically, and information is also processed topographically in these regions. Mirror-image representation of the visual field occurs in some visual cortical areas (e.g., V1, V2, and V3) that are adjacent to each other, and mirror-image somatic representation is present in somatosensory cortical areas, such as 3a and 3b (Kaas 1983, 1987, 1989, 1993). A similar principle of mirror-image representation may be present in areas of the dorsolateral PFC. Topographic modular representation of working memory in the PFC The connections between the dorsolateral PFC and other cortical areas, including the posterior parietal areas and area 8, are organized modularly; terminal fields as well as cells at the J Neurophysiol • VOL
origin form a vertically arranged modular organization called a “module” or “column” (Arikuni et al. 1988; Bugbee and Goldman-Rakic 1983; Goldman-Rakic 1984; Goldman-Rakic and Schwartz 1982; Watanabe-Sawaguchi et al. 1991). The width of the corticocortical columns of the PFC has been estimated to be 400 –1200 m, with a median of ⬃700 m in rhesus monkeys (Bugbee and Goldman-Rakic 1983). Columnar/modular organization has also been found for intrinsic connections within the dorsolateral PFC (Levitt et al. 1993; Pucak et al. 1996), and functional columns have been visualized in our preliminary studies with optical recording techniques with a voltage-sensitive dye in brain slices of the monkey dorsolateral PFC (Nakamura and Sawaguchi 1995; Sawaguchi 1996). Considering these and the present findings, it is likely that visuospatial memoranda are represented in different modules/columns that are arranged topographically in the dorsolateral PFC. The different modules may be connected to different modules of other cortical areas, such as posterior parietal areas and area 8, that are involved in visuospatial functions. Different channels formed by these different modules may be involved in a series of visuospatial working memory processes for different parts of the visual field. Thus memoranda for visuospatial information appear to be represented as a memory map consisting of modules/columns arranged topographically in the dorsolateral PFC. However, the region examined as well as the target locations presented were limited, and we did not explore the depth of the sulcus. In addition, our method using MUS injection is limited with regard to fine-grained mapping. Therefore further studies with various techniques, such as optical imaging in vivo, are required to reveal the entire detailed memory map and to examine whether or not there are multiple memory maps within the PFC. Nevertheless, the present findings enable us to conclude that a specific site in the dorsolateral PFC is involved in the mnemonic function/process for a specific visuospatial coordinate, which should be important for understanding the functional organization of the PFC for representing visuospatial working memory processes. We thank K. Watanabe-Sawaguchi for assistance with the animal care and histological experiments. This work was supported by a Grant-in-Aid for Scientific Research on Priority Areas (08279105) from the Japanese Ministry of Education, Science, Sports and Culture to T. Sawaguchi. REFERENCES ARIKUNI T, SAKAI M, HAMADA I, AND KUBOTA K. Topographical projections from the prefrontal cortex to the post-arcuate area in the rhesus monkey, studied by retrograde axonal transport of horseradish-peroxidase. Neurosci Lett 19: 155–160, 1980. ARIKUNI T, WATANABE K, AND KUBOTA K. Connections of area 8 with area 6 in the brain of the macaque monkey. J Comp Neurol 277: 21– 40, 1988. BADDELEY A. Working Memory. Oxford, UK: Oxford Univ. Press, 1986. BADDELEY A. Working memory. Science 255: 556 –559, 1992. BARBAS H, GHASHGHAEI H, DOMBROWSKI SM, AND REMPEL-CLOWER NL. Medial prefrontal cortices are unified by common connections with superior temporal cortices and distinguished by input from memory-related areas in the rhesus monkey. J Comp Neurol 410: 343–367, 1999. BRUCE CJ, GOLDBERG ME, STANTON GB, AND BUSHNELL MC. Primate frontal eye fields. II. Physiological and anatomical correlates of electrically evoked eye movements. J Neurophysiol 53: 714 –734, 1985. BUGBEE NM AND GOLDMAN-RAKIC PS. Columnar organization of corticocortical projection in squirrel and rhesus monkeys: similarity of column width in species differing in cortical volume. J Comp Neurol 220: 355–364, 1983.
86 • OCTOBER 2001 •
www.jn.org
PREFRONTAL REPRESENTATION OF VISUOSPATIAL MEMORY CHAFEE MV AND GOLDMAN-RAKIC PS. Matching patterns of activity in primate prefrontal area 8a and parietal area 7ip neurons during a spatial working memory task. J Neurophysiol 79: 2919 –2940, 1998. COLBY CL, GATASS R, OLSON CR, AND GROSS CG. Topographical organization of cortical afferents to extrastriate visual area PO in the macaque: a dual trace study. J Comp Neurol 269: 392– 413, 1988. DIAS EC AND SEGRAVES MA. Muscimol-induced inactivation of monkey frontal eye field: effects on visually and memory-guided saccades. J Neurophysiol 81: 2191–2214, 1999. FUNAHASHI S AND KUBOTA K. Working memory and prefrontal cortex. Neurosci Res 21: 1–11, 1994. FUNAHASHI S, BRUCE CJ, AND GOLDMAN-RAKIC PS. Mnemonic coding of visual space in the monkey’s dorsolateral prefrontal cortex. J Neurophysiol 61: 331–349, 1989. FUNAHASHI S, BRUCE CJ, AND GOLDMAN-RAKIC PS. Dorsolateral prefrontal lesions and oculomotor delayed-response performance: evidence for mnemonic “scotomas.” J Neurosci 13: 1479 –1497, 1993. GOLDMAN-RAKIC PS. Modular organization of prefrontal cortex. Trends Neurosci 7: 419 – 424, 1984. GOLDMAN-RAKIC PS. Topography of cognition: parallel distributed networks in primate association cortex. Annu Rev Neurosci 11: 137–156, 1988. GOLDMAN-RAKIC PS. Cellular basis of working memory. Neuron 14: 477– 485, 1995. GOLDMAN-RAKIC PS AND SCHWARTZ ML. Interdigitation of contralateral and ipsilateral columnar projections to frontal association cortex in primates. Science 216: 755–757, 1982. GROSS CG AND WEISKRANTZ L. Evidence of dissociation of impairement in auditory discrimination and delayed response following lateral frontal lesions in monkeys. Exp Neurol 5: 453– 476, 1962. KAAS JH. What, if anything, is SI? Organization of the first somatosensory area of cortex. Physiol Rev 63: 206 –231, 1983. KAAS JH. The organization of neocortex in mammals: implications for theories of brain function. Annu Rev Psychol 38: 129 –151, 1987. KAAS JH. Why does the brain have so many visual areas? J Cogn Neurosci 1: 121–135, 1989. KAAS JH. The functional organization of somatosensory cortex in primates. Ann Anat 175: 509 –518, 1993. KURATA K AND HOFFMAN DS. Differential effects of muscimol microinjection into dorsal and ventral aspects of the premotor cortex of monkeys. J Neurophysiol 71: 1151–1164, 1994. LEVITT JB, LEWIS DA, YOSHIOKA T, AND LUND JS. Topography of pyramidal neuron intrinsic connections in macaque monkey prefrontal cortex (area-9 and area-46). J Comp Neurol 338: 360 –376, 1993.
J Neurophysiol • VOL
2053
MYERS RD. Injection of solutions into cerebral tissue: relation between volume and diffusion. Physiol Behav 1: 171–174, 1966. NAKAMURA K AND SAWAGUCHI T. Columnar and laminar transmission of activity in the monkey prefrontal cortex revealed by optical imaging in vitro. Soc Neurosci Abstr 21: 372.5, 1995. PUCAK ML, LEVITT JB, LUND JS, AND LEWIS DA. Patterns of intrinsic and associational circuitry in monkey prefrontal cortex. J Comp Neurol 376: 614 – 630, 1996. SAWAGUCHI T. Functional modular organization of the primate prefrontal cortex for representing working memory process. Cogn Brain Res 5: 157– 163, 1996. SAWAGUCHI T AND GOLDMAN-RAKIC PS. Topographic representation of memory in the prefrontal cortex of monkeys revealed by local application of bicuculline. Soc Neurosci Abstr 16: 100, 1990. SAWAGUCHI T AND GOLDMAN-RAKIC PS. D1 dopamine receptors in prefrontal cortex: involvement in working memory. Science 251: 947–950, 1991. SAWAGUCHI T AND GOLDMAN-RAKIC PS. The role of D1-dopamine receptor in working memory: local injections of dopamine antagonists into the prefrontal cortex of rhesus monkeys performing an oculomotor delayed-response task. J Neurophysiol 71: 515–528, 1994. SAWAGUCHI T, MATSUMURA M, AND KUBOTA K. Delayed response deficit in monkeys by locally disturbed prefrontal neuronal activity by bicuculline. Behav Brain Res 31: 193–198, 1988. SAWAGUCHI T, MATSUMURA M, AND KUBOTA K. Delayed response deficits produced by local injection of bicuculline into the dorsolateral prefrontal cortex in Japanese macaque monkeys. Exp Brain Res 75: 457– 469, 1989. SAWAGUCHI T AND YAMANE I. Properties of delay-period neuronal activity in the monkey dorsolateral prefrontal cortex during a spatial delayed matchingto-sample task. J Neurophysiol 82: 2070 –2080, 1999. SAWAGUCHI T, YAMANE I, AND KUBOTA K. Application of the GABA antagonist bicuculline to the premotor cortex reduces the ability to withhold reaching movements by well-trained monkeys in visually guided reaching task. J Neurophysiol 75: 2150 –2156, 1996. SOMMER MA AND TEHOVNIK EJ. Reversible inactivation of macaque frontal eye field. Exp Brain Res 116: 229 –249, 1997. SUZUKI H AND AZUMA M. Topographic studies on visual neurons in the dorsolateral prefrontal cortex of the monkey. Exp Brain Res 53: 47–58, 1983. WALKER AE. A cytoarchitectural study of the prefrontal area of macaque monkey. J Comp Neurol 73: 59 – 86, 1940. WATANABE-SAWAGUCHI K, KUBOTA K, AND ARIKUNI T. Cytoarchitecture and intrafrontal connections of the frontal cortex of the brain of the hamadryas baboon (Papio hamadryas). J Comp Neurol 311: 108 –133, 1991.
86 • OCTOBER 2001 •
www.jn.org