and an analyzer. These crystals combine to select only those x-rays traveling within a very narrow range of angular directions (on the order of 1 radian).
PRELIMINARY INVESTIGATION OF A MULTIPLE-IMAGE RADIOGRAPHY METHOD Miles N. Wernick,1 Oliver Wirjadi,1 Dean Chapman,2 Oral Oltulu,2 Zhong Zhong,3 and Yongyi Yang1 1
Dept. of Electrical and Computer Engineering, Illinois Institute of Technology (IIT), Chicago, IL 60616 USA 2 Dept. of Biological, Chemical, and Physical Sciences, IIT, Chicago, IL 60616 USA 3 National Synchrotron Light Source, Brookhaven National Laboratory, Upton, NY 11973 USA ABSTRACT
Conventional radiography seeks to produce, at each location in the image plane, a measure of the x-ray absorption of the object. In this paper, we present a method of determining a much more complete object description at each point, namely the intensity distribution (as a function of angle) of the emerging x-ray beam. From this distribution one can compute many different images, depicting the refraction, absorption, and scattering characteristics of the object. The method is based on acquisition of multiple x-ray images using monochromator and analyzer crystals, followed by a deconvolution operation (over angle) at each pixel. Parameters of the deconvolved angular intensity function are measured to obtain the various images of interest. We present experimental results obtained using x-rays produced by a synchrotron, along with simulated images showing the effect of noise in a hypothetical photonlimited imaging situation.
sensitive methods in that it derives contrast from absorption, refraction gradient, and small-angle scatter rejection (extinction) [6].
1. INTRODUCTION Conventional radiographic imaging depicts only one physical parameter of the object: x-ray absorption. Other possibly informative effects such as refraction are not normally measured. An additional limitation of conventional radiography is the presence of scatter, which can obscure important image details. In this paper we present an x-ray imaging method that produces a more-complete object description than conventional radiography, while rejecting undesired scatter. We refer to the proposed method as multipleimage radiography (MIR). The method produces images showing significantly greater contrast than conventional radiographs, while yielding new images that are not obtained in conventional radiography. We are hopeful that this approach will ultimately produce images conveying new diagnostic information for evaluation of cartilage, breast, and other tissues. In the past several years a number of x-ray imaging techniques have been developed that derive contrast from the phase properties of the object being imaged [1-8]. The diffraction enhanced imaging (DEI) technique of Chapman et al. [6], a precursor to the proposed MIR method, is unique among existing phase-
0-7803-7584-X/02/$17.00 ©2002 IEEE
129
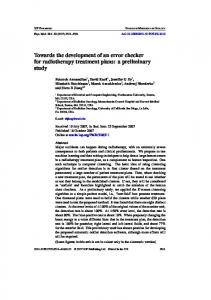
Conventional radiograph
Figure 1. Images computed by proposed method, with conventional radiograph shown for comparison. The refraction image shows principally the Lucite rod. The absorption image, in comparison with the conventional radiograph is much clearer due to scatter rejection. The kurtosis image clearly shows smallangle-scattering by the layers of paper in the phantom.
Though DEI makes use of various contrast mechanisms, the proposed MIR approach goes beyond DEI to produce an angular intensity distribution of the xray beam, within the ultra-small-angle regime, for every image location. In addition, MIR permits many different images to be derived for display purposes, showing
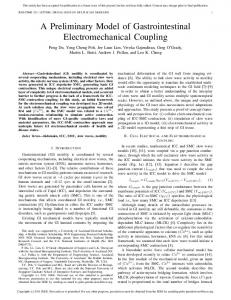
separately, or in combination, the effects of refraction, ultra-small-angle scatter, and absorption. Compared with the absorption contrast of conventional radiography, both DEI and MIR promise to make object features more visible by utilizing one or more contrast mechanisms [6-8]. Figure 1 shows example images obtained by the MIR technique, along with a conventional radiograph of the same object for comparison. It is apparent that potentially important object information is conveyed by the MIR method, which is not contained in an ordinary radiograph. 2. OVERVIEW OF THE METHOD The proposed method makes use of the imaging system This is the same hardware shown in Figure 2. configuration as is used in DEI. Details of the experimental setup are given in Sect. 4. The imaging method is based on pixel-by-pixel measurement of the object (although line scanning is used in practice for faster data acquisition). At each pixel, the beam emerging from the object is analyzed to determine the distribution of its angular components. This is accomplished by using a system of diffracting crystals, including a monochromator and an analyzer. These crystals combine to select only those x-rays traveling within a very narrow range of angular directions (on the order of 1 Pradian). Im a g e P D e te c to
Image plate detector
S i( 3 3 3 ) A n a ly z e r
S i( 3 3 3 ) D o u b le
Monochromator
C ry s ta l
M o n o c h ro m a to r
y n c h ro X-raySbeam
tr o n
B e a m
Object O b je c t D iff r a Analyzer
c te d
B
Figure 2. Imaging system. Rotating the analyzer produces measurements of the angular intensity distribution of the beam emerging from the object.
one angular coordinate, as illustrated in Figure 3. All of the following analyses focus on the angular coordinate for each spatial location in the image. The angular sensitivity of the imaging hardware is defined by the reflectivity of the crystal system. This sensitivity function R �T , known as the rocking curve, characterizes the x-ray output as a function of angular position of the analyzer when no object is present in the beam. The rocking curve can be viewed as the impulse response of the imaging system as a function of angle. Thus, in the absence of noise, the intensity of the beam measured by pixel n ( n 1,! , N ) after reflecting from the analyzer can be modeled simply as: yn �T R �T f n �T , (1) where denotes convolution and f n �T is the angular intensity distribution of the x-rays emerging from the object. In practice, the data are acquired at K discrete angular positions of the analyzer T k ( k 1,! , K ). Therefore, in the absence of noise, the observed data can be modeled as: yn > k @ ª¬ R �T f n �T º¼T T . (2) k
Many more-detailed models of the system output can be contemplated; however, this simple model captures the essential characteristics of the observations. Now let us consider noise in the imaging process. The crystal system greatly reduces the beam’s intensity both before and after passing through the object. In our experiments to date, we have used a synchrotron as the xray source, thus achieving a low noise level; however, an imaging system employing a more-conventional x-ray source would be photon-limited. Thus, we assume in this paper that the noise will be Poisson-distributed. For purposes of computation we approximate (2) by a discrete model of the data which, including the effect of noise, can be written as: yn [k ] � Poisson � R[k ] f n [k ] , (3) where yn [k ] , R[k ] , and f n [k ] , k
1,! , K , are discrete
representations of y �T , R �T , and f �T , respectively. 3. DECONVOLUTION OF INTENSITY FUNCTION
Figure 3. Schematic representation of MIR data set.
The monochromator-analyzer system allows very precise analysis of the angular intensity distribution of the beam after it has passed through the object, and thus contains the information needed to quantify very fine beam deflections due to refraction and ultra-small-angle scattering. It also serves to reject wide-angle scattering effects; thus, in addition to producing new types of images, the proposed MIR method produces absorption images that are superior to ordinary radiographs. An MIR data set can be thought of as a multidimensional image with two spatial coordinates and
130
The goal of the proposed method is twofold. First, we are interested in determining, for each location in the image, the angular intensity distribution of the x-ray beam after it passes through the object. This is a very complete representation of the object’s effect on the beam. Therefore, it is a potentially rich source of information for describing the object’s physical properties. Our second goal is to produce a small set of images for display that summarize the salient features of this complex data set. In this section we describe a method for performing the deconvolution required to achieve the first goal. In the next section we describe calculation of parametric images.
To compute the desired angular intensity functions f n [k ] from the raw data functions yn [k ] we invert the observation model in (3) separately for each pixel n. There are many well-known ways to approach this deconvolution problem. In our preliminary experiments we used the well-known expectationmaximization (EM) algorithm for maximum-likelihood (ML) estimation [9]. When applied to a Poisson linear model, the EM algorithm yields a simple iteration that is widely used in reconstruction of emission tomography images [10]. Adapting the iteration to our deconvolution problem yields the following simple iterative expression: ª º ½° f (i ) [k ] ° y[k ] f (i �1) [k ] K (4) ® R[k ]$« »¾ , (i ) R[k ] f [k ] ¼ ¿° ° ¬ ¯ ¦ R[k ]
Scatter causes the angular intensity distribution to broaden, and become less highly peaked. This effect can be quantified by viewing the angular intensity function as a probability density function and measuring its kurtosis. Kurtosis is zero for a Gaussian-shaped function, greater than zero for highly peaked (leptokurtic) functions, and less than zero for flatter (platykurtic) functions. The absolute value of the kurtosis can be viewed as a measure of non-Gaussianity. As applied to our problem, kurtosis is defined as: 2
K
§ K · f n [k ] � 3 ¨ ¦ (k � P ) 2 f n [k ] ¸ ,(6) k 1 ©k 1 ¹ where P is the centroid of f n [k ] , i.e., kurt ( f n [k ])
¦ (k � P )
4
K
¦ kf [k ] .
P
k 1
(7)
n
k 1
(i ) n
where f [k ] denotes the estimate of f n [k ] at iteration i , and $ denotes cross-correlation. This approach will be refined in future work to take advantage of the multichannel nature of the data for purposes of noise reduction. 4. PARAMETRIC IMAGES As we will show, it is evident that there is considerable information contained within each pixel’s angular intensity function f n [k ] . We are yet to explore the interpretation of these functions in detail, however it is easy to extract several simple parameters from each function for display purposes. In our preliminary experiments, we measured the following four parameters, yielding four different images for each data set. 1) Absorption image We represent the absorption characteristics of the object by the following effective absorption parameter for each pixel: § K · an � ln ¨ ¦ f n [k ] ¸ . ©k 1 ¹ The parameter an is proportional to the integral of the absorption coefficient over the path of the beam. The absorption image measures the same property as a conventional radiograph; however the scatter rejection properties of the imaging system produce a much better absorption image than what is normally observed, as was shown in Figure 1. 2) Refraction image We represent the refraction characteristics of the object by measuring the displacement (caused by the presence of the object) of the centroid of the recovered angular intensity distribution: T s , n centroid{ f n [k ]} � centroid{R[ k ]} . (5) 3) Kurtosis image
131
In (6) and (7) we have assumed that f n [k ] is first normalized so that its sum is unity. 4) Skewness image The combination of scatter and inhomogenous refractive index causes the angular intensity distribution to become skewed. This property can be measured by the skewness of the function, defined in our application as: K
P3
¦ (k � P )
3
f n [k ] ,
(8)
k 1
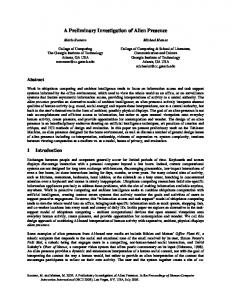
where, as in (6) and (7), f n [k ] is pre-normalized. 5. DATA ACQUISITION The data were acquired using 18keV and 40keV x-rays from at National Synchrotron Light Source X15A Imaging beamline. Owing to space limitations, we show only the 18keV results as the 40keV results are qualitatively similar. Lucite substrate Alignment target 8 7 6 5
Lucite rod
4
3
2
1
Sheets of paper
Figure 4. Phantom used in the experiments.
A physical phantom was constructed in such a way as to create various combinations of refraction, absorption, and scattering effects. Staggered sheets of paper were arranged so that the number of layers of paper ranged from one to eight. A cylindrical Lucite rod (radius 6 mm, length 51mm) was included. The paper is expected to produce ultra-small-angle scattering, but little refraction; the converse is true for Lucite. The entire phantom rested on a sheet of Lucite (6.35 mm thickness). A steel ball used for alignment appears in the corner. A total of 24 images of the phantom were acquired at 0.8 Pradian increments from –9.6 to +8.8 Pradians. The photon flux incident on the object was approximately 5.3 x 10⁶ ph/mm2 (100 milliRads, 1
milliGy). Each image consisted of 1256 u 444 pixels of dimension 50 Pm u 50 Pm. The detector was an x-ray photostimulable image plate (Fuji HR-V image plate, Fuji BAS-2500 reader with 50 Pm x 50�Pm pixel size). Background and scattered radiation on the image plate were reduced by slits. The remaining background was subtracted from every pixel in each image. Angular intensity functions f n [ k ] of example pixels
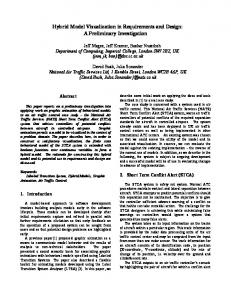
Figure 5. Angular intensity functions of pixels in: a) background, b) Lucite rod, c) eight sheets of paper, and d) edge of rod. Pixel (b) shows attenuation, and shift due to refraction. Pixel (c) shows scattering and attenuation by paper.
TABLE I. KURTOSIS AND SKEWNESS OF ANGULAR INTENSITY FUNCTIONS IN FIGURE 5.* Kurtosis ª¬ P radian 4 º¼ Skewness ª¬ P radian 3 º¼ (a) (c)
0.04 -15.9
(b) (d)
3.18 -79.0
(a) (c)
0.002 -8.02
(b) (d)
-0.36 -10.8
*Letters (a)-(d) correspond to the graph labels in Figure 5.
To simulate the effect of a photon-limited imaging environment, we considered the acquired data to be approximately noise-free in comparison to the noise level we envision. We then simulated the effect of photon noise by generating Poisson-distributed random numbers in software from the “noise-free” data. In this experiment, we simulated the case in which the highest mean photon count in the image (background region) is 300 ph/pixel. 6. RESULTS AND DISCUSSION We performed the proposed deconvolution procedure, and generated the images described in Sect. 4. The resulting images are shown in Figure 1 for the acquired data. These images clearly distinguish the rod, for its refractive effect, from the paper, which shows up strongly in the kurtosis image because of its scattering effect. Figure 5 shows examples of the deconvolved angular intensity function f n [k ] for four representative pixels in the image, as described in the caption. Table I shows corresponding kurtosis and skewness values for these plots to illustrate the way in which they quantify the data. It is possible by visual inspection to interpret the curves in Figure 5. For example, it is apparent that the Lucite rod (b) shifts the curve by refraction and lowers its total intensity by absorption; the paper (c) scatters the
132
beam leading to large negative kurtosis; the edge of the rod (d) skews the beam, leading to a high skewness value.
Figure 6. Images computed from simulated photonlimited data. Figure 6 shows image results for simulated photon-limited data. Though they are significantly degraded, they still show the important features of the object. We expect that by judicious image processing using multichannel techniques we have developed in our laboratory for other applications, we will be able to significantly improve these images. This research was supported by NIH grant R21 GM59395-01 (O.O, D.C.) and U. S. Army MRMC grant DAMD17-99-9217 (D.C.). The Nat’l Synchrotron Light Source, Brookhaven Nat’l. Lab., is supported by the U.S. D.O.E., Div. of Materials Sciences and Div. of Chemical Sciences, Contract No. DE-AC02-98CH10886 (Z.Z.). 7. REFERENCES [1] R. Fitzgerald, “Phase-Sensitive X-ray Imaging,” Physics Today, vol. 53 (7), 2000. [2] K.M. Podurets, V.A. Somenkov, S.S. Shil’stein, “Refraction-contrast radiography,” Sov. Phys. Tech. Phys., vol. 34, pp. 654-657, 1989. [3] V.A. Somenkov, A.K. Tkalich, S.S. Shil’stein, “Refraction contrast in x-ray introscopy,” Sov. Phys. Tech. Phys., vol. 36, pp. 1309-1311, 1991. [4] V.N. Ingal, E.A. Beliaevsky, “X-ray plane wave topography observation of phase contrast from a non-crystalline object,” J Phys vol. 28, pp. 2314-2317, 1995. [5] T.E. Gureyevand S.W. Wilkins, “Regimes of x-ray phasecontrast imaging with perfect crystals,” Il Nuovo Cimento vol. 19, pp. 545-552, 1997. [6] D. Chapman, W. Thomlinson, R.E. Johnston, D. Washburn, E. Pisano, N. Gmür, Z. Zhong, R. Menk, F. Arfelli, D. Sayers, “Diffraction Enhanced X-ray Imaging”, Phys. Med. Biol., vol. 42, pp. 2015-2025, 1997. [7] D. Chapman, W. Thomlinson, Z. Zhong, R.E. Johnston, E. Pisano, D. Washburn, D. Sayers, C. Segre, “Diffraction enhanced imaging applied to materials science and medicine,” Synchrotron Radiation News, vol. 11 (2), pp. 4-11, 1998. [8] Z. Zhong, W. Thomlinson, D. Chapman, D. Sayers, “Implementation of diffraction enhanced imaging experiments at the NSLS and APS,” Nucl. Instrum. Meth. A, vol. 450, pp. 556567, 2000. [9] A. P. Dempster, N. M. Laird, and D. B. Rubin, “Maximum likelihood from incomplete data via the EM algorithm,” J. Roy. Statist. Sect., vol. 39, pp. 1-38, 1977. [10] K. Lange and R. E. Carson, “EM reconstruction algorithms for emission and transmission tomography,” J. Comput. Assist. Tomogr., vol. 9, pp. 306–316, 1984.