Daytona Beach, FL 32114 ..... of the academics and 83% of the [upset-recovery] tech- ... Corporate Aviation Safety Seminar,â Orlando, Florida: Flight Safety.
DOT/FAA/AM-07/27 Office of Aerospace Medicine Washington, DC 20591
Preliminary Results of an Experiment to Evaluate Transfer of Low-Cost, Simulator-Based Airplane Upset-Recovery Training Rodney O. Rogers Albert Boquet Cass Howell Embry-Riddle Aeronautical University Daytona Beach, FL 32114 Charles DeJohn Federal Aviation Administration Civil Aerospace Medical Institute Oklahoma City, OK 73125
October 2007
Final Report
NOTICE This document is disseminated under the sponsorship of the U.S. Department of Transportation in the interest of information exchange. The United States Government assumes no liability for the contents thereof. ___________ This publication and all Office of Aerospace Medicine technical reports are available in full-text from the Civil Aerospace Medical Institute’s publications Web site: www.faa.gov/library/reports/medical/oamtechreports/index.cfm
Technical Report Documentation Page 1. Report No.
2. Government Accession No.
3. Recipient's Catalog No.
DOT/FAA/AM-07/27 4. Title and Subtitle
5. Report Date
Preliminary Results of an Experiment to Evaluate Transfer of Low-Cost, Simulator-Based Airplane Upset-Recovery Training
October 2007
7. Author(s)
8. Performing Organization Report No. 1
1
1
6. Performing Organization Code
2
Rogers RO, Boquet A, Howell C , DeJohn C 9. Performing Organization Name and Address 1
10. Work Unit No. (TRAIS)
Embry-Riddle Aeronautical University Daytona Beach, FL 32114
2
FAA Civil Aerospace Medical Institute P.O. Box 25082 Oklahoma City, OK 73125
12. Sponsoring Agency name and Address
11. Contract or Grant No.
13. Type of Report and Period Covered
Office of Aerospace Medicine Federal Aviation Administration 800 Independence Ave., S.W. Washington, DC 20591
14. Sponsoring Agency Code
15. Supplemental Notes
16. Abstract
Many air transport training programs provide simulator-based upset-recovery instruction for company pilots. However, no research exists to demonstrate that such training transfers to an airplane in flight. We report on an in-progress FAA-funded research experiment to evaluate upset-recovery training transfer. Participant pilots are trained using low-cost desktop flight simulation, then subjected to serious in-flight upsets in an aerobatic airplane. Preliminary results comparing the performance of trained and control group pilots suggest that simulator-based training may improve a pilot’s ability to recover an airplane from an upset. We summarize prior research, describe the experiment, and present results of Phase-One testing. We also detail planned refinements in Phase-Two flight training and testing that we hope will strengthen the results of our research. Although we are conducting flight testing in a general aviation airplane, our research has important implications for heavy aircraft upset recovery trainers.
17. Key Words
18. Distribution Statement
Airplane Upset-Recovery Training; Low-Cost Flight Simulation; Training Transfer
Document is available to the public through the Defense Technical Information Center, Ft. Belvior, VA 22060; and the National Technical Information Service, Springfield, VA 22161
19. Security Classif. (of this report)
Unclassified
20. Security Classif. (of this page)
Unclassified
Form DOT F 1700.7 (8-72)
21. No. of Pages
22. Price
21 Reproduction of completed page authorized
i
CONTENTS
INTRODUCTION. . . . . . . . . . . . . . . . . . . . . . . . . . . . . . . . . . . . . . . . . . . . . . . . . . . . . . . . . . . . . 1 MOTIVATION . . . . . . . . . . . . . . . . . . . . . . . . . . . . . . . . . . . . . . . . . . . . . . . . . . . . . . . . . . . . . . . . 1 UPSET-RECOVERY LITERATURE . . . . . . . . . . . . . . . . . . . . . . . . . . . . . . . . . . . . . . . . . . . . . . . 2 THE EXPERIMENT . . . . . . . . . . . . . . . . . . . . . . . . . . . . . . . . . . . . . . . . . . . . . . . . . . . . . . . . . . . 4 Purpose . . . . . . . . . . . . . . . . . . . . . . . . . . . . . . . . . . . . . . . . . . . . . . . . . . . . . . . . . . . . . . . . . . . 4 Participants . . . . . . . . . . . . . . . . . . . . . . . . . . . . . . . . . . . . . . . . . . . . . . . . . . . . . . . . . . . . . . . . 4 Training . . . . . . . . . . . . . . . . . . . . . . . . . . . . . . . . . . . . . . . . . . . . . . . . . . . . . . . . . . . . . . . . . . 4 Testing . . . . . . . . . . . . . . . . . . . . . . . . . . . . . . . . . . . . . . . . . . . . . . . . . . . . . . . . . . . . . . . . . . . 5 Experiment Design . . . . . . . . . . . . . . . . . . . . . . . . . . . . . . . . . . . . . . . . . . . . . . . . . . . . . . . . . . 5 DATA COLLECTION DIFFICULTIES IN PHASE-ONE FLIGHT TESTING. . . . . . . . . . . . . . 6 RESULTS . . . . . . . . . . . . . . . . . . . . . . . . . . . . . . . . . . . . . . . . . . . . . . . . . . . . . . . . . . . . . . . . . . . . 8 Nose-High Upright Upset Results . . . . . . . . . . . . . . . . . . . . . . . . . . . . . . . . . . . . . . . . . . . . . . . 8 Nose-Low Upright Upset Results . . . . . . . . . . . . . . . . . . . . . . . . . . . . . . . . . . . . . . . . . . . . . . 10 Nose-High Inverted Upset Results . . . . . . . . . . . . . . . . . . . . . . . . . . . . . . . . . . . . . . . . . . . . . 10 Successful vs. Unsuccessful Recoveries . . . . . . . . . . . . . . . . . . . . . . . . . . . . . . . . . . . . . . . . . . . 11 IMPLICATIONS OF STATISTICAL RESULTS . . . . . . . . . . . . . . . . . . . . . . . . . . . . . . . . . . . . . 11 Control of G Forces . . . . . . . . . . . . . . . . . . . . . . . . . . . . . . . . . . . . . . . . . . . . . . . . . . . . . . . . 13 Roll Control Yoke Input . . . . . . . . . . . . . . . . . . . . . . . . . . . . . . . . . . . . . . . . . . . . . . . . . . . . . 13 Rapid Throttle Responses . . . . . . . . . . . . . . . . . . . . . . . . . . . . . . . . . . . . . . . . . . . . . . . . . . . . 13 Altitude Loss . . . . . . . . . . . . . . . . . . . . . . . . . . . . . . . . . . . . . . . . . . . . . . . . . . . . . . . . . . . . . . 14 General Aviation Syndrome . . . . . . . . . . . . . . . . . . . . . . . . . . . . . . . . . . . . . . . . . . . . . . . . . . 14 PHASE-TWO TRAINING AND TESTING . . . . . . . . . . . . . . . . . . . . . . . . . . . . . . . . . . . . . . . . 15 FOLLOW-ON RESEARCH . . . . . . . . . . . . . . . . . . . . . . . . . . . . . . . . . . . . . . . . . . . . . . . . . . . . . 15 CONCLUDING REMARKS . . . . . . . . . . . . . . . . . . . . . . . . . . . . . . . . . . . . . . . . . . . . . . . . . . . . 15 REFERENCES . . . . . . . . . . . . . . . . . . . . . . . . . . . . . . . . . . . . . . . . . . . . . . . . . . . . . . . . . . . . . . . 16
iii
PRELIMINARY RESULTS OF AN EXPERIMENT TO EVALUATE TRANSFER OF LOW-COST, SIMULATOR-BASED AIRPLANE UPSET-RECOVERY TRAINING INTRODUCTION
ties (29.4%). In Australia during the years 1991-2000, uncontrolled flight into terrain (UFIT)—defined as LOC in-flight followed by ground impact—accounted for 46% of all GA accidents and 56% of all general aviation fatalities.2 Since LOC is a major factor in commercial jet and general aviation fatal accidents worldwide, and since the vast majority of commercial and general aviation pilots have no aerobatic experience in any type of airplane, a cost-effective approach to teaching pilots how to recover from an upset is clearly desirable. In-flight upset-recovery instruction is both expensive and potentially hazardous. Moreover, FAA regulations prohibit air transport and most general aviation airplanes from intentionally assuming aerobatic attitudes. As a consequence, pilots are typically given upset-recovery training in ground-based flight simulation devices. Yet it remains unproven that skills developed in such training devices improve a pilot’s ability to regain control of an actual airplane during an in-flight upset. Moreover, because of flight simulator limitations such as unrealistic control input responses or lack of control force feedback, the potential for negative training exists. Even Level D flight simulators, for example, are known to present pilots with unreliable models of actual airplane performance when flown near the limits of, or outside of, the normal air transport operating envelope.3 Finally, almost all ground-based flight simulation devices—including all Level D flight simulators—lack the ability to replicate the high G forces pilots likely will encounter in upset-recovery maneuvering. In short, the degree to which simulator-based upset training is effective, if at all, is not known. Under the circumstances, a study of upset-recovery training transfer from a simulator to an actual airplane seems justified. Accordingly, the Civil Aerospace Medical Institute of the U.S. Federal Aviation Administration provided a research grant to fund such a study.
We will describe ongoing FAA-funded research to study training transfer in low-cost, simulator-based upset-recovery training. While many air transport training programs contain a module instructing pilots how to recover an airplane from an upset, there appears to be little research establishing the effectiveness of such training. Our study evaluates the transfer of upset-recovery training conducted using classroom instruction and low-cost flight simulation. To assess the validity of the training, we conducted flight tests to compare the performance of trained and untrained pilots in recovering an airplane from serious in-flight upsets. Our research is divided into two phases, the first of which is now complete. In what follows, we: • Offer motivation for our work. • Summarize prior research. • Describe the research experiment. • Explain data collection difficulties encountered in Phase-One flight testing. • Report the results of Phase-One flight testing. • Discuss the implications of these results. • Explain plans for Phase-Two training and testing. • Describe future (follow-on) research. • Provide concluding remarks.
MOTIVATION An upset occurs when an airplane enters an unexpected attitude that threatens loss-of-control in-flight (LOC) and subsequent ground impact. It is well known that LOC causes many fatal air transport accidents. For the years 1991-2000 inclusive, 33 of 112 total accidents worldwide—almost 30%—were attributable to LOC in-flight. Of the 7071 total onboard fatalities resulting from these 112 accidents, 2359—one-third—resulted from LOC in-flight accidents.1 The percentages of general aviation fatalities due to LOC are strikingly similar to those for commercial jets. Between 1990 and 2002, LOC accounted for 1485 of 4982 general aviation (GA) fatal accidents in the United States (29.8%) and 2617 of 8895 fatali-
2
R.O. Rogers, C. Howell, A. Boquet, and C. DeJohn (2006). “The Effect of Simulator-Based Upset Recovery Training on a Pilot’s Ability to Recovery an Airplane From an In-Flight Upset,” Proceedings of the 2006 Air Transport Research Society World Conference, Nagoya, Japan, (May 2006): Rogers-NR17, pp. 2-4. 3 R.O. Rogers (2005). “The Crash of American Airlines Flight 587: Its Effect on Air Transport Upset Recovery Training,” Proceedings of the 2005 Air Transport Research Society World Conference, Rio de Janeiro, Brazil, (July 2005): Rogers-NR24, pp. 7-12. The article references a number of authorities on this subject.
1
Boeing Airplane Upset Recovery Training Aid, available on CD from the Boeing Airplane Company, www.boeing.com. Congruent but slightly more current information is available from Boeing’s 2004 Statistical Summary. We present the earlier statistics to provide yearspan coherence with data for GA LOC accidents.
1
successful upset recovery, especially when a pilot has low domain knowledge, i.e., when he or she is not trained to proficiency in upset recovery.6 Kochan and Priest (2005) study the effect of Calspan’s In-Flight Upset-recovery Training Program on U.S. air carrier pilots. Their repeated measure experimental design involved pre-training and post-training pilot testing in the Learjet using a single performance measure: pilot selfevaluation employing a modified Cooper-Harper rating scale. The authors acknowledge that the validity of this performance measure is not known. Moreover, the study does not account for the possibility that initial flight testing resulted in pilot learning and improved performance in the second flight testing period. With these caveats, and assuming validity of the rating instrument, statistical analysis implied “a strong positive influence of the [program] on a pilot’s ability to respond to an in-flight upset.”7 However, the effects of such training may be ephemeral. Kochan, Breiter, Hilscher, and Priest (2005) studied retention of knowledge in pilots subjected to Calspan training. They found that “although [participant] pilots rated their ability to recover from loss-of-control situations as being greatly improved by the training, the vast majority reported remembering only between 52% of the academics and 83% of the [upset-recovery] techniques….Eighty percent of the participants recalled less than half of the procedural steps for yaw upsets and 73% recalled less than half of the [steps for] roll events.”8 A number of related papers examine the “surprise” or “startle” factor of an upset. Surprise during flight can lead to action-inhibiting stress and anxiety and a resultant inability to respond appropriately to an emergency situation. Kochan, Breiter, and Jentsch (2004) group instances of various in-flight surprises—including but not limited to upsets—into five causal categories. All five categories reflect the fact that unobserved cues are a potential but unacknowledged source of information for apprehending and dealing with an unusual flight situation before it arrives as a surprise. The researchers state their intent in future research to develop “a conceptual framework
UPSET-RECOVERY LITERATURE Although the literature of flight simulation is voluminous and spans a period of 80 years or more, we have not found a plethora of research articles on transfer of simulator-based upset-recovery training. Several reports originate from the Calspan (formerly Veridian) In-Flight Upset-recovery Training Program at Roswell, N. M.4 This FAA-funded program provides upset training in an aerobatic Beech Bonanza and in Calspan’s variable stability Learjet 25, an airplane modified using computer automation to provide right-seat occupants with the control characteristics of an air transport type airplane, for example a B-737. The Learjet is also capable of simulating upset-inducing wake turbulence, effects of weather phenomena that can lead to LOC, and various aircraft malfunctions that in the past have caused air transport upsets resulting in hull losses. Gawron (2004) studies the relationship between pilot experience and upset-recovery proficiency. Using the Calspan Learjet, she subjected five groups of airline pilots with varying degrees of upset-recovery training and/or aerobatics experience to a series of eight in-flight upsets, hypothesizing that pilots with more training or experience would recover more expertly than those with less. However, Gawron found no statistically significant differences in the performances of the five groups. These negative results may in part be explained by small sample sizes and large variability in the total flight times of the pilot participants. A third likely explanation—not mentioned in Gawron’s report—is that six of the eight upsets involved simulated aircraft malfunctions—rudder hard over, frozen aileron, runaway nose-up trim, etc. Few of the participant pilots in Gawron’s experiment were able to recover from any of these very serious “sick airplane” upsets, regardless of the degree of their prior training.5 The first author of this paper, a former Naval aviator with 14 years’ experience flying carrier based jet airplanes, attended Calspan upset training in Roswell in 2003 and can personally vouch for the difficulty of recovering from such upsets. Kochan (2005) examines the roles of domain knowledge and judgment in upset-recovery proficiency. Domain knowledge is specific knowledge about upset-recovery procedures. Judgment is the ability to analyze and learn from an in-flight upset-recovery experience. Kochan subjected four groups of participant pilots to a series of three in-flight upsets in the Calspan Learjet. Statistical analyses revealed that judgment was a significant factor in
6
J.A. Kochan (2005). The Role of Domain Expertise and Judgment in Dealing with Unexpected Events, Ph.D. Dissertation, Department of Psychology, University of Central Florida, Orlando, Florida, Summer Term 2005. 7 J.A. Kochan and J.E. Priest (2005). “Program Update and Prospects for In-Flight Upset Recovery Training,” Proceedings of the 13th International Symposium on Aviation Psychology, Oklahoma City, Oklahoma: Wright State University. 8 J.A. Kochan, E. Breiter, M. Hilscher, and J.E. Priest (2005). “Pilots’ Perception and Retention of In-Flight Upset Recovery Training: Evidence for Review and Practice,” Proceedings of the Human Factors and Ergonomics Society 49th Annual Meeting, Orlando, Florida: September 26-30, 2005.
4
www.calspan.com. Valerie Gawron (2004). Aircraft Upset Training Evaluation Report (revision 20), National Aeronautics and Space Administration (NASA): NAS2-99070.
5
2
for the study of unexpected events in aviation.”9 The authors of the current paper are aware of a follow-on to this study by the same researchers,10 but have been unable to obtain a copy. Kochan, Priest, and Moskal (2005, 2005a) extend these ideas in two articles that address the human factors aspects of loss-of-control to the end of determining the role of surprise in upset recovery.11, 12 The authors develop “a model representing the cognitive process of surprise” which constitutes a basis for discussing “how an unexpected event can escalate to a loss-of-control situation.”13 They argue that in-flight training may be necessary to teach pilots to deal adequately with their perceptual biases in processing information during a surprise upset. The context of such an event and a pilot’s perception about the probability of its occurring are also important issues in upset recovery. The more recent of the two articles presents an informative summary of current trends in upset recovery and a brief history of the use of flight simulation in aviation training. Kochan categorizes factors where surprise contributed to an aviation-related event, incident, or accident. Statistical analysis reveals that surprise is not clustered in certain categories, suggesting “that potentially any [surprise] event or combination of events could produce a situation with an unwanted outcome.”14 Pilot response to unexpected events can be improved through cognitive flexibility training (to discourage formulaic and encourage flexible responses to surprise events), adaptive expertise training (to reinforce modified or new responses to surprise based on responses learned in previous expert training), and metacognitive training (to teach pilots how to evaluate their mental processes in responding to surprise).15 These ideas seem
conceptually sound, but one wonders how challenging it might prove to implement such training at air transport companies or to evoke line pilot support for it. Research involving participants in the Calspan InFlight Upset-Recovery Training Program evaluates transfer of in-flight simulator-based upset training. In-flight simulation allows pilots to experience upset maneuvering G forces that very few ground-based flight simulators can replicate. The Environmental Tectonics Corporation (ETC) of Southampton, Pennsylvania, manufactures and markets centrifuge-based flight simulators to military organizations worldwide. Such simulators are capable of generating continuous G forces and motion cueing information that even 6 degrees-of-freedom (6 DoF)16 level D flight simulators cannot produce, allowing them to bring to ground-based upset-recovery training an added degree of realism. Three proprietary technical reports—graciously furnished by Dick Leland (dlect@ aol.com), Director of the ETC AeroMedical Training Institute—detail the capabilities of the company’s current generation centrifugal simulators.17, 18, 19 A drawback of such simulators, however, is that “if a pilot moves his head while under G in a centrifuge, strong feelings of disorientation (the Coriolis illusion) result because of the small rotation radius needed to create the G forces artificially.”20 In a related article on motion-based flight simulation, Szczepanski and Leland (2000) assert that “simulator data analysis suggests that motion cueing is necessary when training ab initio pilots or pilots who have limited or no experience in [whatever] flying task...is being trained.”21 While this undocumented assertion seems creditable, the NTSB Investigation of the crash of American Airlines Flight 587 in New York on November 12, 2001 expressed an alternative view by finding that “the use of lower levels of automation, such as simulators without motion or simple computer screen displays, may be more appropriate [than Level D simulators] to provide the
9 J.A. Kochan, E.G. Breiter, and F. Jentsch (2004). “Surprise and Unexpectedness in Flying: Database Reviews and Analysis,” Proceedings of the Human Factors and Ergonomics Society 48th Annual Meeting, New Orleans, Louisiana: Human Factors and Ergonomic Society. 10 J.A. Kochan, E.G. Breiter, and F. Jentsch (2005). “Surprise and Unexpectedness in Flying: Database Factors and Features,” Proceedings of the 13th International Symposium on Aviation Psychology, Oklahoma City, Oklahoma: Wright State University. 11 J.A. Kochan, J.E Priest, and M. Moskal (2005a). “The Application of Human Factors Principles to Upset Recovery Training,” 50th Annual Corporate Aviation Safety Seminar,” Orlando, Florida: Flight Safety Foundation and National Business Association, 26-28 April, 2005. 12 J.A. Kochan, J.E Priest, and M. Moskal (2005). “Human Factors Aspect of Upset Recovery Training,” 17th Annual European Aviation Safety Seminar,” Warsaw, Poland: Flight Safety Foundation and European Regions Airline Association, 14-16 March, 2005. 13 Based on Kochan (2005). 14 This parallels a similar finding in Kochan, Breiter, and Jentsch (2004) with different event categories. 15 J.A. Kochan (2006). “Human Factors Aspects of Unexpected Events as Precursors to Unwanted Outcomes,” 18th Annual European Aviation Safety Seminar, Flight Safety Foundation and European Regions Airline Association: Athens, Greece, 13-15 March, 2006.
16
The 6 DoF characterizing level D flight simulators are termed pitch, roll, yaw, heave, sway, and surge. 17 Environmental Tectonics Corporation. “ATFS-400 Authentic Tactical Flight Simulator Model 400 Executive Summary.” 18 Dick Leland, C. Spenney, T. Chelette, and E. Lewis (2003). “Opportunities in Flight Simulation: Tactical Flight Simulation.” 19 Zulkeffeli Mat Jusoh and D. Leland (2006). “Tactical Flight Simulation in the Royal Malaysian Air Force: the ATFS-400 Authentic Tactical Flight Simulator.” 20 Ian W. Strachan (2001). “Motion Cueing in the Real World and in Simulators: Principles and Practice,” Janes Simulation and Training Systems 2000-2001, pp. 149-175. 21 Cezary Szczepanski and D. Leland (2000). “Move or Not to Move? A Continuous Question,” Southampton, Pennsylvania: Environmental Tectonics, 200l. ©2000 ETC, published by the American Institute of Aeronautics and Astronautics with permission (AIAA Paper 0161). Copy provided by the second author.
3
necessary [upset] awareness training with less danger of situation. Hereafter, we refer to these two groups of pilots introducing incorrect information.”22 as the experimental (i.e. trained) group and the control (i.e. untrained) group respectively. Roessingh (2005) reports on a study to measure training transfer from low-fidelity ground-based flight simulators Participants to control of an actual airplane during aerobatic flight.23 Research participants were divided into two experimental Participants (n = 60) were flight students recruited groups and a control group. All three groups received infrom Embry-Riddle Aeronautical University (ERAU) in flight aerobatic training during ten half-hours periods. In Daytona Beach, Florida, with 30 pilots assigned to the addition, prior to in-flight training the two experimental experimental group and 30 to the control group. Howgroups received ground-based instruction in aerobatic ever—as explained later—only 28 control group pilots maneuvering using desktop flight simulators. The simulawere actually flight tested; moreover, some of the 58 test tor syllabus was the same for both experimental groups, flights failed to produce reliable data. All participants but one experimental group’s simulator training was held a current instrument rating and had completed an enhanced with a more “realistic layout of stick, rudder academic course in Basic Aerodynamics. None had any pedals, and throttle” than the simulator training of the prior aerobatic experience or upset-recovery training other experimental group. During fight testing requirbeyond that mandated by the FAA for the Private Pilot ing performance of five sequential aerobatic maneuvers rating. The total flight hours for the 58 subjects who without interruption, Roessingh collected data on each were flight tested ranged from 90 to 700 hours (mean = participant’s performance using a flight data recorder. He 256.3 hours, SD = 108.5 hours). The control group had also obtained instructor pilot ratings for each participant in slightly more total time than the trained group (277.3 vs. 25 binary categories. The data revealed no significant dif235.9 hours), although this disparity was offset by greater ference in the aerobatic maneuvering of experimental and variability in the control group when compared to the control group pilots. Small group size (seven participants trained participants (124.1 vs. 88.5 hours). Participant in each of the two experimental groups and the control flight hour data is summarized in Table 1. group) may have contributed to a failure Table 1. Flight Hour Data for 58 Flight-Tested Participants to detect training transfer. Inconsistencies Group Group Size Mean Flight Hours Standard Deviation among the grading criteria of three differ28 277.3 124.1 Control ent instructor pilots may also have affected 30 235.9 88.5 Experimental statistical results. Trained pilot performance 58 256.3 108.5 Combined did exceed control group pilot performance in the total number of aerobatic maneuvers completed during each half-hour flight, although the Training importance of this result is clouded because weather and While it might seem preferable to conduct upsetother uncontrollable factors affected pilot performance recovery training using a sophisticated Level D flight potential on any given flight. simulator, prudence and cost considerations dictate otherwise. Level D training, very expensive in itself, would THE EXPERIMENT imply flight testing in an air transport airplane, a prohibitively costly undertaking. In addition, it is both illegal Purpose and unsafe to subject pilots to serious upsets— extreme This purpose of our investigation is to determine pitch and bank angles, or inverted flight attitudes, for experimentally whether or not upset-recovery training example—in a multi-engine jet transport. Accordingly, in a low-fidelity flight simulator increases the likelihood we chose to train using low-cost desktop simulation and of a pilot’s recovering from an upset. Our experiment is to test our research hypothesis in an aerobatic general designed to test the hypothesis that a group of trained aviation airplane. participants will outperform a group of untrained parWe trained the 30 experimental group pilots in an acaticipants in recovering an actual airplane from an upset demic course where they received ten hours of classroom and ten hours of simulator-based upset-recovery instruc22 tion.24 We conducted simulator training using Microsoft NTSB (2004). Aircraft Accident Report NTSB/AAR-04/04, p. 160. Retrieved April 20, 2005, from www.ntsb.gov/publictn/2004/ AAR0404.pdf. 23 Jan J. M. Roessingh (2005). “Transfer of Manual Flying Skills from PC-Based Simulation to Actual Flight—Comparison of In-Flight Data and Instructor Ratings,” The International Journal of Aviation Psychology, 15 (1), 67-90.
24
Training materials may be viewed online at faculty.erau.edu/rogersr/ as471. The site contains extensive information on upset-recovery training. The MS Word document at the Course Text (Spring / Fall 2006) link and the Bonanza training videos at the Aerobatic Videos link are of particular interest with respect to Phase-One research.
4
Flight Simulator 2002 (MFS) software25 running under the Windows 2000 operating system on Dell desktop computers with high end graphics cards. Four of the ten hours of simulator time were devoted to aerobatic maneuvers—loops, Immelmans, full and half Cuban 8s, aileron rolls, barrel rolls, and wingovers. The remaining six hours were devoted to upset-recovery maneuvering. Both aerobatic and upset-recovery maneuvering were practiced under simulated VMC and IMC conditions. (MFS software facilitates simulating IMC conditions by reducing cockpit visibility.) The 30 participants in the control group received no classroom or simulator training.
altitude, attitude, G force, manifold pressure, and yoke rotation. However, whereas the FDR furnished yoke rotation in degrees and rudder pedal displacement in inches, the VR furnished no rudder pedal information and only non-quantitative information about yoke rotation. During testing, each participant was subjected to four randomly ordered upsets, described in detail later. For each upset, a participant was told to close his or her eyes while the safety pilot induced the upset. Then—when instructed to do so—the now open-eyed participant assumed control of the airplane and attempted to recover it to straight and level flight. A participant remained in control until recovery was completed or the safety of the aircraft came into question, for example when it appeared that the Bonanza’s never-exceed speed would be surpassed unless the safety pilot intervened. If a participant pilot returned the aircraft to straight and level flight without verbal or physical assistance from the safety pilot, the recovery was deemed successful; otherwise, it was deemed unsuccessful.
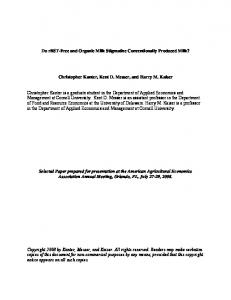
Testing For flight testing, we used an aerobatic E33C Beech Bonanza provided and operated by the Calspan Corporation Flight Research Group. The aircraft was fitted with both a flight data recording (FDR) system and a video recording (VR) system. The FDR was a Calspan proprietary Miniaturized Flight Data Recording System able to record 27 in-flight parameters on a digital memory card. The VR consisted of a commercial off-the-shelf portable digital video recorder (Micro DVR P/N PV-390-2) connected to an over-the-shoulder mounted Advanced Technology video camera (Model KPC-650CH ) equipped with a Varifocal lens (Model KLC-2812DC). As illustrated in Figure 1, the VR focused on the participant’s instrument panel and allowed us to view airspeed, vertical speed,
Experiment Design We define a good upset recovery as one where a pilot respects the aircraft operating limitations while returning the aircraft to straight and level flight with a minimum loss of altitude. We anticipated that minimum altitude loss would result from: 1. Prompt and correct throttle and control inputs in response to an upset situation.
Figure 1. Screen Capture of Video Recorder Output During an Actual Flight Test Upset 25
The United States Navy uses Microsoft Flight Simulator in both basic and advanced flight training of student Naval aviators.
5
2. Appropriate unloading and high roll rate to an upright attitude to orient the lift vector toward the sky. 3. Appropriate use of available/allowable G to achieve level flight after the airplane is upright.
One difficulty involved establishing the prescribed initial upset-recovery attitudes reflected in Table 3. Positioning the aircraft precisely proved to be more challenging than we had anticipated. Variations as small as 15 KIAS or 15o of pitch in a nose-high upset—for example—can dramatically affect the altitude loss encountered in recovery from the upset. Since we see minimum altitude loss as a primary indication of good upset recovery, we had anticipated tolerances of ±10o of pitch, ±15o of roll, and ±10 KIAS. We discarded data for any upset that, as reflected in VR information, deviated significantly beyond these limits. A second difficulty stemmed from flights where FDR and/or VR data were not recorded. A heavy safety pilot work load, together with difficult-to-reach FDR and VR control switches, resulted in failure to record some upset recoveries with one or both systems. Obviously, no data were obtained when both recordings were missing. Moreover, the VR did not record rudder input or quantitative yoke deflection, resulting in two missing dependent measures when FDR data not available. Finally, since the FDR did not record aircraft attitude, without VR data we could not verify that the Bonanza achieved a proper initial upset attitude. However, we ultimately decided to use FDR data in the absence of VR data, since doing otherwise would have dramatically reduced the amount of information available for analysis. A third and related difficulty resulted from the inability of the FDR to record altitude and airspeed accurately. A comparison of VR altitude values with corresponding FDR altitude values revealed that the two differed significantly, often by hundreds of feet. Upon further investigation, we found that the VR was recording airspeed and altitude calculated by the primary pitot-static system, while the FDR was obtaining airspeed and altitude from a secondary pitot-static system. We determined that FDR altitude readings were erroneous.26 However, we were able to establish a strong correlation between VR and FDR altitude losses for all four upsets, as reflected in Table 5. Encouraged by these relationships, we estimated missing VR altitude information from existing FDR altitude losses and used the resulting figures in our statistical analyses. While this compromise was not ideal, it did allow us to preserve enough data to produce meaningful statistical results. As a result of these three difficulties, we failed to obtain or discarded a significant amount of data. We also
To assess a participant’s performance in these areas, we used a 2 x 4 mixed-model design (n = 60) with group as a between factor and type of upset as the repeated measure, as reflected in Table 2. The design subjects every participant in two groups, each of size 30, to a series of four in-flight upsets. Table 3 displays attitude, airspeed, and throttle parameters for the four upset attitudes. Upright refers to a bank attitude not exceeding 90o. In an inverted upset, the bank angle is such that the cockpit is pointed toward the ground. Nose-high entry airspeeds are ten knots above the Bonanza 1G stall speed. Nose-low entry airspeeds reflect a safe maximum given the Bonanza’s linear acceleration characteristics, its never-exceed speed of 196 KIAS, and the presumption that a participant will initiate a prompt recovery from a high energy nose-low upset. The specified thrust settings ensure that a participant must make a throttle adjustment to achieve minimum altitude loss during recovery. Dependent measures are displayed in Table 4. Some of the data resulted from safety pilot (SP) observations, while others were derived from FDR or VR information. Column 2 in Table 4 indicates the source of a datum and how it is measured. Number in Column 3 refer to the three factors influencing a good upset recovery, as defined previously: 1) prompt and correct throttle and control inputs; 2) appropriate unloading and high roll rate; and 3) appropriate use of maximum available/allowable G. Interestingly, when we examined the data we collected, we found a very poor correlation between safety pilot ratings and quantitative data derived from the FDR for roll control input and control of G forces during recovery. As a consequence, we decided not to use safety pilot data for these measures.
DATA COLLECTION DIFFICULTIES IN PHASE-ONE FLIGHT TESTING As previously explained, we started Phase-One flight testing with 30 experimental group and 30 control group participants available for testing. After completing 58 sorties, the Bonanza suffered a generator failure. With no replacement readily available, we decided to terminate flying with two control group pilots yet untested. Moreover, due to a variety of difficulties, we failed to obtain reliable data on some of the 30 experimental group and 28 control group pilots who actually flew during Phase-One.
26
The FDR uses a separate pitot tube and cabin pressure (rather than pressure at an external static port) to compute airspeed and altitude. Calspan engineers explained that this design enables the Bonanza to be FAA approved for utility category instrument flight. Since the VR was installed to facilitate Phase-One flight testing, the severity of this known FDR limitation had not previously been observed.
6
Table 2. 2 x 4 Factorial Design Upset Attitude (Repeated Measure)
Training
2 x 4 Factorial
Nose-High Nose-Low Nose-High Nose-Low Upright Upright Inverted Inverted
10 Hours Simulator + 10 Hours Classroom
30 pilots
30 pilots
30 pilots
30 pilots
None (Control Group)
30 pilots
30 pilots
30 pilots
30 pilots
Table 3. Upset Attitudes, Airspeeds, and Throttle Settings Number 1 2 3 4
Upset Name Nose-High Upright Nose-Low Upright Nose-High Inverted Nose-Low Inverted
Pitch Bank 60o Nose-High 15o Left Wing Down 30o Nose-Low 75o Left Wing Down 60o Nose-High 135o Right Wing Down 20o Nose-Low 135o Left Wing Down
Airspeed 70 KIAS 120 KIAS 70 KIAS 100 KIAS
Thrust Idle Cruise Idle Cruise
Table 4. Dependent Variables Dependent Measure Time to First Roll Response Initial Roll Direction Time to First Throttle Response Initial Throttle Response Use of Ailerons for Roll Authority Use of Rudder for Roll Authority Unloading during Rolls Use of Available/Allowable G in Pullout Time to Complete Recovery Altitude Loss† Success of Recovery
How Measured C (Input – Start) Time in Seconds (VR) 1 0 – Incorrect; 1 – Correct (SP, VR) 1 (Input – Start) Time in Seconds (VR) 1 0 – Incorrect; 1 – Correct (SP, VR) 1 1-5 Rating Scale (SP); yoke position (FDR) 2 Rudder Pedal Displacement in Inches (FDR) 2 1-5 Rating Scale (SP); Measured G force (FDR) 2 1-5 Rating Scale (SP); Measured G force (FDR) 3 (Recovery– Start) Time in Seconds (VR) 1,2,3 (Final – Initial Altitude) in Feet (FDR, VR) 1,2,3 0 – Unsuccessful; 1 – Successful (SP, VR) 1,2,3
†
As discussed later, some nose-high upset recoveries actually resulted in small altitude gains, i.e., in a negative altitude loss.
Table 5. Correlation Values Between Observed VR and FDR Altitude Losses (p = .001) Upset Nose-High Upright Nose-Low Upright Nose-High Inverted Nose-Low Inverted r = .84 r = .91 r = .88 r = .90 Correlation
7
Since the Wilks’ Lambda values in Table 7 reflect a significant multivariate effect in all four upsets, we used T-Tests with the Bonferroni adjustment to assess the contribution of individual dependent measures in each upset. We report results of the univariate analyses below and display them graphically in Figures 2, 3, 4, and 5. Table 9 records the means and standard deviations (in italics) for each reliable dependent measure value contributing to the multivariate analyses. Bolding in Table 9 indicates a significant effect, as determined by univariate analysis.
omitted data for 14 unsuccessful upset recoveries, as discussed later. After supplying missing VR altitude loss data, calculated as explained above, we ended up with complete data for 69% of the upsets attempted (160 of 232). Table 6 displays the number of upsets resulting in reliable data for both control and trained groups for each of the upsets. Note that the table reflects the number of individual upsets with reliable data, not the number of participants with complete datasets for all four upsets.
RESULTS Nose-High Upright Upset Results The Wilks’ Lambda value was significant, with the model explaining 61% of the variance between the groups (F (9, 29) = 5.04, p = .000; η2 = .61). Univariate tests revealed that the experimental group outperformed the control group in three areas: • Average G during dive pullout (F (1, 37) = 37.98, p = .000) • Yoke rotation during rollout (F (1, 37) = 9.90, p = .003) • Seconds to first throttle response (F (1, 37) = 5.04, p =.031) Figure 2 displays these results graphically.
Initially we planned to analyze data using two-group repeated measures multivariate analyses of variance (MANOVA). However, because data collection difficulties produced incomplete datasets for many participants, we decided to analyze each upset separately to preserve a reasonable sample size. While this approach is unconventional in a within-subjects design, using a repeated measures MANOVA resulted in so much data loss that a meaningful analysis was impossible. For each upset individually, we determined the corresponding Wilks’ Lambda. Table 7 reports the result of the Wilks’ Lambda analysis for each upset. Table 8 presents the nine dependent measures used to produce the Wilks’ Lambda values in Table 7.
Table 6. Group Size for Each Upset After FDR to VR Altitude Loss Mappings Upset NoseGroup Nose-High Nose-Low Nose-Low High Upright Upright Inverted Inverted 16 17 19 19 Control 23 23 22 21 Experimental 39 40 41 40 Total Table 7. Wilks’ Lambda Values for Each Upset Nose-High Upright F (9, 29) =5.04 p = .000 Ș2 = .610
Nose-Low Upright F (9, 30) = 4.45 p = .001 Ș2 = .572
Nose-High Inverted F (9, 31) = 3.24 p = .007 Ș2 = .484
Nose-Low Inverted F(9,30) = 3.04 p = .010 Ș2 = .477
Table 8. Dependent Measures Used to Compute Wilks’ Lambda Values 1 2 3 4 5 6 7 8 9
Dependent Measure Used to Compute Wilks’ Lambda G Force in Pullout Ratio of Available to Allowable G in Pullout G Force Unloading during Rolls Recovery Altitude Loss in Feet Time to First Throttle Response in Seconds Time to First Roll Response in Seconds Time to Recover in Seconds Use of Ailerons for Roll Authority in Degrees of Yoke Rotation Use of Rudder for Roll Authority in Inches of Rudder Pedal Displacement 8
Table 9. Means and Standard Deviations for Reliable Dependent Measures (Bolding Indicates a Significant Effect.) Control Group
Experimental Group NoseNoseUpset Nose-High Nose-Low Nose-High Nose-Low Nose-Low Nose-Low High High Upright Upright Inverted Inverted Upright Inverted Upright Inverted 1.36 2.50 2.00 2.92 1.88 3.13 2.56 3.49 G Use in Dive Recovery 0.20 0.38 0.57 0.58 0.29 0.50 0.82 0.59 0.91 .93 .63 .64 .75 .79 .84 .87 Average G / 0.12 0.14 Target G 0.09 0.16 0.20 0.13 0.15 0.15 0.23 0.66 0.34 0.52 1.72 1.71 1.37 1.34 Unload G 0.20 0.81 0.26 0.59 0.34 0.63 0.28 0.52 -119.38’ 1001.76’ 538.95’ 1243.68’ 12.17’ 918.26’ 563.18’ 1290.95’ Altitude Loss 226.41’ 223.53’ 380.63’ 338.68’ 188.39’ 225.70’ 481.43’ 371.82’ 3.12 2.13 4.38 4.79 2.74 1.91 2.45 1.57 Seconds to 2.34 1.10 First Throttle 5.25 4.34 1.52 0.51 1.77 .51 2.06 2.18 2.58 2.11 2.30 2.00 2.36 1.76 Seconds to 0.99 1.01 1.68 1.56 1.11 0.85 0.85 0.94 First Roll 12.31 8.32 11.08 7.43 8.18 12.00 5.96 9.14 Seconds to 1.77 1.45 2.86 1.69 Recover 2.21 3.27 1.07 2.34 40.00o 40.64o 23.16o 25.67o 17.18o 63.30o 24.22o 46.38o Roll Input 18.46o 9.60o 20.44o 13.54 o 13.77o 4.79o 18.16o 13.73o .75” .20” 0.79” 0.23” 0.91” 0.18” 1.05” 0.33” Rudder Input 0.58” 0.15” 0.76” 0.20” 0.28” 0.12” 0.58” 0.24”
Average G During Pullout F (1, 37) = 37.98, p = .000
Yoke Input in Degrees During Roll to Wings Level F (1, 37) = 9.90, p = .003
Seconds to First Correct Throttle Response F (1,37) = 5.04, p = .031
Figure 2. Graphical Display of Significant Differences for Nose-High Upright Upset
9
Nose-High Inverted Upset Results The Wilks’ Lambda value was significant, with the model explaining 48% of the variance between the groups (F (9, 31) = 3.24; p < .007; η2 = .484). Univariate tests revealed that the experimental group outperformed the control group in four areas: • Average G during dive pullout F (1, 39) = 6.29, p = .016) • Ratio of average G to target G (F (1, 39) = 18.06, p = .000) • Seconds to first throttle (F (1, 39) = 5.36, p = .026) • Seconds to recover (F (1, 39) = 10.64, p = .002) Figure 4 displays these results graphically.
Nose-Low Upright Upset Results The Wilks’ Lambda value was significant, with the model explaining 57% of the variance between the groups (F (9, 30) = 4.45, p < .001; η2 = .572). Univariate tests revealed that the experimental group outperformed the control group in five areas: • Average G during dive pullout (F (1, 38) = 18.66, p = .000) • Ratio of average G to target G (F (1,38) = 19.93, p = .000) • Unloading during roll (F (1, 38) = 12.79, p = .001) • Yoke rotation during rollout (F (1, 38) = 4.08, p = .050) • Seconds to recover (F (1, 38) = 17.70, p = .000) Figure 3 displays these results graphically. Average G During Pullout F(1, 38) = 18.66, p = .000
Ratio of Average G to Target G During Pullout F (1, 38) = 19.93, p = .000
Unload G During Roll to Wings Level F(1, 38) = 12.79 p = .001
Yoke Input in Degrees During Roll to Wings Level F(1, 38) = 4.08, p = .050
Seconds to Recover F(1, 38) = 17.70, p = .000
Figure 3. Graphical Display of Significant Differences for Nose-Low Upright Upset 10
Nose-Low Inverted Upset Results The Wilks’ Lambda value was significant, with the model explaining 48% of the variance between the groups (F (9, 30) = 3.04, p < .010; η2 = .477). Univariate tests revealed that the experimental group outperformed the control group in four areas: • Average G during dive pullout (F (1, 38) = 9.08, p = .005) • Ratio of average G to target G (F (1, 38) = 4.71, p = .036) • Unloading during roll (F (1, 38) = 4.10, p = .050) • Seconds to first throttle (F (1, 38) = 10.99, p = .002) Figure 5 displays these results graphically.
5.00% (6 of 120), while the control group failure rate was 7.14% (8 of 112). As explained previously, we omitted from statistical analysis the data for all 14 unsuccessful upset recoveries.
IMPLICATIONS OF STATISTICAL RESULTS Eta squared values in all four multivariate analyses suggest a strong relationship between training in lowcost flight simulators and subsequent control responses in a real airplane experiencing a serious upset situation. As seen previously, Table 9 contains 72 datum values reflecting experimental group performance and control group performance for each of the nine dependent measures. These results should be viewed as 36 paired mean data values, nine data pairs for each of the four upsets. Table 11 summarizes paired data values from Table 9 for dependent measures where experimental group pilots outperformed control group pilots (those Table 9 values shown in bolding). The table reveals that experimental group performance exceeded control group performance 44.4% of the time, i.e., for 16 dependent measure paired data values of a total of 36. This superiority appeared in all four upsets and in six of the nine dependent measures. By contrast, in three dependent measures—altitude loss, seconds to first roll, and rudder input—there was never a significant difference between experimental and control group performance.
Successful vs. Unsuccessful Recoveries The number and percentages of unsuccessful recoveries by group are reported in Table 10. Most unsuccessful recoveries resulted when safety pilot intervention was required to prevent violating the Bonanza’s never-exceed speed of 196 KIAS. With respect to overall success in recovering the aircraft, no real differences between the two groups emerged. While some differences are apparent, especially in the nose-low inverted upset, the cell sizes were too unbalanced to compute reliable Chi-Square statistics on these data. In total, 14 out of all 232 upset recoveries (6.03%) were unsuccessful. The experimental group experienced an overall recovery failure rate of Average G During Pullout F (1, 39) = 6.29, p = .016
Ratio of Average G to Target G During Pullout F (1, 39) = 18.06, p = .000
Seconds to First Correct Throttle Response F (1, 39) = 5.36, p = .026
Seconds to Recover F (1, 39) = 10.64, p = .002
Figure 4. Graphical Display of Significant Differences for Nose-High Inverted Upset 11
Average G During Pullout F (1, 38) = 9.08, p = .005
Ratio of Average G to Target G During Pullout F (1, 38) = 4.71, p = .036
Unload G During Roll to Wings Level F (1, 38) = 4.10, p = .050
Seconds to First Correct Throttle Response F (1, 38) = 10.99, p = .002
Figure 5. Graphical Display of Significant Differences for Nose-Low Inverted Upset
Table 10. Percentages of Unsuccessful Recoveries by Group for Each of Four Upsets Group
Size
Control Experimental Totals
28 30 58
Upset Nose-High Upright Nose-Low Upright Nose-High Inverted Nose-Low Inverted 2 (7.14%) 0 (0.00%) 1 (3.57%) 5 (17.86%) 1 (3.33%) 2 (6.66%) 2 (6.66%) 1 (3.33%) 3 (5.17%) 2 (3.44%) 3 (5.17%) 6 (10.3%)
Table 11. Experimental vs. Control Group Performance Mean Values and Standard Deviations for Statistically Significant Performance Differences Upset Nose-High Upright Nose-Low Upright Nose-High Inverted Response Category F (9, 29) = 5.04 F (9, 30) = 4.45 F (9,31) = 3.24 p = .000, Ș2 = .610 p = .001, Ș2 = .572 p = .007, Ș2 = .484 1.88 G vs. 1.36G 3.13 G vs. 2.50 G 2.56 G vs. 2.00 G Use of High G in Dive 0.29G vs. 0.20 G 0.50 G vs. 0.38 G 0.82 G vs. 0.57 G 0.79 vs. 0.63 0.84 vs. 0.64 Use of Available G (Ratio) 0.13 vs. 0.09 0.15 vs. 0.16 1.37 G vs. 1.72 G Unloading During Rollout 0.28 G vs. 0.34 G 24.22o vs. 17.18o 63.30o vs. 46.38o Large Yoke Roll Input o o 18.16 vs. 13.77 13.73o vs. 4.79o 1.91 sec vs. 4.38 sec 2.45 sec vs. 4.79 sec Rapid Throttle Input 0.51 sec vs. 5.25 sec 1.77 sec vs. 4.34 sec 5.96 sec vs. 8.18 sec 9.14 sec vs. 12.00 sec Rapid Recovery 1.07 sec vs. 2.21 sec 2.34 sec vs. 3.27 sec 12
Nose-Low Inverted F (9, 30) = 3.04 p = .010, Ș2 = .477 3.49 G vs. 2.92 G 0.59 G vs. 0.58 G 0.87 vs. 0.75 0.15 vs. 0.20 1.34 G vs. 1.71 G 0.52 G vs. 0.63 G 1.57 sec vs. 2.74 sec 0.51 sec vs. 1.52 sec
and both nose-low recoveries likely increased the altitude loss they experienced in these three recoveries. 27
The dependent measure data pairs in Table 11 can be grouped into three pilot performance categories: 1) superior control of G forces; 2) increased willingness to use large roll control inputs, and 3) quicker throttle responses. In addition, the table reveals that experimental group pilots tended to return the aircraft to straight-andlevel flight faster than control group pilots.
Roll Control Yoke Input Experimental group pilots used significantly more roll input than control group pilots in both upright upsets. This reflects training that encouraged large, authoritative control roll inputs to roll the airplane to an upright wings-level attitude, especially during nose-high recoveries, where rapidly decreasing airspeed ensures slow roll response to aileron input. However, with more than 100o of yoke rotation available in the Bonanza, it is apparent that neither experimental nor control group pilots used available roll input during any upset recovery. We attribute this behavior to what we call General Aviation Syndrome, by which we mean a general aviation pilot’s long-reinforced habit of using small control inputs when maneuvering an airplane.28 It is one thing to practice large roll inputs in a non-threatening simulator environment but another thing entirely to apply this practice under the stress of a severe upset situation in an actual airplane. In short, although experimental group pilots outperformed control group pilots in appropriate use of roll input, their roll control input fell short of what is required for an optimal upset recovery. Note that General Aviation Syndrome behavior also reflects participant pilot reluctance—as discussed previously—to apply maximum allowable G forces during dive recovery.
Control of G Forces Superior control of G forces by experimental group pilots is an important indication of training transfer in our experiment. This superiority is reflected in the use of high G during dive pullout and in G unloading during roll to a wings-level attitude. In all four upsets, simulator training enabled experimental group pilots to apply significantly higher G forces during dive pullouts than control group pilots and to use a higher percentage of available G in all but the nose-high upright upset. However, few pilots in either group made full use of the allowable G force established for the experiment. In the interest of structural safety, we arbitrarily limited pilots to 4.0 Gs during flight testing, even though the Bonanza’s maximum allowable G is 6.0. Experimental group pilots were taught to use 4.0 Gs in dive pullout at 118 KIAS and above, airspeeds where 4.0 Gs are available in the Bonanza. We attribute their reluctance to apply this learning during flight testing to the fact that general aviation pilots without aerobatic experience have rarely if ever experienced much more than 2.0 Gs. The unfamiliar sensation of high G—which of course cannot be replicated by a desktop flight simulator—apparently was sufficient to inhibit the trained pilots from applying the full 4.0 G force they had practiced in a simulator by referencing the G meter. In addition, 4.0 Gs is very easy to obtain in MFS, where there is no realistic control force feedback to the yoke. By contrast, to achieve the same G force in the Bonanza during a dive, a pilot must pull back very hard on the yoke to overcome the large control forces generated by high dynamic pressures on the elevator. In both nose-low upsets, experimental pilot performance exceeded control group pilot performance in roll unloading. Experimental group pilots were taught to unload the airplane to low G while rolling to a wings-levels upright attitude—to zero G in nose-high recoveries, and to one-half G or less during nose-low recoveries. Both groups unloaded below 1 G during nose-high rolls. Pilots in both groups tended to make rolling pullouts from dives, although experimental group pilots were significantly less likely than control group pilots to apply a high G force during a rolling pullout. As explained below, the tendency of experimental group pilots to unload while rolling to a wings-level attitude during the nose-high inverted recovery
Rapid Throttle Responses Experimental group pilots were taught to add full throttle in nose-high upsets and to reduce the throttle to idle in high-energy nose-low situations. In flight testing, these pilots performed exactly as trained, and their performance in this respect significantly exceeded the performance of control group pilots in all but the noselow upright upset, where—although the difference was not statistically significant—trained pilots nevertheless reduced thrust a second faster than control group pilots (in 2.13 seconds, as opposed to 3.12 seconds). Differences in throttle response times were particularly significant in the two nose-high upsets (Table 11). Relatively low standard deviations for experimental group times to apply throttle 27 While it is possible to recover from the 60o nose-high inverted upset without incurring a steep dive angle, virtually all recoveries from this upset resulted in a significant nose-low attitude prior to recovery. 28 Perhaps the tendency to use small control inputs in upset recovery should be termed Straight-and-Level Syndrome, as it appears to characterize pilots at all levels who lack aerobatic experience. Two authors of this paper—Rogers and Howell—have attended upset training at four legacy airline companies. At each airline, we heard trainers remark that the difficulties they experience in persuading line pilots to use full yoke deflection when rolling a Level D simulator in an inverted upset to an upright, wings-level attitude.
13
reflect the fact that all trained pilots made a quick throttle adjustment in every upset. The large standard deviation values for control group pilots derive from the fact that a number of untrained pilots failed to adjust the throttle at all during some upset-recovery maneuvers.
to lower the nose. Even under full power, attempting to level the wings and fly over the top will lead to near zero airspeed and a sudden and severe nose-down pitch. Accordingly, we trained pilots to lower the nose smoothly in such a circumstance by initially increasing bank angle—the industry-wide standard procedure for severe nose-high upsets. After training was complete, we discovered that additional horsepower and a three blade propeller on the Calspan EA33C aerobatic Bonanza allow a pilot to recover from our nose-high upright upset by applying full throttle, unloading, and leveling the wings. The higher horsepower and more efficient prop provide the capability to power the airplane over the top with an altitude gain, especially if the entry airspeed exceeds the specified 70 KIAS, as was not infrequently the case. Untrained pilots who applied this “incorrect” general aviation recovery procedure for our nose-high upright upset sometimes achieved a smaller altitude loss than trained pilots who increased bank angle during the recovery. When we train in the future, we will teach both methods of nose-high recovery—explaining that the “incorrect” recovery method may succeed in a high thrust-to-weight ratio airplane and cautioning trainees that very few non-aerobatic general aviation airplanes develop thrust adequate to complete an over-the-top recovery from a serious nose-high upright upset. During Phase-One testing, video recording of upsets revealed that many trained pilots made throttle adjustments before initiating the appropriate rolling maneuver. To minimize altitude loss, these events should occur simultaneously, not sequentially. Even a one-second delay in initiating a roll is likely to increase altitude loss significantly, especially in nose-low upsets, where throttle reduction has far less effect on minimizing altitude loss than an immediate and rapid roll rate to a wings-level upright attitude.
Altitude Loss Experimental group exceeded control group pilot performance in management of G forces, applying throttle correctly, and using larger roll control inputs. Why are these superiorities not reflected in the altitude loss data, as we hypothesized they would be? For the nose-high inverted and the two nose-low upsets, the answer may be that control group pilots initiated rolling pullouts from dives, while experimental group pilots tended to follow their training by maintaining a lower G-force while rolling wings-level before initiating a hard pull-up from a nose-low attitude. Altitude is lost rapidly in a dive; for example, at 150 KTAS in a 45o dive, altitude loss exceeds 179 feet per second. Moreover, while the airplane remains unloaded, low induced drag causes airspeed to increase rapidly, increasing kinetic energy and ultimately increasing altitude loss. Of course, allowable G during rolling maneuvers is typically about 20% less than allowable G when no rolling moment is present, because rolling produces more lift and thus a higher G-force on the wing away from the roll than on the wing into the roll. However, since we limited participant pilots to 4.0 Gs in-flight testing, a 4.0 G rolling pullout in the 6.0 G Bonanza was safe. Under the circumstances of our experiment, then, rolling pullouts were not inappropriate, and assuming equal G-forces during dive recovery, a pilot who initiated a rolling pullout from a dive would lose less altitude than a pilot who rolled wings-level before pulling the nose-up hard. We will incorporate this observation into our training during Phase-Two of our research. For nose-high recoveries, experimental group pilots were taught the canonical recovery—apply full thrust, unload completely, roll to achieve a bank angle of 45o – 60o, allow the nose to fall, roll unloaded to wings-level as airspeed increases and the nose approaches the horizon, then break the descent only after airspeed is sufficient to allow positive Gs to be generated. This recovery contrasts with the nosehigh upset recovery taught candidates for the private pilot certificate, which is to increase throttle, roll the wings-level, and lower the nose toward the horizon at a reduced G force. Ironically, in the Calspan aerobatic Bonanza, the private pilot “incorrect” recovery worked better than the canonical recovery for the nose-high upright upset criteria specified in our experiment. During experiment design, we practiced upset recoveries in a standard E33A Beech Bonanza. At 70 KIAS, it is impossible to recover this airplane with minimum altitude loss from a 60o nose-high, 15o bank upset without increasing bank angle
General Aviation Syndrome During pilot debriefing in Phase-One Flight testing, we asked trained participants why they so often failed to apply the large control inputs they had practiced in the simulator. The typical reply indicated that the stress of the upset experience resulted in their being minimally aware of how much control input they were using. In other words, stress to some extent made them turn the blind eye to their training, with the result that they instinctively used the small control inputs practiced during several hundred hours of general aviation upright flight. As we have seen, there was some indication of training transfer in roll control input and control of G forces. However, the degree to which a modest amount of ground simulator training can help pilots overcome General Aviation Syndrome during an initial upset-recovery experience is an open question. Long reinforced behavior combined with significant stress is indeed a strong cognitive inhibitor. 14
PHASE-TWO TRAINING AND TESTING
FOLLOW-ON RESEARCH
During Phase-Two, we will repeat the Phase-One experiment with 25 new experimental pilots and 25 new control group pilots in the hopes of obtaining stronger results. A new control group is required because we plan to use a different flight-test aircraft. Prior to Phase-Two flight testing, we will work more closely with our aircraft provider to ensure that the flight data and video recorders are accurate and are operated properly, and that safety pilots standardize upset entry profiles to ensure closer adherence to specified airspeeds, attitudes, and throttle settings. In addition, Phase-Two experimental group pilots will benefit from an improved training program based on insights deriving from Phase-One testing outcomes. During Phase-One flight testing, we came to understand that minimum altitude loss upset-recovery techniques are somewhat more airplane-specific than we previously had acknowledged. We will incorporate lessons learned from the first flight testing period when we train experimental pilots during Phase-Two. Specifically, we will: • For nose-high upsets, continue to teach the canonical approach suitable for low thrust-to-weight general aviation airplanes. In addition, we will teach the “power over the top” recovery for nose-high upright recoveries that will succeed with high thrust-to-weight aerobatic airplanes. • For nose-low recoveries, continue to teach pilots to avoid rolling pullouts if the dive pullout G force will approach the symmetric wing-loading allowable G limit. However, we will also advise participants that when dive pullout will not exceed the rolling pullout G limit, less altitude loss will result by applying maximum available/allowable G as soon as the roll toward a wingslevel attitude points the lift vector toward the sky. • Be more emphatic in teaching pilots to unload completely during rolls in nose-high recoveries. • Be more emphatic in teaching pilots to use large yoke roll inputs when rolling at low airspeed during nosehigh upsets. • Be more emphatic in teaching pilots to use rudder as well as aileron to achieve rapid roll rates in nose-high recoveries. • Be more emphatic in teaching pilots to initiate throttle changes and yoke roll control inputs simultaneously rather than sequentially. • Reinforce more strongly the need during flight testing to resist control input behavior reflecting General Aviation Syndrome.
Regardless of the outcome of Phase-Two of our experiment to determine the value of upset training using low-cost desktop flight simulation, an interesting question will remain: would a better flight simulation device produce superior results? To address this question, the Environmental Tectonics Corporation (ETC) has obtained FAA funding to train 25 ERAU student pilots in an ETC centrifugal flight simulator, then flight-test them and compare their performance to our Phase-Two experimental and control group pilots. Flight testing of ETC trained pilots will be conducted by ERAU in Daytona Beach and will be identical to our currently planned Phase-Two flight testing. ERAU will give ETC participants the same ten hours of classroom training our experimental group pilots receive. In addition, they will receive five hours of aerobatic training on MFS. However, the ETC participants will not receive MFS upset-recovery training. Instead, after completing the 15-hour training syllabus at ERAU, they will travel to Pennsylvania, where they will receive five hours of upset-recovery training in the centrifugal flight simulator. ETC will modify the centrifuge to replicate the flight characteristics of a general aviation airplane. ETC’s research is designed to determine the added value of upset training in a motion based flight simulator capable of generating continuous G-forces. ETC hypothesizes that pilots trained in a centrifuge will outperform MFS trained pilots, as well as pilots trained in 6 DoF conventional air transport simulators. However, funding restraints dictate that only the former portion of this hypothesis will be tested in the follow-on research.
CONCLUDING REMARKS We are uncertain whether the data we will collect in Phase-Two flight testing will provide stronger support for our hypothesis that low-cost, simulator-based upset-recovery training improves a pilot’s ability to recover from an actual upset. It seems quite intuitive that such training will increase a pilot’s knowledge of upset-recovery maneuvering, and Phase-One testing did reveal a measure of training transfer. What is problematic is whether ground-based training also provides the ability to apply this knowledge confidently and completely during a pilot’s first serious in-flight upset experiences. Based on what trained participants said about their Phase-One testing experience, we will not be surprised if more complete Phase-Two data supports
15
only a modest rather than a large difference in performance between trained and untrained participants. It may well be the case that simulator-trained pilots need all attitude flight experience in a real airplane to hone their simulator-based upset-recovery skills to an acceptably high level. The results of our research should be of interest to air transport upset trainers, as well as to the general aviation community. Confirmation of our research hypothesis might provide a basis for training airline pilots in upset recovery using desktop simulation, while reserving very expensive Level-D simulators for training where cockpit verisimilitude is a requirement. On the other hand, if we find little significant difference between trained and control group pilots, one might logically ask if current airline simulator-based upset-recovery training programs impart flying skills sufficient to make it probable that typical line pilots can recover an airliner from a serious upset. The changing demographics of airline pilots imply an increasingly important need to provide them with adequate upset-recovery training. Thirty years ago, U.S. airline pilots typically came from military flight backgrounds that afforded them extensive opportunity to perform aerobatics and routinely to experience all attitude flight. By contrast, most air transport pilots flying today lack military backgrounds and have never experienced the extreme pitch and bank angles associated with severe airplane upsets. Indeed, most have never even been upside-down in an airplane. Informal conversations with current airline pilots suggest that while virtually all regard the upset training they receive as useful, a significant number also perceive it as a pro forma approach to a serious safety problem—better than nothing but far from what would be desirable if training costs were not a paramount consideration. Upsets are known to be a primary cause of fatal commercial air transport accidents. Passenger and air crew safety considerations mandate that air transport pilots be able to recover from the infrequent but potentially catastrophic upsets which inevitably will occur from time to time in routine operations. What kind of training they need to develop the necessary piloting skills is an open question. Perhaps current training programs are adequate. Perhaps training in centrifuge based simulators is a desirable improvement over current methods. Perhaps in-flight aerobatic and upset-recovery training at the commercial and/or ATP certification level is required for acceptably high upset-recovery proficiency. Currently, little is known about the efficacy of simulator-based upset-recovery training. We hope our study will advance knowledge in this somewhat neglected area of aviation safety research.
REFERENCES Environmental Tectonics Corporation. “ATFS-400 Authentic Tactical Flight Simulator Model 400 Executive Summary.” Proprietary technical report (undated). Gawron, Valerie (2004). “Aircraft Upset Training Evaluation Report (revision 20).” National Aeronautics and Space Administration NAS2-99070. (Airplane Upset Training Evaluation Report, February 25, 2002. NAS2-99070 is an earlier version of this research report.) Jusoh, Zulkeffeli Mat and D. Leland (2006). “Tactical Flight Simulation in the Royal Malaysian Air Force: The ATFS-400 Authentic Tactical Flight Simulator.” Proprietary technical report. Kochan, Janeen (2005). “The Role of Domain Expertise and Judgment in Dealing with Unexpected Events,” [Ph.D. Dissertation]. Orlando, Florida: University of Central Florida. Kochan, Janeen (2006). “Human Factors Aspects of Unexpected Events as Precursors to Unwanted Outcomes,” 18th Annual European Aviation Safety Seminar. Flight Safety Foundation and European Regions Airline Association, Athens, Greece: March 13-15, 2006. Kochan, Janeen, E.G. Breiter, and F. Jentsch (2004). “Surprise and Unexpectedness in Flying: Database Reviews and Analysis,” Proceedings of the Human Factors and Ergonomics Society 48th Annual Meeting. New Orleans, Louisiana: Human Factors and Ergonomic Society: September 20-24, 2004. Kochan, Janeen, E.G. Breiter, and F. Jentsch (2005). “Surprise and Unexpectedness in Flying: Database Factors and Features,” Proceedings of the 13th International Symposium on Aviation Psychology. Oklahoma City, Oklahoma: April 18-21, 2005. Kochan, Janeen, E. Breiter, M. Hilscher, and J.E. Priest (2005). “Pilots’ Perception and Retention of In-Flight Upset Recovery Training: Evidence for Review and Practice,” Proceedings of the Human Factors and Ergonomics Society 49th Annual Meeting. Orlando, Florida: September 26-30, 2005.
16
Rogers, Rodney O. (2006). Course Text for AS471, Spring/ Fall 2006. Available at the first author’s Web site: faculty.erau.edu/rogersr/as471/CourseText2006. doc.
Kochan, Janeen, J.E. Priest, and M. Moskal (2005). “Human Factors Aspect of Upset Recovery Training,” 17th Annual European Aviation Safety Seminar. Warsaw, Poland: Flight Safety Foundation and European Regions Airline Association: March 14-16, 2005.
Rogers, Rodney O. (2005). “The Crash of American Airlines Flight 587: Its Effect on Air Transport Upset Recovery Training,” Proceedings of the 2005 Air Transport Research Society World Conference. Rio de Janeiro, Brazil, Rogers-NR24: July 2005.
Kochan, Janeen, J.E Priest, and M. Moskal (2005a). “The Application of Human Factors Principles to Upset Recovery Training,” 50th Annual Corporate Aviation Safety Seminar. Orlando, Florida: Flight Safety Foundation and National Business Association, April 26-28, 2005.
Rogers, Rodney O., C. Howell, A. Boquet, and C. DeJohn (2006). “The Effect of Simulator-Based Upset Recovery Training on a Pilot’s Ability to Recovery an Airplane from an In-Flight Upset,” Proceedings of the 2006 Air Transport Research Society World Conference. Nagoya, Japan: May 2006.
Leland, Dick, C. Spenney, T. Chelette, and E. Lewis (2003). “Opportunities in Flight Simulation: Tactical Flight Simulation.” Proprietary technical report.
Strachan, Ian W. (2001). “Motion Cueing in the Real World and in Simulators: Principles and Practice,” Janes Simulation and Training Systems 2000-2001, pp. 149-175.
NTSB (2004). “Aircraft Accident Report NTSB/AAR04/04.” Available at the first author’s Web site: faculty.erau.edu/rogersr/as471/AA587/AAR0404. pdf. Retrieved April 20, 2005 from www.ntsb. gov/publictn/2004/AAR0404.pdf.
Szczepanski, Cezary and D. Leland (2000). “Move or Not to Move? A Continuous Question,” Southampton, Pennsylvania: Environmental Tectonics Corporation. ©2000 ETC, published by the American Institute of Aeronautics and Astronautics with permission (AIAA Paper 0161).
Roessingh, Jan J.M. (2005). “Transfer of Manual Flying Skills from PC-Based Simulation to Actual Flight—Comparison of In-Flight Data and Instructor Ratings.” The International Journal of Aviation Psychology 15 (1), 67-90.
17