Preparation and Quality Evaluation of Gluten-Free Biscuits Simona MAN, Adriana PĂUCEAN*, Sevastiţa MUSTE
Faculty of Food Science and Technology, University of Agricultural Sciences and Veterinary Medicine, 3-5 Mănăştur street, 3400, Cluj-Napoca, Romania e-mail:
[email protected] Bulletin UASVM Food Science and Technology 71(1) / 2014 ISSN-L 2344-2344; Print ISSN 2344-2344; Electronic ISSN 2344-5300
Abstract
The aglutenics biscuits are intended to those persons who are suffering due to gluten intolerance, also named celiac disease. The fabrication technologies of the aglutenics products can be developed in on two ways: by separating the gluten from the grain or by replacing the grain flour with other types of gluten less flour, in case of bakery and pastry products. In this experiment, the gluten-free biscuits were obtained from the following flours mixture: maize flour (MF), rice flour (RF) and soybeans flour (SF). Other raw materials were used, such as: palmtree oil, honey, maize starch, eggs, sugar powdered, vanilla essence and sodium bicarbonate. Four experimental variants (gluten-free biscuits) were obtained by varying the proportion of flours ; these variants were coded as follows T1, T2 T3 and T4. The optimization of the aglutenics biscuits manufacture recipe was realized through sensory analyze, using the hedonic test (9 point scale). Samples of biscuits was subjected to the following physico-chemical analysis: moisture content, alkalinity, total carbohydrate content, total fat and protein content. Also the physical properties (length, width, thickness, weight and spread ratio) were determined in order to asses the blending influence on the biscuits quality. The blend with flour levels 30:30:40 (MF:RF:SF) led to the highest acceptability. Keywords: gluten-free biscuits, manufacturing technology, sensory evaluation.
INTRODUCTION
Biscuits represent a fast growing segment of food because of consumer demands for con venient and nutritious food products. The consumers demand has increased for the quality food products with taste, safety, convenience and nutrition (Lubna Masoodi et al., 2012 ). Biscuits are a popular foodstuff consumed by a wide range of population due to their varied taste, long shelf life and relatively low cost. Because of competition in the market and increased demand for healthy, natural and functional products, attempts are being made to improve the nutritive value of biscuits and functionality by modifying their nutritive composition. Such effects are very often achieved by increasing the ratio raw materials other than wheat or different types of
dietary fibers in basic recipes with the attempt to increase biscuit’s protein and mineral content for quality and availability (Tyagi et al., 2006, Lubna Masoodi et al., 2012) or increase dietary fiber content and improve prebiotic characteristics of the final product (Gallagher et al.,2003, Lubna Masoodi et al., 2012 ). Celiac disease or gluten sensitive enteropathy is a chronic disorder of the small intestine caused by exposure to gluten in the genetically predisposed individuals (Laurin et al., 2002; Hamer, 2005, Ahmed M.S. Hussein et al.,2012). It is characterized by a strong immune response to certain amino acid sequences found in the prolamin fractions of wheat, barley and rye (Hill et al., 2005, Ahmed M.S. Hussein et al.,2012). When people with celiac disease eat foods or use products containing gluten,
39
Preparation and Quality Evaluation of Gluten-Free Biscuits
their immune system responds by damaging or destroying the intestinal villi leading to the malabsorption of nutrients, thus adversely affecting all systems of the body (Feighery, 1999, Ahmed M.S. Hussein et al.,2012). Intestinal symptoms can include diarrhea, abdominal cramping, pain and distention and untreated celiac disease may lead to vitamin and mineral deficiencies, osteoporosis and other extra intestinal problems. The gluten-free diet remains until now the only treatment for celiac disease. Gluten free diet has benefits such as the recovery of the villi of the small intestine and risk reduction of malignant complications (Seraphin & Mobarhan, 2002, Ahmed M.S. Hussein et al.,2012). As per rule the “Gluten free” is a voluntary term and defined as food containing less than 20 ppm of gluten. The gluten is a protein complex found in the triticeae tribe of wheat, barley (Hordeum vulgare) and rye (Secale cereale), which provides desirable organoleptic properties (texture and taste) to many bakery and other food products. Gluten is known as “heart and soul” of bakery for providing the processing qualities familiar to both the home baker as well as the commercial food manufacturer. Since gluten plays a limited role in defining the Table 1. Experimental Plan S. No
Parameter
1.
1
2.
Ingredients
10
4.
Analysis
3
5. 6.
MATERIALS AND METHODS
Procurement of raw materials In order to prepare the biscuits, the following materials has been purchased from local market: maize flour (MF), rice flour (RF), soybean flour (SF), palmtree oil, honey, maize starch, eggs, powdered sugar, vanilla essence, sodium bicarbonate. Experimental plan The experimental plan used for the present research is given in Table 1 and Figure 1 shows the flow chart for the biscuits preparation. Table 2 shows the different combination of maize flour, rice flour and soybean flour, while the ingredients used in the preparation of biscuits (in g) are presented in Table 3.
Level
Product
3.
processability and end product quality of biscuits, it can be complemented through some alternate flours in various combinations (Sweta Rai et al., 2011). The aim of the present work was to test rice flour (RF), maize flour (MF) and soybean flour (SF) for the development of gluten-free biscuits targeting a good sensory acceptance and good nutritional value.
Samples
4
Packaging material Storage condition
1 1
Description Biscuit
Maize flour, rice flour, soybeans flour, palm tree oil, honey, maize starch, eggs, sugar powdered, vanilla essence and sodium bicarbonate T1, T2 T3 and T4 Physico- chemical analysis (5), sensory analysis (5), physical analysis (4) HDPE Ambient temp
Table 2. Treatments descriptions. Different combination of maize flour, rice flour and soybeans flour for biscuits manufacturing Treatment
Maize flour (MF), %
Rice flour (RF), %
Soybean flour (SF), %
T1
33.33
33.33
33.33
T4
26
37
37
T2 T3
32 30
42 30
26 40
Bulletin UASVM Food Science and Technology 71(1) / 2014
40
4. 5. 6. 7. 8. 9. 10
Maize starch Eggs Honey Sugar powdered Palm tree oil Vanilla essence Sodium bicarbonate
5 40 27 17 20 9 8
5 40 27 17 20 9 8
5 40 27 17 20 9 8
5 40 27 17 20 9 8
Preparation of composite flour (maize flour, rice flour, soybean flour) (T1 – 33.33:33.33:33.33 ; T2 – 32 :42 :26 ; T3 – 30 :30 :40 ; T4 – 26 :37 :37)
MAN et al
Premixing cream (Palmtree oil, honey and sugar powdered) Mixing (flour, maize starch, sodium bicarbonate, cream, vanilla essence and eggs) Resting (at 3 – 4°C, 30 min) Molding Baking (at 200°C, 15 min) Cooling (30-35°C) Packaging (HDPE) Storage (at ambient temperature)
1 Flow chartfor gluten-free for gluten-free biscuits Fig.Fig. 1. Flow chart biscuitspreparation preparation
Physical evaluation of gluten-free biscuits Table 3. Ingredients used in the preparation of biscuits (in g)
S. No 1. 2. 3. 4. 5. 6. 7. 8. 9. 10
Width and length: Six biscuits were placed edge to edge and their total width was Ingredients T1 mm accuracy). The T2 average width was T3determined by measured with a vernier caliper (0.01 taking the Siddiqui et al., 2003). MFmean value (Nouma R. 33.33 32 Similarly the biscuits 30 length was determined by placing the butt of six biscuits and taking the mean value. RF 33.33 42 30 Thickness was measured by stacking six biscuits on top of each other and taking SF 33.33 26 40 average thickness (cm). Maize starch 5 5 5 Eggs 40 40 40 Honey 27 27 27 Sugar powdered 17 17 17 Palm tree oil 20 20 20 Vanilla essence 9 9 9 Sodium bicarbonate 8 8 8
Physical evaluation of gluten-free biscuits Width and length: Six biscuits were placed edge to edge and their total width was measured with a vernier caliper (0.01 mm accuracy). The average width was determined by taking the mean value (Nouma R. Siddiqui et al., 2003). Similarly the biscuits length was determined by placing the butt of six biscuits and taking the mean value. Thickness was measured by stacking six biscuits on top of each other and taking average thickness (cm). Weight of biscuits was measured as average of values of four individual biscuits with the help of digital weighing balance. Bulletin UASVM Food Science and Technology 71(1) / 2014
T4 26 37 37 5 40 27 17 20 9 8
Spread ratio was calculated by dividing the average value of width by average value of thick ness of biscuits by the method of Akubor P.I. et al., 2003, using the following formula: SF = W/T
W – width biscuits (cm) T – thickness biscuits (cm)
Volume of biscuits was calculated using length (L), width (W) and thickness (T) using the following formula:
with the help of digital weighing balance. Spread ratio was calculated by dividing the average value of width by average value of thickness of biscuits by the method of Akubor P.I. et al., 2003, using the following formula: Preparation and Quality Evaluation of Gluten-Free Biscuits
41
SF = W/T
volumeW (cm– 3width ) = L ×biscuits W × T (cm) T – thickness biscuits (cm)
RESULTS AND DISCUSSION
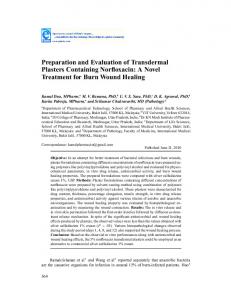
Physical analysis of gluten-free biscuits The results of the physical analysis for aglu L = average length of biscuits (cm) tenic biscuits produced from maize, (T) rice and Volume of of biscuits calculated using length (L), width (W) and thickness W = average width biscuitswas (cm) soybean flour blends is shown in Table 4. The using the following formula: T = average thickness of biscuits (cm) length, width, thickness, weight and spread ratio 3did not differ significantly (p>0.05).These results (cm ) = L × W × T Density: After calculating volume, volume density are supported also by the experimental baking was obtained from the ratio between weight and studies (data not shown) which indicated that volume (Sneha et al.of 2012). L = Srivastava average length biscuits (cm) different levels of SF, RF and MF did not adversely W = average width of biscuits (cm) affect the handling properties of the doughs. T = average thickness of biscuits (cm) The weight ranged between 8.4 g and 8.2 g for Weight (g ) g biscuits made from the MF, RF and SF in different density 3 = Density: calculating volume, density was thedecreases ratio between level. Theobtained width offrom biscuit from 1.95 to volume cm 3 cm After weight and volume (Sneha Srivastava et al. 2012). 1.85 cm with increasing in the level of rice flour. The result shows that treatment T2 has the maximum Chemical characteristics g Weight g ) followed by T4 (1.90) and T3 (1.88) width 1.95(cm, The moisture, alkalinity, fat and total carbohy density 3 =while minimum 3 cm volume cm width was observed in T1 (1.85). drates content were determined according to STAS The biscuits thickness increases from 0.68 to 1227-3/1990. Protein content was determined by using Kjeldhal Method and the conversion factor 0.72 cm with increasing level of soy flour in the blend Chemical characteristics 4). The results showwere that determined T3 has maximum 5.7. The moisture, alkalinity, fat and total(Tab. carbohydrates content thickness 0.72 cm followed by T4 (0.70.cm) and according to STAS 1227-3/1990. Protein content was determined by using Kjeldhal Method T1 (0.68 cm) while minimum width was observed Sensory evaluation and the conversion factor 5.7. Biscuits were evaluated for overall acceptability in T2 (0.65 cm). The spread factor of biscuits (texture, colour, taste, odor and aroma) and the decreases from 3.00 to 2,61 cm with increasing the Sensory evaluation sensory evaluation was carried out as per 9 point level of soy flour. We consider that the spread ratio Biscuits were evaluated for overall acceptability (texture, colour, taste, odor and Hedonic scale; the panell was formed by ten semi value is influenced by the competition of flours, aroma) and the sensory evaluation was carried out as per 9 point Hedonic scale; the panell trained judges. In Figure 2, the four samples of the especially SF and RF, for the available water. In this was formed by ten semi trained judges. In figure 2, the four samples of the gluten-free biscuits situation the dough viscosity is increased and the gluten-free biscuits are presented.
( )
( )
are presented.
T1
T2
T4
T3
2 Photos offrom biscuits made flours from obtained composite bySFmixing MF, proportions RF Fig. 2. Photos Fig. of biscuits made composite by flours mixingobtained MF, RF and in different and SF in different proportions
Table 4. Physical properties of biscuits Biscuits Samples T1 T2 T3 T4
Length (cm) 9.8 9.7 10.0 9.8
Width (cm) 1.85 1.95 1.88 1.90
*Data represents means of three determinations
Thickness (cm) 0.68 0.65 0.72 0.70
Spread ratio 2.72 3.00 2.61 2.71
Weight (g) 8.4 8.4 8.3 8.2
Bulletin UASVM Food Science and Technology 71(1) / 2014
1
T2 T3 T4
1
T2 T3 T4
9.7 9.7 10.0 10.0 9.8 9.8
1.95 1.95 1.88 1.88 1.90 1.90
0.65 0.65 0.72 0.72 0.70 0.70
3.00 3.00 2.61 2.61 2.71 2.71
*Data *Data represents represents means means of three ofdeterminations three determinations
42
8.4 8.3 8.2
8.4 8.3 8.2
MAN et al
The results The results of theofphysical the physical analysis analysis for aglutenic for aglutenic biscuits biscuits produced produced from from maize,maize, rice rice and soybean and soybean flour flour blendsblends is shown is shown in Table in Table 4. The4.length, The length, width,width, thickness, thickness, weight weight and spread and spread spread ratio isnot higher. SF significantly and RF had a higher water results alkalinity. The moisture content of sample ratio did rationot diddiffer differ significantly (p>0.05).These (p>0.05).These results are supported are supported also by also thebyexperimental thethe experimental absorption capacity than MF. biscuits ranged between 10.15% and 10.85%, baking baking studies studies (data (data not shown) not shown) whichwhich indicated indicated that different that different levelslevels of SF,ofRF SF,and RFMF anddid MF did Claughton and Pearce, 1989, reported a while the alkalinity, expressed as degree, ranged notreduction adversely not adversely affect affect the handling the handling properties properties of the of doughs. the doughs. in spread ratio of cookies by increasing between 11.6 and 12.2. The total carbohydrates The weight The weight ranged between between 8.4 g 8.4 andg8.2 andgcontent 8.2 for gbiscuits forranged biscuits made made from from the MF, the MF, and RFSF and the enrichment levelsranged of sunflower protein between13.6% toRF 14.5%. The SF in isolates, different in different level.level. The width The width of biscuit ofI.A., biscuit decreases from 1.95 to 1.95 1.85 to cm 1.85with cm increasing with increasing thein the Akubor P.I. and Onimawo 2012,decreases by from protein content ranged from 18.03% to in 21.00%, level level of rice of flour. rice flour. The result The result shows shows that treatment that treatment T2 has T2 the has maximum the maximum width width 1.95 1.95 cm, increasing the enrichment levels with soybean while the fat content varied from 13.56% tocm, flour and Mishra and T3 Ramesh 2012 minimum 20.35%; theseobserved values are the(1.85). acceptable followed followed byNeha T4by (1.90) T4 (1.90) and and (1.88) T3Chandra, (1.88) whilewhile minimum widthwidth was was observed in within T1in (1.85). T1 reported a reduction in spread ratio of biscuits by limits for biscuits given by the The biscuits The biscuits thickness thickness increases increases from from 0.68 0.68 to 0.72 to 0.72 cm with cm with increasing increasing level Romanian level of soyof soy increasing the enrichment levels with soy flour settlement STAS 1227-3/90. (Fig. 5 8). Significant flour flour in theinblend the blend (Table(Table 4). The 4). results The results show show that T3 thathas T3 maximum has maximum thickness thickness 0.72 0.72 cm cm changes in width the biscuits protein and fatin values andfollowed riceby bran. . (0.70.cm) followed T4by T4 (0.70.cm) and T1 and(0.68 T1 (0.68 cm) while cm) while minimum minimum width was observed was observed in T2 (0.65 T2 (0.65 Figure 3 - 4 show the effect of treatments on were recorded related to the increment of the soy cm). The cm). spread The spread factorfactor of biscuits of biscuits decreases decreases from from 3.00 to 3.00 2,61 to cm 2,61with cm increasing with increasing the level the level of of volume and density of gluten free biscuits. The flour content in the recipe. Soybean flour has a soyvolume flour. soy flour. We consider We consider that the thatspread the spread ratio ratio valuevalue is influenced is influenced by thebycompetition the competition of flours, of flours, of gluten free biscuits increased linearly moisture content close to the rice flour and corn especially especially SF and SF RF, and for RF, the for available the available water. water. In this In situation this situation the dough the dough viscosity viscosity is increased is increased with increasing addition of soy flour whereas, flour, but high fat and protein content. Therefore, anddensity the andspread the spread ratioinis ratio higher. is higher. SFmanner. and SFRF and had RF ahad higher higher waterwater absorption absorption capacity capacity thanbetween MF. than MF. aa significant difference was observed the decreased the similar This may Theinprotein and fat content biscuits Claughton Claughton and Pearce, and Pearce, 1989, reported reported a samples. reduction a reduction spread in spread ratio ratio of cookies ofofcookies by by be due to higher protein content in the 1989, soy flour. increased linearly with increase in soybean increasing increasing the enrichment the enrichment levelslevels of sunflower of sunflower protein protein isolates, isolates, Akubor Akubor P.I.the and P.I. Onimawo and Onimawo I.A., I.A., Chemical gluten-free biscuit flour addition. These are consistent with 2012,2012, by increasing by analysis increasing theof enrichment the enrichment levelslevels with soybean with soybean flour flour and Neha andresults Neha Mishra Mishra and Ramesh and Ramesh During present noinsignificant those reported Noah Mishra and Ramesh Chandra, Chandra, 2012the 2012 reported reported aresearch reduction a reduction spread in spread ratio ratio of biscuits of biscuits by by increasing by increasing the enrichment the enrichment difference was found in the moisture content and Chandra, 2012, and Akbar P.I. et al., 2003. levelslevels with with soy flour soy flour and rice andbran.. rice bran.. M e a n v a lu e s o f d e n s ity (g /c m 3 )
1 3 .6
M e a n v a lu e s o f d e n s ity (g /c m 3 )
M e a n v a lu e s o f v o lu m e (c m 3 )
30
VA L U E S (% )
25 20
to ta l c a rb o h y d ra te s
15
m o is tu re
10 5 0 T1
T2
T3
T4
T R E AT ME N T S
Effect ofonflours blending on carbohydrates moisture andcontent total of gluten-free Fig. 5 Effect of Fig. flours5.blending moisture and total biscuits carbohydrates content of gluten-free biscuits
14 / 2014 Bulletin UASVM Food Science and Technology 71(1) 13
U E S (d e g re e s )
M e a n v a lu e s o f v o lu m e (c m 3 )
Figure 3 and 4 shows the effect of treatments on volume and density of gluten free 0 .7 0 with .7 biscuits. The volume of gluten free biscuits increased linearly increasing addition of soy 1 3 .4 1 3 .4 flour whereas, density decreased in the similar manner. 0 .6 8 This 0 .6 8may be due to higher protein 1 3 .2 1 3 .2 content in the soy flour. 0 .6 6 0 .6 6 13 13 Chemical analysis of gluten-free biscuit 1 2 .8 1 2 .8 0 .6 4 0 .6 4 During the presentVoresearch difference was found in the moisture D e n s ity (g /cDme n3s) ity (g /c m 3 ) 1 2 .6 lu m e (c m Vo3 lu ) mno e (c msignificant 3) 1 2 .6 0 .6 2 0 .6 2 content and alkalinity. The moisture content of the sample biscuits ranged between 10.15% 1 2 .4 1 2 .4 and 10.85%, while the alkalinity, expressed as degree, 1 2 .2 1 2 .2 0 .6 ranged 0 .6 between 11.6 and 12.2. The 12 12 total carbohydrates content ranged between13.6% to 14.5%. The protein content ranged from 0 .5 8 0 .5 8 1 1 .8 1 1 .8 18.03% to 21.00%, while the fat content varied from 13.56% to 20.35%; these values are 1 1 .6 1 1 .6 0 .5 6 0 .5 6 settlement STAS 1227-3/90. within the acceptable limits for biscuits given by the Romanian T1 T 1T 2 T 2T 3 T 3T 4 T4 1 T 1T 2 3 T 3T 4 T4 (fig.5,6, 7, 8). Significant changes in the biscuits protein and Tfat values wereT 2Trecorded related T r e a tm e Tn ts r e a tm e n ts T r e a tm e T n ts r e a tm e n ts to the increment of the soy flour content in the recipe. Soybean flour has a moisture content close to the rice flour and corn flour, but high fat and protein content. Therefore, a significant was between the samples. The protein and fatofcontent of biscuits Fig. 3.difference Effect ofon treatments volume 4.treatments Effect treatments ongluten density Fig. 3 Fig. Effect 3 of Effect treatments of treatments on volume volume ofobserved gluten ofon gluten free biscuits freeobiscuits Fig. 4 Effect Fig.Fig. 4 of Effect of treatments on density on density of of gluten free biscuits free biscuits increased linearly with the increase in soybean flour addition. These results are consistent f gluten free biscuits of gluten free biscuits with those reported by Noah Mishra and Ramesh Chandra, 2012, and Akbar P.I. et al., 2003 1 3 .6
12 11 10 9
Alk a lin ity
VA L U E S (% )
25 20
to ta l c a rb o h y d ra te s
15
m o is tu re
43
Preparation and Quality Evaluation of Gluten-Free Biscuits 10 5
Sensory evaluation for gluten-free biscuit 0 The evaluation T1Sensory T2 T3 T4 was carried out as T R E AT ME N Tscale S per 9 point Hedonic Table 4. The sensory attributes that were taken into consideration
include: texture, colour, taste, odor and aroma. The values are the means of ten readings. Among the four samples, the third sample (30:30:40) recorded the highest acceptability.
Fig. 5 Effect of flours blending on moisture and total carbohydrates content of gluten-free biscuits 14
25
20
12
10
Alk a lin ity
25
9 8
VA L U E S (% )
11
15
F a t c o n te n t 10
20
5
7 6 T1
T2
T3
T R E AT ME N T S
VA L U E S (% )
VA L U E S (d e g re e s )
13
15
0
T4
T1
10
F a tT2c o n te n t
T3
T4
T R E AT ME N T S
5
6. Effect of on flours blending on Fig. 6 Effect ofFig. flours blending alkalinity of gluten-free biscuits alkalinity of gluten-free0 biscuits T1 T2 T3 T R E AT ME N T S
Fig.7 Effect of flours blending on fat content of gluten-free Fig. 7. Effect of flours blending on fat biscuits 22
content of gluten-free biscuits
T4
20 18
VA L U E S (% )
Fig.7 Effect of flours blending on fat content of gluten-free biscuits 22
VA L U E S (% )
20
16
P ro te in c o n te n t
14 12 10
18
8
16
T1
14 12 10
P ro te inT2c o n te n t T3 T R E AT ME N T S
T4
Fig. 8 Effect of flours blending on protein content of gluten-free biscuits
8 T1
T2
T3
T4
Sensory evaluation for gluten-free biscuit Sensory evaluation was carried out as per 9 point Hedonic scale table 4. The sensory attributes that were taken into consideration include: texture, colour, taste, odor and aroma. The values are the means of ten readings. Among the four samples, the third sample 8. Effect flours blending on protein content Fig. Fig. 8 Effect of floursof blending on protein content of gluten-free biscuits (30:30:40) recorded the highest acceptability. T R E AT ME N T SThe
of gluten-free biscuits
Sensory evaluation for gluten-free biscuit The Sensory evaluation was carried out as per 9 point Hedonic scale table 4. The Tab. 5 sensory attributes that were taken into consideration include: texture, colour, taste, odor and Sensory scores of prepared gluten-free biscuits using different blends (MF:RF:SF) aroma. The values are the means of ten readings. Among the four samples, the third sample (30:30:40) recorded the highest acceptability. Treatments Colour Texture Taste Odor Aroma
T1 using different 8.3 Table 5. Sensory scores of prepared gluten-free biscuits blends8.6 (MF:RF:SF)
Treatments
8.4 T2 8.3 8.7 8.0 Tab. T3 8.3 8.8 8.7 5 Sensory scores of prepared gluten-free biscuits using different blends (MF:RF:SF) 7,6 T 8.0 7.8 4 Colour Texture Taste Odor
T2
T3
Treatments T1 8.3 T2 T3 8.3 T4
T4
8.0
T1
Colour 8.3 8.3 8.3 8.0
8.3 *Data represents
Texture 8.6 8.6 8.7 8.7 8.8 7.8
*Data represents means of three determinations
means of8.8 three determinations
7.8
*Data represents means of three determinations
Taste 8.48.4 8.0 8.78.0 7,6
8.7 7,6
Odor 8.5 .8.1 8.7 7.6
8.5 .8.1 8.7 7.6 Aroma
8.5
Aroma 8.3 7.8 .8.1 8.5 7.4
8.3
8.7
8.5
7.6
7.4
7.8
Bulletin UASVM Food Science and Technology 71(1) / 2014
8.3 7.8 8.5 7.4
44
CONCLUSION
It is evident from the experiment that gluten-free biscuits can be made by mixing different non-wheat flours such as: rice flour, maize flour and soy flours. This type of biscuits are useful in the gluten-free diets therefore require good nutritional and sensory quality. The blend consisting of MF30: RF30: SF40% was successfully used for gluten-free biscuits preparation without adversely affecting the physical and the sensory characteristic of biscuit. Addition of soy flour up to 40% leads to biscuits with good nutritional and sensorial properties.
REFERENCES
1. Ahmed, M.S. et al. (2012). Production and Evaluation of Gluten-Free Cakes, Australian Journal of Basic and Applied Sciences, 6(12): 482-491. 2. Akubor, P.I. and Ukwuru, M.U. (2003). Functional properties and biscuit making potential ofsoybean and cassava flour blends, Plant Foods for Human Nutrition 58:1–12.
3. Baljeet, S.Y. et al. (2010). Studies on functional properties and incorporation of buckwheatflour for biscuit making, International Food Research Journal 17:1067- 1076. 4. Claughton, S.M. and Pearce, R.J. (1989). Protein enrichment of sugar-snop cookies with sunflower protein Isolate, J Food Sci 54:354–356. 5. Schamne, C. et al. (2010). Obtention and characterization of gluten-free baked products, Ciênc. Tecnol. Aliment., Campinas, 30(3): 741-750.
6. Awasthi, I. et al. (2012). Development of soy fertified high protein and high calorie supplementary biscuits, Indian J.Sci.Re4s.3 (1):51-58.
Bulletin UASVM Food Science and Technology 71(1) / 2014
MAN et al
7. Naseem, K. et al. (2013). Development, Characterization And Evaluation Of High Energy Biscuits For Combating Malnourishment Amongchildren In Pakistan, Pakistan J. Agric. Res. 26(3):230-236.
8. Masoodi, L. and Bashir, V. A. K. (2012). Fortification of Biscuit with Flaxseed: Biscuit Production and Quality Evaluation, Journal Of Environmental Science, Toxicology And Food Technology, 1: 6-9. 9. Neha, M. and Ramesh, C. (2012). Development of functional biscuit from soy flour &rice bran, International Journal of Agricultural and Food Science 2(1): 14-20.
10. Aziah, N. A.A. and Komathi, C.A. (2009). Acceptability attributes of crackers made from different types of composite flour, International Food Research Journal 16:479-482. 11. Nouma, R. S. et al. (2003). Sensory amd physical evaluation of biscuits suplplemented with soy flour, Pak J. Food, 13 (1-2): 45-48 .
12. Srivastava, S. et al. (2012). Preparation and Quality Evaluation of Flour and Biscuit from Sweet Potato, J Food Process Technol p. 1-5, http:// dx.doi.org/10.4172/21577110.1000192. 13. Kumar, S. R. and Lalan, K. S. (2010). Evaluation of quality characteristics of soy based millet biscuits, Advances in Applied Science Research, 1 (3):187-196.
14. Srivastava, S. et al. (2012). Preparation and Quality Evaluation of Flour and Biscuit from Sweet Potato, J Food Process Technol 3:192. doi:10.4172/21577110.1000192. 15. Rai, S. et al. (2011). Quality characteristics of gluten free cookies prepared from different flour combinations, J Food Sci Technol DOI 10.1007/s13197-011-0547-1. 16. Seevaratnam, V. et al. (2012). Studies on the Preparation of Biscuits Incorporated with Potato Flour, World Journal of Dairy & Food Sciences 7 (1):79.