Journal of Imaging Science and Technology® 52(4): 040901–040901-9, 2008. © Society for Imaging Science and Technology 2008
Preprocessing Methods for Improved Lossless Compression of Color Look-up Tables Aravindh Balaji Department of Electrical and Computer Engineering, University of Rochester, Rochester, New York 14627-0126
Gaurav Sharma쒀 Department of Electrical and Computer Engineering and the Department of Biostatistics and Computational Biology, University of Rochester, Rochester, New York 14627-0126 E-mail:
[email protected]
Mark Q. Shaw쒀 and Randall Guay쒀 Hewlett Packard Company, MS 227, 11311 Chinden Boulevard, Boise, Idaho 83714
Abstract. Color look-up tables (CLUTs) that provide transformations between various color spaces are commonly embedded in printer firmware where they are stored in relatively expensive flash memory. As the number of look-up tables in color devices increases in size, the space requirements of storing these CLUTs also increase. In order to conserve memory and thereby reduce cost, it is desirable to compress CLUTs prior to storage and restore tables as required. We consider methods for improving the performance of existing lossless compression methods for this application through computationally simple preprocessing. The preprocessing combines predictive coding and data reordering to better exploit the redundancy in CLUT data. Two predictive coding methods are considered: (a) hierarchical differential encoding methods, which generalizes differential coding to multiple dimensions, and (b) cellular interpolative predictive coding, which refines a CLUT in a coarse to fine order using interpolative prediction. Space filling curves that preserve continuity in the multidimensional CLUT structure are utilized for reordering the residuals obtained from hierarchical differential encoding. For the cellular interpolative prediction, we reorder the data in the coarse to fine order utilized for prediction. Results indicate that the proposed preprocessing methods offer significant performance improvements in comparison with direct compression. The best performance is obtained using the cellular interpolative predictive coding and corresponding reordering with the LZMA algorithm. This method provides a compression ratio of 3.19 over our representative CLUT data set, and an improvement of 31.33% over direct LZMA compression, the latter being the best performing direct method. © 2008 Society for Imaging Science and Technology. 关DOI: 10.2352/J.ImagingSci.Technol.共2008兲52:4共040901兲兴
INTRODUCTION Color look-up tables (CLUTs) that provide transformations between various color spaces are extensively used in color management, common examples being the transformations from device independent color spaces (such as CIELAB) to device dependent color spaces (e.g., CMYK) and vice versa. For color printers, these CLUTs are often embedded in the 쒀
IS&T Member.
Received Jan. 28, 2008; accepted for publication May 23, 2008; published online Jul. 22, 2008. 1062-3701/2008/52共4兲/040901/9/$20.00. J. Imaging Sci. Technol.
printer hardware, where they require relatively expensive flash memory for the purpose of storage. The firmware memory requirements for storing these CLUTs can become a concern, particularly as the number of the look-up tables in color devices increases due to the need for supporting multiple color spaces, print media, and preferences. The trend toward finer sampling of the spaces and larger bit depths also results in an increase in table sizes, further exacerbating these memory concerns. Compression of these CLUTs therefore becomes desirable for the purpose of conserving memory. Though firmware memory provided the initial motivation for our research, the same concerns of memory and storage space are applicable for CLUTs that are embedded in color documents, for example, as International Color Consortium (ICC) source profiles included in portable document format documents. The compression of these CLUTs therefore becomes desirable for the purpose of conserving memory and storage or for minimizing network traffic and delay. As an example consider that the majority of office documents today utilize “untagged RGB” content with the implied assumption that the RGB content should be interpreted as sRGB.1 This assumption was justified in the past by the fact that a majority of electronic displays were based on cathode ray tube (CRT) display technologies whose primaries were close to the sRGB primaries. The emergence of newer display technologies that are not based on CRTs has rendered these assumptions obsolete. A proposed solution is to include profiles that describe the color context, which, however, poses the challenge that the profile metadata increases the size of documents. In particular, for documents containing CMYK image data, the inclusion of a source profile along with an image can often exceed the size of the image itself. In such scenarios, the methods proposed here could be applied to the compression of the CLUTs in ICC profiles thereby reducing the storage overhead they impose when embedded in documents.
040901-1
Jul.-Aug. 2008
Balaji et al.: Preprocessing methods for improved lossless compression of color look-up tables
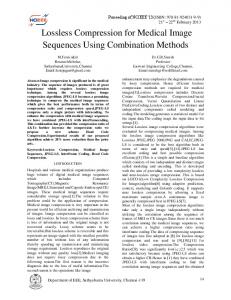
Figure 1. Block diagram of compression-reconstruction process.
In this article, we address methods for improving lossless compression performance on CLUT data. Toward this end, we develop predictive coding and data rearrangement preprocessing methods that improve compression performance when utilized with standard lossless compression algorithms. Specific contributions of this research are: (1) hierarchical differential encoding, a multidimensional extension of differential encoding with recursive and nonrecursive versions;2 (2) cellular interpolative predictor, a coarse to fine predictive modeling of CLUT data; (3) data reordering methods for improving compression performance. Space filling curves are utilized with hierarchical differential encoding and a coarse to fine ordering conforming to the prediction order is utilized with the cellular interpolative predictor. In the following section we provide a brief overview of the preprocessing framework which motivates the development of the methods for improving lossless CLUT compression. These methods are discussed in detail in the next two sections. The implementation parameters and the summarized results for the methods developed are then presented followed by concluding remarks. PREPROCESSING FRAMEWORK FOR IMPROVING LOSSLESS CLUT COMPRESSION Compressing data involves an encoding algorithm that takes a message and generates a “compressed” representation. Subsequent decompression requires a decoding algorithm that reconstructs the original message (or some approximation of it) from the compressed representation. Figure 1 shows the block diagram of a compression-decompression process. All compression algorithms assume that some inputs are more likely than the others. For example, in English text, following the letter q, the letter u is more likely than the letter z. Most compression algorithms are based on an assumption that the data exhibits structure of this form as opposed to being random. Although there are no references for CLUT compression in prior literature, compression methods have been extensively studied for a number of other applications.3 Compression methods can be categorized as lossless or lossy. The former class of methods is used extensively, where it is required that the recovered data from the compressed representation must match the original data exactly, i.e., the decompressed data must be mathematically equal to the original data. Lossy compression methods on the other hand are commonly used in applications where the requirement of mathematical equality between the compressed and decompressed forms of data can be relaxed and distortions that are perceptually negligible (or small) can be tolerated. Speech, J. Imaging Sci. Technol.
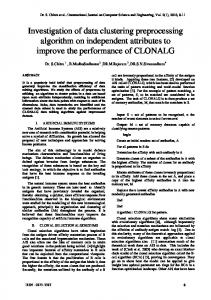
Figure 2. Overview of the system
audio, image, and video communication are common examples of such applications. In this article, we will focus our attention on the lossless data compression of CLUTs. Techniques for lossless data compression lie in one of two main categories: The first class of methods attempts to build an (adaptive) dictionary of “patterns” observed in the data and represents specific data values encountered as pointers to the dictionary location in which the values can be found. The LZW4,5 compression method and its variants, including those used for zip files,3 are common examples of this first class of methods. These methods perform extremely well when the data contain frequent and long repeats since the dictionary representation becomes extremely efficient under these circumstances. A second class of methods operates by modeling the probability distribution of observed data values. In order to achieve compression, frequently occurring symbol values are assigned shorter binary representations and longer representations are used for infrequent symbol values (while maintaining distinctness that allows reconstruction of the original values from these representations). Huffman coding and arithmetic coding3,6–9 are representative of this class of techniques. In order to improve lossless compression performance over CLUTs, we introduce a preprocessing step as shown in Figure 2. The preprocessing combines predictive coding and data rearrangement. The predictive coding is used to reduce the variance of the CLUT data. The data rearrangement technique is used to reorder the multidimensional CLUT data into a one-dimensional (1D) stream that is better suited for the lossless compressor than the default order. Both these techniques utilize the knowledge that the CLUT data represent a smooth and continuous transformation between different spaces. In applications where the data being compressed losslessly represents a (quantized version of a) continuous valued signal, often the compression performance can be improved by preprocessing the data by employing predictive coding. This concept is illustrated in the diagrams of Figure 3. We assume that the data to be encoded are represented in the form of a 1D sequence U共n兲, n = 0 , 1 , . . . At the encoder, using past values of the data, a predictor obtains an ˆ 共n兲 for the current data value. The prediction estimate U ˆ 共n兲 is computed and forms the input residual e共n兲 = U共n兲 − U to the lossless compressor. For an appropriately chosen predictor, the prediction residual has a lower variance than the original data and hence requires a lower data rate after compression than what is required for the original data. One of the simplest predictive codes is obtained by using the previous sample value as the prediction, i.e.,
040901-2
Jul.-Aug. 2008
Balaji et al.: Preprocessing methods for improved lossless compression of color look-up tables
ˆ 共n兲 = U共n − 1兲 in Fig. 3. This is referred to as differential U encoding and has been widely adopted in data compression. Mathematically differential coding can be specified by the encoding relation e共n兲 = U共n兲 − U共n − 1兲
and
e共0兲 = U共0兲,
共1兲
where U共n兲 and e共n兲 denote, respectively, the input and output of the differential encoder at “time” n. The corresponding decoding relation is readily obtained as U共n兲 = U共n − 1兲 + e共n兲
and
U共0兲 = e共0兲.
共2兲
If adjacent values are highly correlated the differential encoding provides significant improvement in compression. The preceding presentation of differential coding assumed a one-dimensional data sequence. In order to accommodate multidimensional CLUTs we develop a hierarchical extension that we describe next.
Figure 3. Predictive coding block diagram.
Hierarchical Differential Encoding As the CLUT represents a smooth, continuous transformation between two different color spaces, the application of differential encoding hierarchically (as stated in the previous section) helps reduce the variance of the data by exploiting the spatial correlation of the CLUT data. The hierarchical extension can be performed either recursively or nonrecursively on the CLUT data. The former is called recursive hierarchical differential encoding (RHD) and the latter nonrecursive hierarchical differential encoding (NRHD). Recursive Hierarchical Differential Encoding Recursive hierarchical differential encoding (RHD) may be interpreted as encoding a differentiable function in terms of its partial derivatives. In order to see this, consider the case of a three-dimensional CLUT as shown in Figure 4, where the three CMY axes represent the input dimensions of the CLUT. For our description, we assume that the output value of the CLUT is R denoting the red channel (the same description will apply to other output channels as well as to CLUTs with different input and output color spaces). The CLUT size is assumed to be q ⫻ q ⫻ q. The processing steps in RHD may then be interpreted as follows: Step 1. First the values along each of the adjacent nodes along lines M = m , Y = y are encoded as differences, where m and y are chosen from the indices 1 , . . . , q. This corresponds to replacing all nodes (except C = 1, M = 1, Y = 1 node) with a difference that approximates ␦R / ␦C. In actuality the difference will represent ␦R / ␦C times the inter-sample distance along the C axis. We will ignore these factors corresponding to the LUT sampling distance in our description. Step 2. The values from each of the adjacent lines M = 2 , . . . q are then encoded as differences with respect to the preceding line, corresponding to replacing all the lines (except M = 1 line) with a difference that approximates ␦2R / ␦C␦M.
Figure 4. Hierarchical differential encoding shown for one output plane R corresponding to three input planes C, M, and Y. The CLUT is assumed to be of size q ⫻ q ⫻ q. J. Imaging Sci. Technol.
040901-3
Jul.-Aug. 2008
Balaji et al.: Preprocessing methods for improved lossless compression of color look-up tables
Figure 5. Recursive hierarchical differential encoding algorithm for a three-dimensional 共3D兲 CLUT with q ⫻ q ⫻ q nodes.
Step 3. The values along each of the planes Y = 2 , . . . q are then replaced by the difference with respect to the preceding plane. This corresponds to replacing all the planes (except Y = 1 plane) with an approximation equivalent to ␦3R / ␦C␦M␦Y. Note that Step 2 computes the differences of the differences evaluated in Step 1 and likewise Step 3 computes differences of these differences. Hence the “recursive” moniker is used for this technique. Decoding is accomplished by reversing the encoding steps, proceeding in the same order as the encoding. The resulting algorithm for a threedimensional CLUT sized q ⫻ q ⫻ q is summarized in MATLAB style vectorized pseudo code as shown in Figures 5 (encoding) and 6 (decoding). Nonrecursive Hierarchical Differential Encoding Nonrecursive hierarchical differential encoding (NRHD) is similar to RHD except that the differences are not computed recursively. Referring to Fig. 4 the NRHD algorithm can be interpreted as follows: Step 1. The first line of the CMY plane is encoded by taking the differences along adjacent data values along the line. This is equivalent to replacing the nodes (except C = 1, M = 1, Y = 1 node) with an approximation of ␦R / ␦C. Step 2. The data in the adjacent lines along the M plane, numbering from m = 2 , . . . q, are encoded as differences of the original CLUT values along the M direction, approximating ␦R / ␦M. Step 3. The values along the planes Y = 2 , . . . q are then replaced by the differences only along the Y direction which will result in an approximation equivalent to ␦R / ␦Y. Note that in the NRHD method differences are computed and no “differences of differences” are computed. Hence all encoded values correspond to the first order partial derivatives. Both the RHD and NRHD methods are applied independently for each of the output coordinate values in the CLUT. These methods are computationally simple and readily generalized to arbitrary number of dimensions. For typical CLUTs, values at adjacent nodes are highly correlated since the CLUT represents a relatively fine sampling of a smooth transformation between different color J. Imaging Sci. Technol.
Figure 6. Recursive hierarchical differential decoding algorithm for a 3D CLUT with q ⫻ q ⫻ q nodes.
spaces. As a result, the output from the differential encoding process has a significantly lower variance than the input. This can be seen in Figs. 7(b) and 7(c), where the histograms of the input and the output of the two different types of differential encoding are shown, respectively, in parts (a), (b), and (c). The narrower spread of the histogram in Figs. 7(a) and 7(b) reflects the aforementioned reduction in variance. Cellular Interpolative Prediction Model An alternate natural method for predictive coding of CLUTs is to consider a coarse to fine sampling of the LUT axes and use an interpolation-based predictor. We illustrate this in Figure 8 for the two-dimensional (2D) case, where the CLUT axes are assumed to be C and M. The method begins with the four outermost node points (0,0), (0,1), (1,0), and (1,1) in the CM plane, viz. elements of {0,1}.2 This collection of the four points constitutes the coarsest level representation of the LUT, where there are two samples along each axes. The LUT output values for these nodes are encoded directly. At the next finer level of representation of the LUT, an additional sample is included along each axis. Thus this level includes the LUT nodes lying in the set which are as shown in Fig. 8(a). The subset of nodes at this level with coordinates in the set are available from the previous coarser representation and nodes for which any one (or more) of the coordinate values is 0.5 are not. For this latter set of nodes [shown in Fig. 8(a) as hollow circles], predicted values are obtained by interpolating over the nodes at the preceding coarser level [which are shown in Fig. 8(a) as solid dots]. The corresponding prediction residual is then computed and encoded for this latter set of nodes. This process is continued recursively. At the kth 共k = 0 , 1 , . . . log2共共q − 1兲 / 2兲兲 level representation 共2k + 1兲2 of the LUT nodes are included. (We assume here that the size q of the LUT is of the form 2J + 1 for some positive integer J. The method is readily generalized to cases where this does not hold.) The next finer representation at the 共k + 1兲th level with 共2共k + 1兲 + 1兲2 of the LUT nodes is obtained by retaining these nodes and introducing an addi-
040901-4
Jul.-Aug. 2008
Balaji et al.: Preprocessing methods for improved lossless compression of color look-up tables
Figure 7. Histogram of 共a兲 original CLUT data, 共b兲 prediction residual obtained from NRHD coding 共c兲, prediction residual obtained from NRHD coding, 共d兲 prediction residual obtained from cellular interpolative predictive coding.
tional sample point between each pair of adjacent sample points along each of the axes. For the additional nodes introduced at the 共k + 1兲th level, predicted values are obtained by interpolating over the nodes at the kth level. The corresponding prediction residual is then computed and encoded. Fig. 8(b) illustrates the nodes added for our twodimensional example at level k = 1. This recursive process is continued until all LUT nodes are included. The method can be readily generalized to arbitrary number of dimensions and arbitrary LUT sizes. The pseudo code for the twodimensional case is listed in Figures 9 and 10. For the case of the CMYK LUT (and linear interpolation) the cellular interpolative process outlined in the preceding paragraph corresponds to the cellular Neugebauer model. At each level, the set of node points from the preceding level defines the primaries of the cellular Neugebauer model which is utilized for predicting the new node points J. Imaging Sci. Technol.
added. At the coarsest level, the initial 24 nodes correspond to the 16 Neugebauer primaries. As the levels progress the node points grow in number from 24 to 34, to 54, to 94 until the full CLUT size is reached. Fig. 7(d) shows the significant reduction in the variance of the prediction residual of the cellular interpolative model in comparison with the original CLUT data. Data Serialization/Reordering Both class of lossless compression methods described in the previous section on the Preprocessing Framework for Improving Lossless CLUT Compression operate on a sequential “stream” of input data. In order to apply these methods to multidimensional constructs, such as CLUTs, it is necessary to arrange the multidimensional data in the form of a onedimensional stream, a process that we will refer to as serialization of the CLUT. In general serialization is accomplished
040901-5
Jul.-Aug. 2008
Balaji et al.: Preprocessing methods for improved lossless compression of color look-up tables
Figure 9. Cellular interpolative predictive encoding algorithm.
Figure 8. Two-dimensional illustration of the cellular interpolative prediction model.
by defining the sequence in which the nodes of the multidimensional LUT are traversed, producing the onedimensional stream. Typically, the order in which data is stored (e.g., row-major/column-major) in computer memory constitutes the natural sequence for obtaining the onedimensional data stream. However, from the characteristics of the compression methods outlined in the previous section on improving lossless CLUT mentioned above, it is apparent that improved compression may often be obtained simply by rearranging the data. This will be the case; if for instance, the reordering increases repetition within the data. Though it is feasible to determine a data adaptive reordering,10 it can be computationally demanding, making it unsuitable for the target application. In addition, adaptive ordering requires that the specification of the order in which the data was J. Imaging Sci. Technol.
Figure 10. Cellular interpolative predictive decoding algorithm.
rearranged also be stored in the compressed representation so that this may be undone during decompression. Instead, we propose simpler alternatives for data rearrangement that utilize the knowledge that the data represents a CLUT. Data Reordering for Hierarchical Differential Encoding As indicated earlier, the NRHD and RHD encoded versions of the CLUT data obtained from the hierarchical differential encoding method approximate the partial derivatives of the CLUT transforms. Therefore, just like the original CLUTS, the NRHD, and RHD encoded versions also represent continuous and smooth multidimensional functions. While the continuity and smoothness are clearly desirable from a com-
040901-6
Jul.-Aug. 2008
Balaji et al.: Preprocessing methods for improved lossless compression of color look-up tables
Figure 11. Scan space filling curves.
pression perspective, these traits hold only in the multidimensional representation of the LUT and the onedimensional serialization of the data into a sequence for the purpose of compression does not necessarily preserve these traits. Specifically, consider Figure 11 where a 2D LUT is used for illustration. Fig. 11(a) depicts the natural “raster-scan” order corresponding to typical ordering of the LUT data in memory. A serialization of the data in this order results in a discontinuous step in the 2D CLUT coordinates due to the jump from the end of a line to the start of the next. To eliminate these discontinuities that are artificially induced by the data serialization, we propose instead to obtain the one-dimensional data through the traversal of the multidimensional CLUT along a space filling curve11–14 that assures that the data are traversed in a manner that preserves continuity in the input space of the multidimensional CLUT. Specifically, in this work we use the C-scan ordering shown in Fig. 11(b) and the Hilbert scan shown in Fig. 11(c). Reordering for Cellular Interpolative Prediction For the cellular interpolative model, as one moves from a coarse to fine LUT representation the prediction becomes more reliable and therefore the prediction residuals become smaller in magnitude (statistically speaking). The prediction residuals at the CLUT nodes, however, no longer represent a smooth and continuous transform and therefore the methods of the preceding section are inappropriate for the purpose of serializing the data. The coarse to fine progression also offers a natural order for serialization of the data in which one expects a successively decreasing variance. Figure 12 illustrates this behavior where the prediction residuals for a 173 CLUT are shown along with a demarcation of the different levels. EXPERIMENTAL RESULTS The proposed methods were implemented in C⫹⫹ and MATLAB, in order to assess their performance. A collection of CLUTs representative of a typical printer configuration was utilized for performing the evaluation. The CLUTs used an 8 bit output data representation one of either 17 or 33 sampling nodes along each CLUT dimension. The set of 8 bit 17 node tables included:
Figure 12. Serialization of the prediction residuals after cellular interpolative predictive coding.
(1) Four forward CMYK device tables (mapping to device independent color space) each of size 174 ⫻ 3, totaling 1,002,252 bytes. These correspond to two J. Imaging Sci. Technol.
040901-7
standard CMYK tables (SWOP and EURO) and two device response tables (obtained by two different methods). (2) Four forward RGB device tables, each of size 173 ⫻ 3, totaling 58,956 bytes, corresponding to different RGB input spaces, and (3) Nine pairs of inverse printer (correction) tables Jul.-Aug. 2008
Balaji et al.: Preprocessing methods for improved lossless compression of color look-up tables
(mapping from device independent color space to printer CMYK), each of size 173 ⫻ 4, for a total of 265,302 bytes. The tables correspond to the nine different media choices for the printer (transparency, plain paper, coated paper, etc.) and two elements in each pair differed in their black generation. A similar set of printer tables were used for 33-node representation. The evaluation of compression was performed using the following preprocessing methods: (1) NRHD, RHD encoding methods along with one out of C-scan, Hilbert, and raster scan options for the serialization of CLUT data; (2) cellular interpolation prediction model. Five compression methods—LZMA,15 bzip2,16 gzip, LZW and AAC—were evaluated. In addition to the proposed preprocessing based methods, direct compression of the tables was also performed using each of these methods for benchmarking our performance improvement. In the following, the additional processing steps are outlined and the results summarized. Table I. Average compression ratios for recursive hierarchical differential and nonrecursive hierarchical differential compression methods. Averages are computed over four forward CMYK device tables, where size of each table is 250563 bytes in uncompressed format Preprocessing RHD+
NRHD+
C-scan
Hilbert
Raster
C-scan
Hilbert
Raster
LZMA
2.58
2.58
2.56
3.15
3.07
2.83
bzip2
2.38
2.31
2.37
2.93
2.85
2.37
Gzip
2.31
2.30
2.30
2.68
2.64
2.29
AAC
2.63
2.63
2.63
2.40
2.41
2.35
LZW
2.15
2.14
2.09
2.42
2.49
2.45
From the information on the sizes of the different tables, we see that CMYK tables account for a major part (72%) of the CLUT data. We therefore begin by comparing the performance for different methods over these tables. We first compare the performance across the different variants of the proposed hierarchical differential encoding methods. Table I lists the average compression ratios over the CMYK table data set for the different possible combinations of NRHD/RHD differential encoding methods with the raster/ C-scan/Hilbert space filling curves for data reordering, and LZMA/bzip2 for compression. From a comparison of the numbers in Table I, it is apparent that the NRHD+ C-Scan + LZMA method performs best with NRHD+ Hilbertscan + LZMA as a fairly close second. Next we compare the best performing hierarchical differential encoding method 共NRHD+ C-Scan+ LZMA兲 against the cellular interpolative prediction. Table II compares the performance of these two methods against each other and against direct compression over the four CMYK tables. From the tabulated values we can see that these two methods perform uniformly and significantly better than direct compression. From the detailed results, we have seen that the performance across CLUTs is rather similar and therefore averaged values over the CLUTs may be used to draw useful and significant conclusions. Observing the numbers in Table II it is apparent that cellular interpolative prediction model performs best (with a 31% saving in memory requirements over direct compression). The nonrecursive hierarchical encoding with C-scan reordering provides a saving of 25% over direct compression. In Table III we compare the performance of the aforementioned two methods against direct compression over the complete data set of the printer tables. Once again, from the compression results enumerated in Table III, we see that the proposed methods offer significant gains over direct compression. The best performing method (cellular interpolative prediction model+ LZMA) offers a reduction in memory of 67.10% in comparison with uncompressed binary tables. As stated in the Introduction, finer sampling of the CLUT input space increases the sizes of the tables exponentially, causing additional concerns regarding memory re-
Table II. Compression performance of nonrecursive differential encoding and cellular interpolative prediction model on CMYK front end tables 共in bytes, savings over direct compression and compression ratio兲. Results represent averages over four tables with each table 250563 bytes in uncompressed binary format. Blind Compression 共Baseline兲
Cellular Interpolative Prediction Model+ Compression
C-scan+ NRHD+ Compression
File Size 共Bytes兲
Comp. Ratio
File Size 共Bytes兲
Savings over Baseline
Comp. Ratio
File Size 共Bytes兲
Savings over Baseline
Comp. Ratio
LZMA
423908
2.36
318598
105310 共24.84%兲
3.15
291108
132800 共31.33%兲
3.45
bzip2
450575
2.22
344328
106247 共23.58%兲
2.91
344328
106247 共23.58%兲
2.93
Gzip
540373
1.85
374472
165901 共30.70%兲
2.68
345584
194789 共36.05%兲
2.91
AAC
842445
1.19
417604
424841 共50.43%兲
2.40
303819
538626 共63.92%兲
3.31
LZW
1041991
0.96
414377
627614 共60.23%兲
2.42
352830
689170 共66.14%兲
2.86
J. Imaging Sci. Technol.
040901-8
Jul.-Aug. 2008
Balaji et al.: Preprocessing methods for improved lossless compression of color look-up tables
Table III. Compression ratio 共total bytes uncompressed/total bytes compressed兲 over the printer data set for direct compression and the best performing compression methods. The set of tables included four CMYK, four RGB, and nine pairs of back end tables totaling 1414944 bytes in binary format. Front End Tables
Direct Compression
LZMA
CMYK
RGB
Back End Tables
2.36
1.65
2.13
Complete Device Tables 2.26
bzip2
2.22
1.59
1.95
2.11
Gzip
1.85
1.25
1.65
1.76
LZMA+ Cellular Interpolative Prediction Model
3.45
2.67
2.72
3.19
LZMA+ NRHD+ C Scan
3.15
2.24
2.93
3.04
Table IV. Compression ratio 共total bytes uncompressed / total bytes compressed兲 over the printer data set for direct compression and the best performing compression methods over CLUTs with 33 nodes per input dimension. The set of tables included seven CMYK, four RGB, and eight pairs of back end tables totaling 27635553 bytes in binary format. Front End Tables CMYK Direct Compression
RGB
Back End Tables
Complete Device Tables
LZMA
4.05
2.65
3.26
3.60
bzip2
3.84
2.74
3.23
3.49
Gzip
2.92
2.02
2.47
2.65
LZMA+ Cellular Interpolative Prediction Model
5.96
4.83
3.98
5.06
LZMA+ NRHD+ C Scan
4.94
3.77
4.14
4.51
quirements. We also evaluated the algorithms developed in this work over finer sampled 33 node tables. The results obtained with the best performing methods are summarized in Table IV. From the entries in the table, it can be seen that once again considerable savings can be achieved with the proposed preprocessing methods in comparison with the direct compression (without preprocessing). The compression ratios actually improve for the finer sampled case and can partly alleviate the concern about memory requirements for finer sampled CLUTs. To assess the relative contributions of the predictive coding and the reordering stages, we also evaluated LZMA compression with hierarchical differential encoding without reordering over our data set; this provided a compression ratio of 2.71 for the 17 node tables. Note that, when used together, predictive coding and reordering with LZMA provide a compression ratio of 3.04 (refer to Table III). Thus we see that both the predictive coding and the reordering make significant contributions to the improvement in compression. J. Imaging Sci. Technol.
CONCLUSIONS Preprocessing of CLUT data prior to lossless compression provides significant improvement in compression performance. In experimental evaluation over a representative printer dataset, the best performing method offered memory savings of approximately 69% compared with the uncompressed tables. Compared with direct compression of these tables (without preprocessing) the proposed methods save approximately 32% in memory requirements. The preprocessing methods proposed here are computationally simple and can be readily implemented in printer firmware and in software with little computational overhead. Among the compression techniques evaluated, LZMA with cellular interpolative predictive coding, along with a coarse to fine data reordering, offered the best performance over a representative set of printer CLUTs. Over a full data set of 17 node CLUTs representative of current hardware, this method offered a compression ratio of 3.19. For finer sampled 33 node CLUTs a compression ratio of 5.06 was obtained in our evaluation. The next best performing method, non-recursive hierarchical differential encoding (NRHD) with C-scan reordering, was also competitive and yielded a compression ratio of 3.04 for 17 node CLUTs.
REFERENCES 1
M. Anderson, R. Motta, S. Chandrasekar, and M. Stokes, “Proposal for a standard default color space for the internet-sRGB”, in Proc. IS&T/SID Fourth Color Imaging Conference: Color Science, Systems and Applications (IS&T, Springfield, VA, 1996), pp. 238–246. 2 S. R. A. Balaji, G. Sharma, M. Q. Shaw, and R. Guay, “Hierarchical compression of color look up tables”, in Proc. IS&T/SID Fifteenth Color Imaging Conference: Color Science and Engineering: Systems, Technologies, Applications (IS&T, Springfield, VA, 2007), pp. 261–266. 3 K. Sayood, Introduction to Data Compression, 2nd ed. (Morgan Kaufmann, San Francisco, 2000). 4 T. A. Welch, “A technique for high-performance data compression”, Computer 17, 8–19 (1984). 5 A. Lempel and J. Ziv, “On the complexity of finite sequences”, IEEE Trans. Inf. Theory IT-22, 75–81 (1976). 6 G. E. Blelloch, “Introduction to data compression”, http:// www.cs.cmu.edu/afs/cs/project/pscicoguyba/realworld/www/ compression.pdf, accessed Sept. 2007. 7 G. G. Langdon and J. J. Rissanen, “A simple general binary source code”, IEEE Trans. Inf. Theory IT-28, 800 (1982). 8 J. Rissanen, “Generalized Kraft inequality and arithmetic coding”, IBM J. Res. Dev. 20, 198 (1976). 9 G. G. Langdon, “An introduction to arithmetic coding”, IBM J. Res. Dev. 28, 135–149 (1984). 10 S. Vucetic, “A fast algorithm for lossless compression of data tables by reordering”, in Proceedings of Data Compression Conference (IEEE Computer Press, Los Alamitos, CA, 2006), p. 1. 11 H. Sagan, Space-Filling Curves (Springer, Berlin, 1994). 12 S. Kamata, M. Nimmi, and E. Kawaguchi, “A gray image compression using Hilbert scan”, Proc. International Conf. on Pattern Recognition (ICPR) (IEEE Computer Press, Los Alamitos, CA, 1996, Vol. 3, pp. 905–909. 13 Z. Song and N. Roussopoulous, “Using Hilbert curve in image storing and retrieving”, Information Systems 27(8), 523–536 (2002). 14 T. Bially, “Space Filling Curves: Their generation and their application to bandwidth reduction”, IEEE Trans. Inf. Theory 15, 658–664 (1969). 15 “7-zip software development kit”, http://www.7–zip.org/sdk.html, accessed Sept. 2007. 16 “Bzip2”, http://www.bzip.org, accessed Sept. 2007.
040901-9
Jul.-Aug. 2008