[2] N. Schliep-Andraschko F.M. Andraschko, A. Krekeler. Terminologie, Klassifikation und computergestuetzte Bearbeitung der. Keramik des 1. Jahrtausends v.
Preprocessing of 3D-Data for Classification of Archaelogical Fragments in an �� Automated System H. Mara, M. Kampel, R. Sablatnig Pattern Recognition and Image Processing Group Institute of Computer Aided Automation, Vienna University of Technology, Favoritenstraße 9/1832, A-1040 Vienna, Austria Fax: +43(1)58801-18392; e-mail: � mara, kampel, sab � @prip.tuwien.ac.at
Abstract:
Thousands of fragments of ceramics (called sherds for short) are found at archaeolgical excavation sites. Till today archaeologists have drawn and classified them manually. This method is very timeconsuming and classification depends on the expierences of the archaeologists. So we developed a system for classification based on 3D-models of the sherds acquired by a 3D-scanner using stuctured light. The 3D-model is properly orientated by estimating the rotational by the use of plane-fitting and a Hough-inspired method. Afterwards the longest elongation (called profile) around the wall of the sherd is calculated. The extremal points of the curvature of the profile are calculated to segment the curvature into its primitives. The classification is done by comparison of the extremal points and primitives as it is done by archaelogists. Experiments show that the automated system provides a fast and consequential classification.
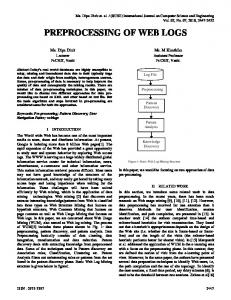
1 Introduction Motivated by the requirements of todays archaeology, we are developing an automated system for archaeological classification of ceramics. Ceramics are among of the most widespread archaeological finds, have been used for a short period of time for classification purposes. Since the 19th century, the physical characteristics of archaeological pottery have been used to assess cultural groups, population movements, inter-regional contacts, production contexts, and technical or functional constraints (archaeometry). Because archaeometry of pottery still suffers from a lack of methodology, it is important to develop analytical classification tools of artifacts [8]. A large number of ceramic fragments, called sherds, are found at every excavation site (Figure 1). These fragments are documented by being photographed, measured, and drawn; then they are classified. The purpose of classification is to get a systematic view on the excavation finds. Traditional archaeological classification is based on the so-called profile of the object, which is the crosssection of the fragment in the direction of the rotational axis of symmetry. This two-dimensional plot holds all the information needed to perform archaeological research. The correct profile and the correct axis of rotation are thus essential to reconstruct and classify archaeological ceramics. ��
This work was partly supported by the Austrian Science Foundation (FWF) under grant P13385-INF, the European Union under grant IST-1999-20273 and the Austrian Federal Ministry of Education, Science and Culture.
Figure 1: boxes filled with ceramics stored in archives
The sample of classification rules [11] shown below in Table 1 were applied at the late Roman burnished ware of Carnuntum [3]. Classification is applied on unbroken vessels - further called objects - or on fragments of basic vessel form
characteristic ratio
rim-diameter
wall-diameter
plate
1:8
16-34 cm
-
bowl
1:2 - 1:4
10-16 cm 12-30 cm
-
beaker
1:1
8-11 cm
7-14 cm
jug
4:1 - 2:1
6-14 cm
(no references)
pot
1:1 - 3:1
8-12 cm 12-16 cm
15-25 cm 18-21 cm
Table 1: Classification of basic vessel types
objects called sherds. Not all sherds can be used for classification, because some of them are too small or do not contain robust features. So we start with classification of fragments that contain a part of the rim, which is the top level part of the object around the orifice. The classification of basic vessel form by archaeologists consists of several measurements[2]: �
�
Rim-diameter: The diameter of the orifice plane.
�
Wall-diameter: The maximum diameter of the object orthogonal to its rotational axis
�
Height: The overall height of the object The characteristic ratio: The ratio between height and rim-diameter
To determine which type of vessel a sherd belongs to, the profile is used. Archaeologists use the number of extremal points and their distance ratios to determine which type of vessel a sherd belongs to.
The next section (2) explains the acquisition and processing (Section 3) of the 3D-data in order to achive the profile section. Section 4 describes the automatic segmentation of the profile for the correct classification of the fragment. Finally the results are presented in Section 5 and a outlook for future enhancement (Section 6) is given.
2 Data Acquisition The first approach to acquiring data was carried out with two CCD camera and two lasers, resulting in a two dimensional image of the profile. The lasers were mounted in one plane on both sides of the fragments, so that one camera took the picture of the laser-plane projected on the outer side (Figure 2b) and the other one on the inner side of the sherd as seen in Figure 2a. These images were combined, so that a profile line containing the inner and outer profile was generated (see Figure 2c. The resulting image was filtered by an adaptive threshold that separates the background from the laser. Afterwards the laser line was thinned, so that a profile line - similar to the lines drawn by hand from archaeologists - was extracted.
(a)
(b)
(c)
Figure 2: 2D-acquisition with 2 lasers and 2 cameras: (a) Camera 1 acquires laserline 1, (b) Merged image from camera 1 and 2, (c) Camera 2 acquires laserline 2.
This method has some drawbacks for using it in an automated system: 1. The sherd has to be oriented manually, because no axis of orientation can be estimated from the recorded data. 2. The diameter of the whole object has to be determined manually. 3. The position of the fragment, laser and camera in the acquisition system has to be selected, so that there are a minimum occlusion effects of the laser plane and that the longest profile (see Section 3) line is recorded. In our new system, a 3D-model of the sherd is acquired by a 3D-measurement system based on structured (coded) light technique. Shape from structured light is a method which constructs a surface model of an object based on projecting well defined light patterns onto the object. The image, together with the knowledge about the pattern and its relative position to the camera, are used to calculate the coordinates of points belonging to the surface of the object [6]. From this 3D-data the profile sections are extracted automatically. The 3D-data is stored as 3D-points (called vertices) that are connected in form of triangles (called patches).
These vertices and patches are stored in an indexed list. A sample of vertices and patches is shown in Figure 3a. Every patch consists of three indices to the corresponding vertices and for every patch the color of its texture is stored as RGB-value. This kind of representation has been selected to export und import the data as a software independent VRML-file (The 3D-model shown in Figure 3b). Similar to the process of taking and merging two images of both parts of the laser profile, the 3D-scanner records the inner and outer view of the fragment and these two views are registered [10] to a 3D-model of the sherd.
(a)
(b)
Figure 3: (a) Connected vertices along patch edges, (b) 3D-Model of the sherd (VRML)
3 Data Processing The processing begins with an estimation of the proper orientation of the sherd, because the calculation of several measurements (eg. heights, diameters, etc.) depends on it. In the case of ancient pottery, which was manufactured on rotational plates, every object and thus every fragment has a rotational axis which is used for orientation. This axis is calculated from the 3D-data with a Hough inspired method [13]. Since this method does not work correctly for bottom pieces with a flat underside, a second method is applied. This method is based on plane-fitting, which finds the plane of the flat bottom (Figure 4 left). This plane is orthogonal to the rotational axis. To find the position of the rotational axis through the plane, the points of the bottom plane, which represent the outline of the bottom, are extracted. From this outline, the part, which is circular is extracted. Then the center of this circular is calculated, which is the point where the rotational axis is located orthogonal to the plane. This method has been adapted from usage with rim fragments (Figure 4 right), where the orifice plane is orthogonal to the rotational axis and the orifice points are located on a part of a circle.
(a)
(b)
Figure 4: (a) Bottom fragment, (b) Rim fragment (upside down).
To estimate the longest profile line we use the orientated sherd. This profile is supposed to be the longest elongation along the surface of the sherd parallel to the rotational axis � �� through two points � ������� ������ . This profile line is located where the fragment has its maximum height �����! . The height ��" is defined as the orthogonal distance from a point #" of the sherd to the orifice plane of the object. For every point of the 3D-model of the sherd the height has to be calculated and the point $���! with the maximum height �����!&%('*),+- ���".� is selected. Next the parameters for the intersecting plane /0%1 � $�2���� ����3�� ����!4� spanned through the points of the rotational axis ���5 and this point 6���! are calculated. With the parameters of the plane / that intersects the fragment where the longest profile line is located the distances between the plane / and each vertex of the 3D-model are calculated. Then the nearest 1% of points are selected as candidates for the profile. For each of those vertices all the patches they belong to are filtered through a search in the patch list with their index number. In Figure 5a a sherd colored by the value of distance is shown (lighter means nearer to the intesecting plane). As mentioned before, every patch is a triangle which consists of three points that are connected through three lines. 4
inner profile outer profile minima maxima top point bottom point
3
2
1
0
−1
−2
−3
−4 14
(a)
15
16
17
18
19
20
21
22
23
24
(b)
Figure 5: (a) Properly oriented sherd and intersecting plane for profile extraction, (b) Estimated oriented profile with extremal points for classification.
The position is calculated for all these three combinationa of pairs of points of the filtered patches. The �98;:�8@?BAC�>8@D position is calculated using the Hessian normal form )7+ %FE . The Hessian normal form is used to calculate the distances between the points and the plane. We use the sign of the distances, which corresponds to the side of the plane on which a point is located. Every pair of vertices that has both points on different sides of the plane is part of the profile line, because its connection intersects the plane. The coordinates of these pairs are rotated into the xy-plane and the z-coordinate is removed. This result is a properly oriented profile line (Figure 5b). This profile line is stored as indexed list #G�H of 2D-coordinates I"�%J LK5"M�N�OK5"P�3� of curvature points and a list of index pairs Q7�SRT%FU= OV���W4��X . These inded pairs represent the connection between the points �" . The pairs of vertices of the profile line are sorted, so that each point I" in the list is connected with its immediate neighbour
"MYZ� and "\[]� . The profile is stored as a single closed list of connected pairs of points. The indexed list -G�H D and the list of pairs Q7�SR are transformed into a indexed list � ^_G of angles )=`LKS�5) " and distances " between
connected pairs of points and the coordinate of the first point K5"�%bU�+c"d�
<
$"Pa]�
of the indexed list
-G�H
.
Y Y D ? "dXfeg� ^_GZ%hUji Kc"lk&Kcm_iL�_n o�x p Y o�qsruxytvx n o�w Y � o qvx r Xz%bU V�{�|�)=} /N"~���".X o�p � o q o�w o�q
This representation is used for segmentation of the profile-line.
4 Segmentation of the Profile Section Following the manual strategy of the archaeologists, the profile should first be segmented into its parts, the so-called primitives, automatically. The profile determined has to be converted into a parameterized curve [12, 4] and the curvature has to be computed [1, 7]. Local changes in curvature [9] are the basis for rules required for segmenting the profile. Our approach is a hierarchical segmentation of the profile into rim, wall, and base by creating segmentation rules based on expert knowledge of the archaeologists and the curvature of the profile. The segments of the curve are divided by so called segmentation points. If there is a corner point, that means a point where the curvature changes significantly, the segmentation point is obvious. If there is no corner point, the segmentation point has to be determined mathematically. The curve is characterized by several points. Figure 6a shows the segmentation scheme of an S-shaped vessel as an example. A set of characteristic points is defined as follows. �
�
inflection point ((, ): point, where the curvature changes its sign;
�
local maximum ( b ): point of vertical tangency;
�
local minimum ( b ): point of vertical tangency;
�
orifice point (
): outermost point, where the profile line touches the orifice plane;
�
base point ( ): outermost point, where the profile line touches the base plane; point of the axis of rotation (
): point, where the profile line touches the axis of rotation.
(a)
(b)
Figure 6: S-shaped vessel: (a) Profile segmentation scheme, (b) Part of the profile line.
By means of these curve points several main segments of a vessel are distinguished: rim, upper part, lower part, neck, shoulder, belly and bottom. Different kinds of vessels can be classified on the basis of the number and characteristics of these segments.
Segmentation is done only on the outer half of the profile [8], because the inner side does not contain information about the vessel’s class in the form of curvature. So the profile is divided in the outer and inner profile at the orifice and the bottom point, which is calculated by knowledge of the orientation. The next step is to split the outer profile into its primitives by locating the characteristic points. These points are found within the transformed data from Section 2. For each point l the change of angle is calculated as the angle between the vector $"]kT S and the vector
S>k ]m shown in Figure 6b. This is done by the use of angles in the transformed data � ^_G . The list of changing angles is smoothed with multi-spline-representation [5], so that distortions are eliminated and the characteristic points for further classification in the curvature can be calculated. Figure 7a shows one example of an automatically segmented pot with the characteristic points detected and the appropriate manual segmentation in Figure 7b.
(a)
(b)
Figure 7: (a) properly oriented sherd with intersecting plane (b) inner and outer profile with extremal points for classification
5 Results Regarding the experiments of a prototype written in matlab using 70 3D-models of real sherds consisting of 100000 to 80000 vertices and 20000 to 160000 patches. The computer used for our performance evaluation is a /N}l|~V�5'&=, running at 1 GHz with 512 MB of RAM. The performance is shown in Table 2. Experiments have shown that the estimation of the rotational axis, profile and the classifcation is done in less than a minute. Considering the amount of time used by archeologists the prototype increases the classification time from a maximum of 10 sherds per week to 60 sherds per hour. Estimation of
Time
rotational axis proper orientation profileline classification
20-25 sec 10-15 sec less than 5 sec less than 5 sec
Table 2: Performance results.
In case of 8 sherds classification could not be done, because the rotational axis could not be extracted. Three of those sherds have a handle, which has to be treated seperatly in a future version of the classification software.
The other sherds were to small. The estimation of the rotational axis and the classification of the other 62 sherds was successful. The position of the rotational axis has been verified with the manual methods used by archaeologists. This methods use the bottom or orifce plane for rim- or bottom-pieces and the rills, which arise through the manufacturing of a ceramic by hand, for the remaning sherds. By using the rotational axis for proper orientation for those sherd gives two possibilities to classify them. Both possibilities are tested and the result with the better match is taken. In the case of equal matches the decision between two classes has to be done manual. Experiments with sherds from other excavation sites or from a different period of time in history have shown that the set of rules for classification have to be adapted to allow a successful classification.
6 Outlook Future work will use the collected and estimated data not only for classification of sherds, it will be used to find sherds with matching breakage to reconstruct the original object. This will be done by use of the rotational axis. All sherds beloning to the same type of vessel found in the same place at the archaeologic excavation site will be placed along the rotational axis and tested for a matching breakage. By using the rotational axis the number of possible combinations for comparing breakages is reduced.
References [1] J.R. Bennett and J.S. MacDonald. On the Measurement of Curvature in a Quantized Environment. 24:803–820, 1975. [2] N. Schliep-Andraschko F.M. Andraschko, A. Krekeler. Terminologie, Klassifikation und computergestuetzte Bearbeitung der Keramik des 1. Jahrtausends v. Chr. vom Westkom auf Elephantine, Oberaegypten. In W.R. Teegen F.M. Andraschko, editor, Gedenkschrift f¨ur J¨urgen Driehaus, pages 327–338. 1990. ¨ [3] M. Gr¨unewald. Ausgrabungen im Legionslager von Carnuntum (Grabungen 1969-1977). Der r¨omische Limes in Osterreich, 34:10–11, 1986. [4] Z. Hu and S.D. Ma. The Three Conditions of a Good Line Parameterization. 16:385–388, 1995. [5] Adler K., Kampel M., Kastler R., Penz M., Sablatnig R., Schindler K., and Tosovic S. Computer aided classification of ceramics - achievements and problems. In Proc. of 6th Intl. Workshop on Archaeology and Computers, Nov 2001. [6] M. Kampel and R. Sablatnig. On 3d Modelling of Archaeological Sherds. In Proceedings of International Workshop on Synthetic-Natural Hybrid Coding and Three Dimensional Imaging, Santorini, Greece, pages 95–98, 1999. [7] J. Matas, Z. Shao, and J.V. Kittler. Estimation of Curvature and Tangent Direction by Median Filtered Differencing. pages 83–88, 1995. [8] C. Orton, P. Tyers, and A. Vince. Pottery in Archaeology, 1993. [9] A. Rosenfeld and A. Nakamura. Local Deformations of Digital Curves. 18(7):613–620, July 1997. [10] R. Sablatnig and M. Kampel. Model-based registration of front- and backviews. Computer Vision and Image Understanding, page to appear, 2002. [11] R. Schreg. Keramik aus S¨udwestdeutschland. Eine Hilfe zur Beschreibung, Bestimmung und Datierung arch¨aologischer Funde vom Neolithikum bis zur Neuzeit. T¨ubingen, 1978. [12] A. Shoukry and A. Amin. Topological and Statistical Analysis of Line Drawings. 1:365–374, 1983. [13] S. Ben Yacoub and C. Menard. Robust Axis Determination for Rotational Symmetric Objects out of Range data. In W. Burger and M. Burge, editors, 21 th Workshop of the Oeagm, pages 197–202, Hallstatt, Austria, May 1997.