Advisors Paul Laseau, Ellen Yi-Luen Do,. Daniel Herbert, Ronald Kellett.
Drawing experts who gave us their time and drawings (Frank Ching, Paul.
Laseau, Jim ...
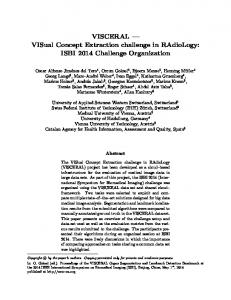
Learning Design with Digital Sketching Copying graphic processes from animations and storyboards Nancy Yen-wen Cheng & Andrew McKelvey University of Oregon
Learning Design with Digital Sketching Copying graphic processes from animations and storyboards
Background & Motivation Hypothesis & Data Collection Analysis Conclusion & Future Work
Background & Motivation
Background
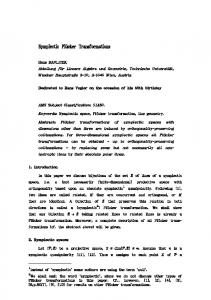
Logitech Io Pen • • •
Draw with special pen and paper Download drawings to desktop computer Review in Logitech software
Background
Anoto Bluetooth concept
Background
Io Paper to Io Software
Drawing by Kenneth O’Connel
Background
Previous work: Research Enables accurate recollection of drawing process Make collecting many samples simple Facilitates in-depth analyses
Background
Previous work: Teaching + Expands range of teaching examples + Accessible digital format enables sharing - Portable equipment requires management pens & papers awkward for sketching + Easy to teach drawing from observation - Unclear how to collect & teach creative design examples
Motivation •
Design sketching remains a mysterious process
•
Need to evaluate the effectiveness of the pen animations for learning
“Sketching...is practiced by individuals who attempt to conceive of a new entity, be it a work of art, a building, a technically-oriented invention or novel artifact, or a scientific concept. The description and specification of the new entity that is being brought into being in those instances entails shapes and forms. The sketcher represents candidate shapes and forms, their parts and features, and relationships among them.” --Gabriella Goldschmidt
Hypothesis & Procedure
Hypothesis •
Interactive animated sketches are better teaching tools than storyboard still images.
Can students viewing an animated sketch copy its process better than students viewing a storyboard of the same sketch?
How to measure learning? To compare understanding of animation & storyboards, we looked at abilities to: 1. INTERPRET the design sequence by numbering the disarrayed steps of the original example in the right order 2. COPY the order of drawing operations 3. DESIGN to fulfil the problem requirements
Data Collection: Subject protocol 1. STUDY planning example as interactive animation OR paper storyboard
c
Data Collection: Subject protocol 1. STUDY planning example as interactive animation OR paper storyboard
c
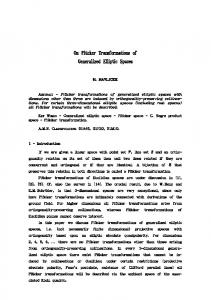
Data Collection: Subject protocol 1. STUDY planning example as interactive animation OR printed storyboard 2. NUMBER given design steps in order Animation
Paper Storyboard
OR
Data Collection: Subject protocol 1. STUDY planning example as interactive animation OR printed storyboard 2. NUMBER given design steps in order 3. MIMIC the steps in doing a similar problem
Data Collection: Subject protocol 1. STUDY planning example as interactive animation OR printed storyboard 2. NUMBER given design steps in order 3. MIMIC the steps in doing a similar problem 4. RE-NUMBER steps & complete survey
Data Collection Design problem given to subjects as text: Fit program spaces into existing building • Example: Graphic design office • Challenge: Rock-climbing gym Subject population • 20 students ave. 2.5 years of architecture school, 10.5 years of drawing
Analysis: Abilities to Interpret, Copy & Design
Analysis issues & Precedents •
Learning from animations vs. still images: (performance studies, developmental psychology) – Animations improve physics teaching – Movement helps recall – Picture recall is superior to text recall
• Parsing sketches: Primitive strokes geometry vs. interpreted intention – Protocol analysis (Design Studies) – Higher level rather than primitives (Do, Gross & Neiman, Ullman) (Von Summers) •
Measuring a sequence match: – step existence, position order, pair sequence matching (developmental psychology)
Analysis 1: Ability to interpret steps TASK Number steps of the original example in the right order RESULTS Animation group performed slightly better than Paper group: all achieved high scores >> Task too easy, oversimplified in effort to clarify)
Analysis 2: Ability to copy steps What steps to look for? • Key steps revealed from 31 earlier office design examples (ECAADE 2004)
Analysis 2: Ability to copy steps A. Categorizing design steps SITE INFO: given building and environment GRIDLINES: guide other lines, not physical PROGRAM: show relative sizes adjacencies PARTI: simple ordering diagrams PLANNING: physical organizing boundaries ARTICULATION: define architectural elements PRESENTATION nonphysical annotations
Clustering groups simplified the task
Analysis 2: Ability to copy steps A. Categorizing design steps B. Use color coding in parsing steps
Analysis 2: Ability to copy steps A.
Categorizing design steps: B. Use color coding in parsing steps in original and copies
Analysis 2: Ability to copy steps A. Categorizing design steps B. Use color coding in parsing steps in original and copies
Analysis 2: Ability to copy steps A.
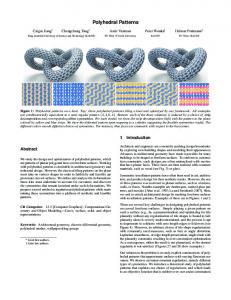
Categorizing design steps: B. Use color coding in parsing steps in original and copies C. Correlate step patterns of original, Animation & Paper Group copies Presence: correct pairs & Order: correct positioning
Analysis 2: Ability to copy steps RESULTS • Students copy steps from animation a little more accurately • 3.6 vs. 2.6 out of 6 possible points INTERPRETATION • Animation more engaging – subjects spent more time looking at the example (novelty & interactivity) • Storyboard already parsed into 6 steps (animation needs pauses to show steps)
Analysis 3: Ability to design PROCEDURE • Define quality criteria • Evaluate examples according to quality criteria • Compare groups
Analysis 3: Ability to design PROCEDURE • Define quality criteria • Evaluate examples according to quality criteria • Compare groups RESULTS • Draws one solution (matches original) • Mezzanine shows 3D understanding • Program area accuracy matches original’s concern INTERPRETATION Animation more compelling, students could follow design more closely
Conclusions & Future Work
Conclusions • Animations can help students identify processes, copy processes & design slightly better than storyboards. • Subtle representational choices shape the kind of information conveyed • Protocol analysis with color bars allows visual pattern matching, digital record >> Interpreting animated sketches with annotated key frames can spur learning
Areas for future research • • • •
Keep refining protocol for design process learning studies Interpret animated sketches into SVG annotated animations for Web Find specialized graphic processes well-suited for research & teaching Examine creative potential of pens with other tools
Acknowledgements Funding Sources • Logitech Corporation •
UO Educational Technology Curriculum Development Fund
•
Northwest Academic Computing Consortium
Digital Sketching Website http://www.uoregon.edu/~arch/digsketch
Research Assistants Stina LaneCummings, Andrew McKelvey, Danae Whipp Advisors Paul Laseau, Ellen Yi-Luen Do, Daniel Herbert, Ronald Kellett Drawing experts who gave us their time and drawings (Frank Ching, Paul Laseau, Jim Liggett, Matt Brehm, and others) Nancy Y. Cheng
[email protected]