DEIS, Universit`a di Bologna - Italy. {paolo.ciaccia,marco.patella}@unibo.it. AbstractâThe traditional ..... point space, it is clear that: ⢠Only cases A and B, which ...
Principles of Information Filtering in Metric Spaces Paolo Ciaccia and Marco Patella DEIS, Universit`a di Bologna - Italy {paolo.ciaccia,marco.patella}@unibo.it
Abstract—The traditional problem of similarity search requires to find, within a set of points, those that are closer to a query point q, according to a distance function d. In this paper we introduce the novel problem of metric filtering: in this scenario, each data point xi possesses its own distance function di and the task is to find those points that are close enough, according to di , to a query point q. This minor difference in the problem formulation introduces a series of challenges from the point of view of efficient evaluation. We provide basic definitions and alternative pivot-based resolution strategies, presenting results from a preliminary experimentation that show how the proposed solutions are indeed effective in reducing evaluation costs.
I. I NTRODUCTION Metric spaces are a powerful framework to describe a variety of search problems that commonly arise in several application domains [1], [2]. For instance, the metric space model has been successfully adopted in content-based retrieval of multimedia objects, in genomic and biomolecular databases, as well as for string/text databases. Although the metric space model is general enough to satisfy the requirements of many contexts, it lacks a relevant feature, which is becoming more and more important for novel database applications, that is, the possibility of accommodating user preferences in the specification of the distance function that determines how much two objects can be considered to be “similar” to each other. This leads to consider an “enlarged” metric scenario, allowing “personalized views” of the space. The simplest case to be examined is when each query q carries its own personal metric, according to which objects are to be ranked: this user-defined queries scenario can be dealt with thanks to recent solutions applicable to generic metric spaces whenever personal metrics all derive from a “default” (natural) metric [3]. The more general case, where each point of the space is associated to its personal metric, represents a generalization of information filtering [4], where a profile is stored for each user of the system and, each time a new information becomes available, it is forwarded only to those users whose profile is sufficiently similar to it (according to the user distance criterion). Clearly, this extension provides the maximum of freedom, since no restrictions are put on the personal metrics. In the following we describe how the model of metric spaces could be extended to the case where
each object “sees” its own metric world. At the same time, we provide some hints that could be exploited by search algorithms to guarantee good performance levels. II. T HE P ROBLEM Given a domain U of objects (U is the “universe”), a metric space over U is a pair M = (U, d), where d is a distance function that satisfies the metric postulates ∀x, y, z ∈ U : d(x, y) ≥ 0 d(x, y) = 0 ⇐⇒ x = y d(x, y) = d(y, x) d(x, z) ≤ d(x, y) + d(y, z)
(non-negativity) (indiscernibility) (symmetry) (triangle inequality)
Consider now a finite subset X of U , called a dataset, and a query point q ∈ U: each point xi ∈ X is associated to a personal metric di and a personal radius ri . In information filtering terms, the triple (xi , di , ri ) represents the profile of the ith user, whereas q is a new item (product). The system’s objective is then to deliver q only to those users whose profiles “match” the new item q, i.e., for which di (xi , q) ≤ ri .1 We call such set of points the query result, with a slight abuse of terminology. This generalizes the Multi-Modal approach presented in [4], that represents information as spatial points, according to the vector-space model [5]: users are modelled as (sets of) points in the same space and information is forwarded only to users whose points are close enough (according to a single distance d) to the query point, thus di ≡ d, ∀i. The focus of [4] is on the efficient updating of user profiles: such results could be easily extended for updating personalized metrics, e.g., by exploiting results on relevance feedback [6]. It has to be remarked that the scenario we consider here is rather different from the case of user-defined queries, where a single distance dq is considered at query time: results in [3] indeed show how metric access methods can be modified so as to efficiently process user-defined queries, the key idea being to exploit a bound on the ratio between dq and a default distance d0 to limit the search space. Indeed, if d0 (q, x)/dq (q, x) ≤ s, ∀x, then knowing that d0 (q, x) > s·r is sufficient to deduce that dq (q, x) > r. The case of “metric filtering” appears to be much more challenging to deal with, 1 The case where each user is associated with multiple profiles can be straightforwardly defined.
since now we have, at each instant, |X| personal metrics in play (one for each element of the dataset). Indeed, if no reasonable assumption is made on the di metrics, it is not possible to exploit the triangle inequality to speedup the search process. To see why this is the case, consider that all metric access methods rely on a pivot-based comparison to avoid computing some distances. This is clearly true for pivot-based methods (starting from AESA [7]), but also holds for partition-based methods (such as the Mtree [8]). For instance, the M-tree relies on information on the covering radius of a node to decide whether that node has to be accessed or not. Clearly, this information is useful as long as the covering radius is an upper-bound of the distances of objects in that node from the routing object (center) of the node, so that the triangle inequality (written in the “difference” form) can provide a lower-bound on the distances from objects in the node to the query point. Since similar issues are to be considered for both pivot-based and partition-based methods, in the following we consider the simplest case of pivot-based methods, being understood that, with suitable modifications, our observations apply to partition-based methods as well. III. P IVOT- BASED M ETHODS FOR M ETRIC F ILTERING With pivot-based methods the basic idea is to start by choosing (at random or possibly using some “smart” criterion [9]) a set of m pivots P = {p1 , p2 , . . . , pm }, P ⊆ X, and then measure and store all the distances between such pivots and the elements of the dataset X.2 When the metric d is in use, the inequality |d(q, pj ) − d(pj , xi )| > r is enough to conclude that d(q, xi ) > r, thus leading to exclude xi from the result without the need of computing d(q, xi ). Assume now a “metric filtering” scenario, where both pj and xi use their own metrics. Using the inequality |dj (q, pj ) − dj (pj , xi )| > ri one can only deduce that dj (q, xi ) > ri , but, without further assumptions, there is no way to conclude that also di (q, xi ) > ri holds. Also observe that the inequality |di (q, pj ) − di (pj , xi )| > ri ,
(1)
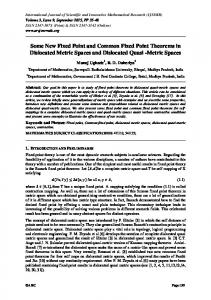
which would be the standard way to infer that di (q, xi ) > ri , cannot be used without giving up the very role of pivots. Indeed, using di (q, pj ) (rather than dj (q, pj )) to measure the distance between q and pj would require to compute the distance between q and pj for each xi , thus making pivots completely useless! Figure 1 makes explicit the reference scenario to consider. We are interested in bounding from below3 the value di (q, xi ), under the following constraints: 2 In
principle, pivots do not need to be elements of the dataset X. from above the value of di (q, xi ) can lead to conclude that q is relevant for xi if the bound is not larger than ri ; we never use such inequality in the following. 3 Bounding
dj( xi , pj ) xi
pj
di( xi , pj ) d j( q , p j )
di( xi , q ) q Figure 1.
The basic distances
1) the di metric cannot be used to compare pivot pj with query q (the basic choice is to use dj to this purpose); 2) either di (xi , pj ) or dj (xi , pj ) (or both) can be precomputed and stored. Because of the first constraint, one must at least assume that metrics di and dj are somewhat related, so that measuring dj (q, pj ) can provide some information on di (q, pj ) and, in turn, on di (q, xi ). To this end we rely on the well-known lower-bounding relationships between distance functions. In particular we consider scaled lower bounds, as introduced in [3]. Definition 1. Let di and dj be the metrics used by point xi and pivot pj , respectively. We say that di is a scaled lower bound of dj if and only if it exists a real value si,j > 0 such that ∀x, y ∈ U it is: di (x, y) ≤ si,j · dj (x, y),
(2)
which can also be concisely written as di ¹ si,j · dj . The minimum value of si,j for which the inequality holds is called the (optimal) scaling factor of dj with respect to di . In the following, only optimal scaling factors are used. In a similar way, we have that the pivot metric is a scaled lower bound of di if and only if there exists sj,i > 0 such that: dj (x, y) ≤ sj,i · di (x, y), (3) also written as dj ¹ sj,i · di . Basic properties of scaling factors are proved in the following lemma. Lemma 1. For any two metrics di and dj , if both scaling factors si,j and sj,i exist, then it is si,j · sj,i ≥ 1.
(4)
with equality being achieved if and only if dj is a rescaling of di , that is, dj (x, y) = sj,i · di (x, y), ∀x, y ∈ U (in this case, the two corresponding metric spaces are isometric). Proof: From the definition of scaling factors it is di (x, y) ≤ si,j · dj (x, y) ≤ si,j · sj,i · di (x, y), from which, after dividing by di (x, y), it is derived si,j · sj,i ≥ 1.
When dj (x, y) = sj,i · di (x, y), it is plain to see that si,j = 1/sj,i . Going the other side, if equality holds in (4) it is dj ¹ sj,i · di = di /si,j ¹ dj , from which the result follows. Example 1. Let di and dj be two weighted Euclidean metrics on R2 × R2 , respectively defined as: p di (x, y) = (x[1] − y[1])2 + 2 · (x[2] − y[2])2 p dj (x, y) = 3 · (x[1] − y[1])2 + (x[2] − y[2])2 In the case of weighted Euclidean distances, it is not difficult to show that the scaling factor si,j is given by the square root of the maximum ratio of corresponding weights w[k] of p the two metrics, that is, si,j = maxk wi [k]/wj [k] (analogously for the derivation of sj,i ). √ For our sample√distances it is therefore derived that si,j = 2 and sj,i = 3. Based on the assumption that at least one of the scaling factors si,j and sj,i exists, in the following we list the basic alternatives to generalize pivot-based methods so as to deal with the metric filtering problem. A. Computing Bounds in Pivot Spaces The first alternative we consider assumes that for each point xi and pivot pj the distance dj (pj , xi ) is precomputed and stored. Since the distance between pj and q is necessarily measured using dj , computation is indeed done only in “pivot spaces”. In this case there are two basic strategies that can be used to prune point xi . Triangle inequality in pivot space. Assume that dj ¹ sj,i · di . Then: |dj (q, pj ) − dj (pj , xi )| > ri (5) sj,i is a sufficient condition to guarantee that xi can be pruned. Indeed, from (3) and (5) it is derived di (q, xi ) ≥ dj (q, xi )/sj,i ≥ |dj (q, pj ) − dj (pj , xi )|/sj,i > ri . Using both scaling factors. When both scaling factors are defined, the following inequality could also be used to prune xi : dj (q, pj ) − si,j · dj (pj , xi ) > ri (6) sj,i Correctness is easily proved, since it is di (q, xi ) ≥ di (q, pj ) − di (pj , xi ) ≥ dj (q, pj )/sj,i − di (pj , xi ) ≥ dj (q, pj )/sj,i −si,j ·dj (pj , xi ) > ri . However, let us consider the “positive form” of (5), that is dj (q, pj ) dj (pj , xi ) − > ri . (7) sj,i sj,i We can exploit Lemma 1 to immediately conclude that si,j · dj (pj , xi ) ≥ dj (pj , xi )/sj,i , since si,j ≥ 1/sj,i . This means that (7) will always yield a better (higher) lower bound to di (q, xi ) than (6). In logical terms this is also to say that (6) implies (7), written (6) =⇒ (7).4 4 Note
that a lower-bounding inequality Iuseful is useful as long as there is no other inequality Iother such that Iuseful =⇒ Iother .
Similar arguments can be applied if one exchanges the roles of dj (q, pj ) and dj (pj , xi ), thus using the inequality dj (pj , xi ) − si,j · dj (q, pj ) > ri , sj,i
(8)
and compares it against the “negative form” of (5), that is dj (pj , xi ) dj (q, pj ) − > ri . sj,i sj,i
(9)
Again, due to Lemma 1 it is si,j · dj (q, pj ) ≥ dj (q, pj )/sj,i , thus (8) =⇒ (9). In conclusion, we see that the strategy that uses both scaling factors is never convenient. B. Computing Bounds in Point Spaces In the above-described approaches precomputed distances between points and pivots are measured using the pivots’ metrics. The other alternative to consider, aiming to possibly derive more accurate bounds, is to make use of di (pj , xi ) in place of dj (pj , xi ) (remind that the distance between q and pj is necessarily measured using dj ). Large pivot-point distance. Consider (1): since di (q, pj ) ≤ si,j · dj (q, pj ), we can use the inequality di (pj , xi ) − si,j · dj (q, pj ) > ri
(10)
to prune point xi . Small pivot-point distance. When point xi is “close” to pivot pj the triangle inequality in point space can also be used to prove that dj (q, pj ) − di (pj , xi ) > ri sj,i
(11)
is a valid pruning condition. This follows from the inequalities di (q, xi ) ≥ di (q, pj ) − di (pj , xi ) ≥ dj (q, pj )/sj,i − di (pj , xi ). However this approach is not effective at all, when compared to the (higher) lower bound provided by (7), since (11) =⇒ (7). This easily follows from the observation that di (pj , xi ) ≥ dj (pj , xi )/sj,i . Before proceeding it is useful to summarize the results obtained so far. These are as follows: 1) The scaling factor si,j , as defined in (2), is not useful at all to bound the search space if we are working only in “pivot space”, whereas it can be exploited through (10) if we also work in “point space”. 2) Among the several possible conditions that can be tested to prune xi , only three of them are nonredundant, namely: dj (q, pj ) dj (pj , xi ) − > ri , sj,i sj,i dj (pj , xi ) dj (q, pj ) − > ri , sj,i sj,i di (pj , xi ) − si,j · dj (q, pj ) > ri .
(7) (9) (10)
The strategy that uses all above inequalities (which we call ∆-both) has to pay for an increased storage overhead and preprocessing time, since both dj (pj , xi ) and di (pj , xi ) have to be used. We will experimentally investigate under which conditions, depending on the distance(s) between pj and xi , it is convenient to trade off space for bounds accuracy by storing only one of these two distances. In this case, we can either use tests (7) and (9) (∆-pivot strategy) or the combination of (10) and the otherwise redundant (11) (∆point strategy). IV. B EYOND C ORRECTNESS : T HE S YMMETRIC S CALING FACTOR In order to characterize not only the correctness but also the performance of metric filtering, it is important to properly understand how the use of a specific lowerbounding inequality (among those introduced in the previous section) can impact search costs. To this end, in this section we provide basic results aiming to shed more light on the role that scaling factors play from a performance point of view. We start with the following preliminary observations: 1) Just considering the scaling factor sj,i (or si,j ) says nothing about “how well” dj approximates di . This is also to say that the magnitude of sj,i (si,j ) does not matter at all. 2) As demonstrated by Lemma 4, when si,j · sj,i = 1 we have an “ideal” situation in that dj , albeit different from di , equals di up to a scaling factor. 3) The bound(s) provided by approximate distances can be even higher (thus better) than the bound(s) obtainable from (1). The last point is quite surprising, since it tells us that there are cases where scaled bounds are more effective than “natural” bounds, as the following example demonstrates. Example 2. Let di and dj be the two weighted Euclidean metrics defined in Example 1. Let xi = (7, 5), pj = (7, 8), and q = (3, 5), from which it is derived di (q, xi ) = p (3 − 7)2 + 2 · (5 − 5)2 = 4. The “natural” bound yielded by (1) would be √ √ di (q, xi ) ≥ |di (q, pj ) − di (pj , xi )| = | 34 − 18| ≈ 1.588.
On the other hand, the bound computed using (7) is dj (q, pj ) − dj (pj , xi ) = di (q, xi ) ≥ sj,i
√
57 − √ 3
√
9
≈ 2.626.
Assuming a personal radius ri = 2, it is evident that using the pivot’s metric could lead to discard xi , whereas this would not be the case if pruning were based on the classical triangle inequality. Based on above observations, we introduce the symmetric scaling factor (SSF for short) of di and dj , defined as S(i, j) = si,j · sj,i , as a synthetic yet effective way to characterize the relationship between di and dj metrics. SSF
can be given a simple interpretation, which is formalized by the next lemma and illustrated in the following example. Lemma 2. It is sup {di (x, y)|dj (x, y) = sj,i } ≤ S(i, j), U
sup {dj (x, y)|di (x, y) = si,j } ≤ S(i, j). U
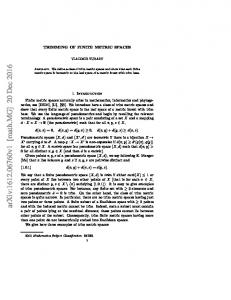
Proof: Immediate from the definition of scaling factors and of SSF. Example 3. Let di and dj be the two weighted √ Euclidean metrics defined in Example 1. Since s = 2 and sj,i = i,j √ √ 3, it is S(i, j) = 6. Consider now the √ set of points Yi = {y ∈ U : di (x, y) ≤ 1}. Since sj,i = 3, we have √ that for all y ∈ Y√ 3, i it is also guaranteed dj (x, y) ≤ because dj (x, y)/ 3 ≤ 1 holds. In geometrical terms, the Yi ellipsoid centered in x with equation di (x, y) ≤ 1 is contained √ in the co-centric ellipsoid Yj with equation dj (x, y) ≤ 3 (see Figure 2). Consider now a point on the surface of Yj and measure its distance from x using di . According to Lemma 2,√this distance cannot exceed the value of the SSF, S(i, j) = 6.5 Intuitively, the higher the value of S(i, j), the worse Yj (dj ) approximates Yi (di ).
di(x,y)≤√6 Yj: dj(x,y)≤√3 x Yi: di(x,y)≤1
Figure 2.
The effect of scaling factors and of
SSF .
We can generalize the observations in the above example as follows. When dj is scaled so as to become a lower bound of di (dj /sj,i ¹ di ), if S(i, j) > 1 then such scaling leads to define the (normalized) non-empty region: R(x) = {y|di (x, y) − dj (x, y)/sj,i > 0, dj (x, y) = sj,i } = {y|di (x, y) > 1, dj (x, y) = sj,i } Within this region we have all points for which the bound provided by dj (x, y)/sj,i is not accurate, and Lemma 2 simply says that sup {di (x, y)|y ∈ R(x)} ≤ S(i, j). 5 In
the example √ the (x[1], x[2] ± 3).
√ 6 bound is achieved if one takes the points y ≡
Therefore, the SSF of di and dj tells us how much, in the worst case, we “relax” di by approximating it with dj . It has to be observed that the result does not depend on the specific reference point x and that it also holds when the roles of di and dj are reversed (since S(i, j) = S(j, i)). The basic properties of SSFs are as follows: S(i, j) ≥ 1, S(i, j) = 1 ⇐⇒ di is a rescaling of dj , S(i, j) = S(j, i), S(i, k) ≤ S(i, j) · S(j, k), where the last inequality easily derives from the definition of scaling factors. For any two metric distances di and dj , log S(i, j) is therefore a pseudo-metric among them. A. Analyzing Lower-Bounding Inequalities We come now to consider things from a more pragmatical point of view, that is: what is the effect on performance when we bound from below the value of di (q, xi ) using one of the inequalities introduced in Section III? In particular we consider, for each lower-bounding expression, its relationship with the “natural” bound provided by (1). A. Consider the expression in (7). From the definition of scaling factor and of SSF it is derived: di (q, pj ) dj (q, pj ) dj (pj , xi ) − di (pj , xi ) ≤ − S(i, j) sj,i sj,i di (pj , xi ) ≤ di (q, pj ) − . S(i, j)
(12)
B. For the expression in (9) it is similarly derived: dj (pj , xi ) dj (q, pj ) di (pj , xi ) − di (q, pj ) ≤ − S(i, j) sj,i sj,i di (q, pj ) ≤ di (pj , xi ) − . S(i, j)
(13)
limit of C is S(i, j) times higher than that of B. In other terms, considering both extremes of B and C, we can say that B is “more aggressive” than C. V. E XPERIMENTAL E VALUATION We implemented the three pruning strategies proposed in Section III and tested them over some synthetic datasets. The use of synthetic, rather than real, datasets is motivated by the fact that in our experiments we need not only a set of data points, but also a corresponding distance for each point. We therefore generated three different 3D datasets in the [0, 1]3 cube, using a weighted Euclidean distance; data (and query) points and distance weights were produced as follows: uni Points and weights are uniformly distributed in the unit hypercube. clust Points follow a Gaussian distribution (with σ 2 = 0.1) around 5 centers that are uniformly distributed in the unit hypercube; weights are also uniformly distributed. rw (random walk) A single point is randomly chosen in the unit hypercube; following points are created by slightly perturbing (0.01 of maximum amount) the coordinates of the previous point; weights are created in a similar fashion. While the first two datasets are commonly used as yardsticks for measuring performances of spatial/metric structures, the latter has been considered so as to investigate a situation where close objects have similar distances, which appears to be a reasonable assumption (see Figure 3). Finally, for each dataset, the personal radii, ri , were chosen so that each point selects around 3% of incoming queries.
C. The expression in (10) admits the following bounds in point space: di (pj , xi ) − S(i, j) · di (q, pj ) ≤ di (pj , xi ) − si,j · dj (q, pj ) ≤ di (pj , xi ) − di (q, pj ).
x1
x3
x6
(14) x2
D. Finally, for the expression in (11) it is: di (q, pj ) dj (q, pj ) − di (pj , xi ) ≤ − di (pj , xi ) S(i, j) sj,i ≤ di (q, pj ) − di (pj , xi ).
x5
x7
x4
(15)
Comparing above limit cases with the triangle inequality in point space, it is clear that: • Only cases A and B, which only work in pivot space, can provide better lower bounds than the triangle inequality in point space. On the other hand, in the most favorable situation C and D can only provide a bound equal to the one obtainable from the triangle inequality in point space. • Case C has the advantage, with respect to case B, of enjoying a most favorable worst case, since the lower
Figure 3. metrics.
In the rw dataset, objects close in the space adopt similar
We used a number of pivots in the range [25, 150]: pivots were chosen so as to maximize the distance among them, according to the outliers selection technique [9]. We are mainly interested in evaluating the performance of the proposed strategies in terms of two basic objective measures [1]: • Internal complexity: This measure accounts for the effort (in terms of distance computations) needed by the index structure to compute the set of candidate results,
i.e., those objects that may be part of the result, but need to be exactly checked using their respective distance functions. In our case, the internal complexity always coincides with the number of pivots used. • External complexity: This is the cost needed for filtering the set of candidate results, i.e., the number of distances that have to be computed to check whether candidate objects belong to the result or are just false positives. The alternatives that will be contrasted are listed in Table I (the ∆ strategy, being based on (1), cannot be used with pivots and is only included as a reference yardstick for external complexity). Strategy name ∆ ∆-pivot ∆-point ∆-both
Used inequalities (1) (7) and (9) (10) and (11) (7), (9), and (10)
Table I P RUNING STRATEGIES USED IN THE EXPERIMENTS .
Graphs in Figure 4 and 5 respectively show the external and the total (internal+external) complexity of the three filtering strategies; measures are normalized to the total number of points (30K for all 3 datasets) so as to show the speed-up over a simple sequential scan. As expected, the ∆-both strategy always attains the best performance, in many cases very close to the ∆ strategy. Comparing the ∆pivot and the ∆-point strategies, the latter strategy is rarely better than the former (as expected, since (11) is never more effective than (7)). Remarkably, all strategies attain very good performance on all considered datasets, never requiring to test more than 10% of the data points. As already observed in Section IV-A, inequalities in pivot spaces (cases A and B) can provide bounds that are better than “natural” ones obtained by way of (1). In our experiments, this happened in 40% of the cases for the uni dataset, in 35% for clust, and in 20% for rw. The optimal number of pivots (m) can be observed in Figure 5 and ranges between 100 and 150 for the most efficient ∆-both strategy. Clearly, the dataset cardinality n has an influence on the value of m, with m increasing for increasing values of n [9]. This is confirmed by graphs in Figure 6, where we plot the total complexity of the ∆-both strategy when both m and n are varied: for low values of n, the optimal number of pivots is low, while increasing the number of data objects (up to 100K for all the datasets) leads to increasing optimal values. A. Optimizing Performances In this section we investigate two optimizations aiming to reduce the time complexity of the pivot-based techniques proposed for metric filtering. In particular, we consider how
the order according to which pivots are accessed for each data point can be modified so as to discard non-candidate objects as early as possible, i.e., visiting the least number of pivots. Clearly, this has no effect on the number of distances to be computed to assess whether a new object is relevant for a data object or not, but might reduce the number of comparisons for each data object. The first heuristics we propose is to order pivots according to their distance to the query point, i.e., for increasing values of dj (q, pj ). This is based on the assumption that a pivot close to q is likely to have a higher pruning power with respect to a pivot which is far from q. The cost for this optimization is rather low, since it does not require any additional information and its complexity is O(m log m). Our second strategy exploits the distribution of distances [10] for each of the m pivots to estimate the pruning probability of each pivot. Pivots are then sorted for decreasing values of such probability, so that pivots that are most likely to prune a data point are accessed first. To show how the pruning probability of a pivot can be computed, let us consider strategies working in pivot spaces, i.e., ∆-pivot and ∆-both, and a data point xi . From (7) and (9), it follows that xi cannot be pruned by pj iff dj (pj , xi ) ∈ [dj (q, pj ) − sj,i · ri , dj (q, pj ) + sj,i · ri ]. If Fj (t) is the distance distribution for pivot pj , i.e., Fj (t) = P rob{dj (pj , x) ≤ t}, x ∈ U , and fj (t) is its corresponding density function, fj (t) = dFj (t)/dt (see Figure 7), then the probability P Pi,j that xi is pruned by pj is given by: P Pi,j = 1 − (Fj (dj (q, pj ) − sj,i ri ) − Fj (dj (q, pj ) + sj,i ri )) Z dj (q,pj )+sj,i ·ri =1− fj (t) dt dj (q,pj )−sj,i ·ri
(16)
fj
2 rj
dj( pj , q)
dj( pj , xi)
Figure 7. How the pruning power of a pivot pj can be estimated using the density distribution of distances.
Ordering pivots for decreasing values of P Pi,j would require computing (16) and sorting pivots for each point xi in the dataset. A simple heuristics that allows to keep manageable costs is to sort pivots only once, by using an
pivot
7%
point
6%
both
5% 4% 3% 2%
10% 9% 8% 7% 6% 5% 4% 3% 2% 1% 0%
1% 0% 0
50
# of pivots
100
150
both
6% 5% 4% pivot
0% 0
50
# of pivots
100
50
150 10000 dataset cardinality
100000
# of pivots
100
150
100
150
6% 5% 4% pivot
3%
point
2% 1%
both
both
0% 50
# of pivots
100
0
150
50
# of pivots
rw
total distances
10% 9% 8% 7% 6% 5% 4% 3% 2% 1% 0%
25 100 150 10000 dataset cardinality
100000
10% 9% 8% 7% 6% 5% 4% 3% 2% 1% 0%
25 100 150
1000
10000 dataset cardinality
clust
100000
rw
Total complexity for the three datasets: varying data cardinality, different number of pivots, ∆-both pruning strategy. 16%
12%
14%
no-opt
PP
12%
PP
12%
QD
10% 8% 6%
8% 6%
4%
4%
2%
2%
0%
0% # of pivots
100
150
PP
QD
10%
no-opt
10%
tested pivots
no-opt
14%
tested pivots
16%
8%
QD
6% 4% 2% 0%
0
50
uni Figure 8.
50
rw
point
1000
18%
50
both 0
150
pivot
0
total distances
total distances
100
7%
uni
tested pivots
# of pivots
Total complexity for the three datasets: varying number of pivots, different pruning strategies.
100
0
point
8%
10% 9% 8% 7% 6% 5% 4% 3% 2% 1% 0%
150
25
Figure 6.
pivot
2%
clust
Figure 5.
1000
delta
3%
0%
uni
10% 9% 8% 7% 6% 5% 4% 3% 2% 1% 0%
4%
total distances
total distances
total distances
7%
both
5%
External complexity for the three datasets: varying number of pivots, different pruning strategies.
8%
1%
6%
1% 0
9%
point
7%
clust
Figure 4.
2%
8%
pivot point
uni
3%
delta
external distances
delta
8%
external distances
external distances
9%
# of pivots
clust
100
150
0
50
# of pivots
100
150
rw
Fraction of tested pivots for the three datasets: varying number of pivots, ∆-both pruning strategy, different optimizations.
average effective radius rj for each pivot, computed as rj =
1 n
n X
sj,i · ri
(17)
i=1
Then, substituting (17) into (16), we obtain the pruning power of pivot pj , P Pj , as P Pj = 1 − (Fj (dj (q, pj ) − rj ) − Fj (dj (q, pj ) + rj )) Z dj (q,pj )+rj fj (t) dt =1− dj (q,pj )−r j
Figure 8 shows the effect of the two optimizations on the ∆-both strategy for all the considered datasets (with 3K
data points), computed as the fraction of pivots that have to be checked for each non-candidate point (candidate points necessarily test 100% of the pivots). Clearly, having more pivots leads to a better utilization of them, i.e., increase in the total number of comparisons is sublinear in the number of pivots. Moreover, we see that the optimization based on the distribution of distances (denoted PP in the graphs) is the one that attains the lowest number of comparisons (up to a 23.9% saving over the non-optimized ∆-both strategy for the uni dataset); only for the rw dataset the optimization based on the query distance (QD in the graphs) obtains better performance. This, however, was expected since in
the rw dataset close objects have also similar distances, thus favoring the QD strategy. On the other hand, the rw dataset is the one where the non-optimized strategy achieves the better performance, thus the saving obtainable by optimizations is limited with respect to other scenarios, reaching only 16% when using the QD optimization with 25 pivots. VI. C ONCLUSIONS We have introduced the novel problem of metric filtering, whose main difference from the traditional problem of searching in metric spaces is the fact that every data point carries its own personal distance to measure dissimilarity with queries. To speed up query resolution over the simple sequential scan of the data points, we presented three different strategies to be applied to pivot-based access methods. Preliminary experimental results show that the proposed strategies are effective in reducing query processing costs: a more thorough study of performance is however needed. We believe that our results will be helpful in several cases of recommendation systems, where user profiles are used to suggest new items to users, according to a similarity criterion that takes into account the items each user has visited/bought in the past. Along this direction, another issue that is interesting to analyze is whether further optimizations could be devised in the case where multiple queries are submitted in a batch, which is the most common case in information filtering. R EFERENCES [1] E. Ch´avez, G. Navarro, R. Baeza-Yates, and J. L. Marroqu´ın, “Proximity searching in metric spaces,” ACM Computing Surveys, vol. 33, no. 3, pp. 273–321, Sep. 2001. [2] E. Ch´avez and G. Navarro, Eds., Proceedings of the First International Workshop on Similarity Search and Applications (SISAP 2008). Canc´un, Mexico: IEEE Computer Society, Apr. 2008.
[3] P. Ciaccia and M. Patella, “Searching in metric spaces with user-defined and approximate distances,” ACM Transactions on Database Systems, vol. 27, no. 4, pp. 398–437, Dec. 2002. [4] U. C¸etintemel, M. J. Franklin, and C. L. Giles, “Self-adaptive user profiles for large-scale data delivery,” in Proceedings of the 16th International Conference on Data Engineering (ICDE 2000). San Diego, CA: IEEE Computer Society, Mar. 2000, pp. 622–633. [5] G. Salton, Automatic Text Processing: The Transformation, Analysis, and Retrieval of Information by Computer. Reading, MA: Addison-Wesley, 1989. [6] I. Bartolini, P. Ciaccia, and F. Waas, “FeedbackBypass: A new approach to interactive similarity query processing,” in Proceedings of the 27th International Conference on Very Large Data Bases (VLDB 2001). Rome, Italy: Morgan Kaufmann, Sep. 2001, pp. 201–210. [7] E. Vidal, “An algorithm for finding nearest neighbours in (approximately) constant average time,” Pattern Recognition Letters, vol. 4, no. 3, pp. 145–157, 1986. [8] P. Ciaccia, M. Patella, and P. Zezula, “M-tree: An efficient access method for similarity search in metric spaces,” in Proceedings of the 23rd International Conference on Very Large Data Bases (VLDB’97). Athens, Greece: Morgan Kaufmann, Aug. 1997, pp. 426–435. [9] B. Bustos, G. Navarro, and E. Ch´avez, “Pivot selection techniques for proximity searching in metric spaces,” Pattern Recognition Letters, vol. 24, no. 14, pp. 2357–2366, Jan. 2003. [10] P. Ciaccia, M. Patella, and P. Zezula, “A cost model for similarity queries in metric spaces,” in Proceedings of the 16th ACM SIGACT-SIGMOD-SIGART Symposium on Principles of Database Systems (PODS’98). Seattle, WA: ACM Press, Jun. 1998, pp. 59–68.