Printer Identification Based on Texture Features Aravind K. Mikkilineni, Pei-Ju Chiang, Gazi N. Ali George T.-C. Chiu, Jan P. Allebach, Edward J. Delp Purdue University West Lafayette, Indiana, USA Abstract In today’s digital world securing different forms of content is very important in terms of protecting copyright and verifying authenticity. Many techniques have been developed to protect audio, video, digital documents, images, and programs (executable code). One example is watermarking of digital audio and images. We believe that a similar type of protection for printed documents is very important. In this paper we describe the use of image texture analysis to identify the printer used to print a document. In particular we will describe a set of features that can be used to provide forensic information about a document. We will demonstrate our methods using 10 EP printers. This research was supported by a grant from the National Science Foundation, under Award Number 0219893. Address all correspondence to E. J. Delp at
[email protected]
Introduction In today’s digital world securing different forms of content is very important in terms of protecting copyright and verifying authenticity.[1, 2, 3] One example is watermarking of digital audio and images. We believe that a marking scheme analogous to digital watermarking but for documents is very important.[4] Printed material is a direct accessory to many criminal and terrorist acts. Examples include forgery or alteration of documents used for purposes of identity, security, or recording transactions. In addition, printed material may be used in the course of conducting illicit or terrorist activities. Examples include instruction manuals, team rosters, meeting notes, and correspondence. In both cases, the ability to identify the device or type of device used to print the material in question would provide a valuable aid for law enforcement and intelligence agencies. We also believe that average users need to be able to print secure documents, for example boarding passes and bank transactions. There currently exist techniques to secure documents such as bank notes using paper watermarks, security fibers,
holograms, or special inks.[5, 6] The problem is that the use of these security techniques can be cost prohibitive. Most of these techniques either require special equipment to embed the security features, or are simply too expensive for an average consumer. Additionally, there are a number of applications in which it is desirable to be able to identify the technology, manufacturer, model, or even specific unit that was used to print a given document. We propose to develop two strategies for printer identification based on examining a printed document. The first strategy is passive. It involves characterizing the printer by finding intrinsic features in the printed document that are characteristic of that particular printer, model, or manufacturer’s products. We shall refer to this as the intrinsic signature. The intrinsic signature requires an understanding and modelling of the printer mechanism, and the development of analysis tools for the detection of the signature in a printed page with arbitrary content. The second strategy is active. We embed an extrinsic signature in a printed page. This signature is generated by modulating the process parameters in the printer mechanism to encode identifying information such as the printer serial number and date of printing. To detect the extrinsic signature we use the tools developed for intrinsic signature detection. We have successfully been able to embed information into a document with electrophotographic (EP) printers by modulating an intrinsic feature known as “banding”. This work in is discussed in [7]. We have previously reported techniques that use the print quality defect known as banding in electrophotographic (EP) printers as an intrinsic signature to identify the model and manufacturer of the printer.[8, 9, 10] We showed that different printers have different sets of banding frequencies which are dependent upon brand and model. This feature is relatively easy to estimate from documents with large midtone regions. However, it is difficult to estimate the banding frequencies from text. The reason for this is that the banding feature is present in only the process direction and in printed areas. The text acts as a high energy noise source upon which the low energy banding signal is added. One solution is to find a feature or set of features which
Unknown Document
Variance/ Entropy Extract
Extract
Characters
Features
5NN Classifier GLCM
Individual Characters
Features Majority 1 Feature Vector per Character
Vote
Output Class
Manufacturer Brother HP Lexmark HP HP HP HP Minolta Okidata Samsung
Model hl1440 lj4050 e320 lj1000 lj1200 lj5M lj6MP 1250W 14e ml1430
DPI 1200 600 1200 600 600 600 600 1200 600 600
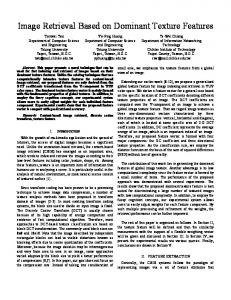
Figure 1: System diagram of printer identification scheme
Table 1: Printers used for classification.
can be measured over smaller regions of the document such as individual text characters. If the banding signal is modelled as a texture in the printed areas of the document then texture features can be used to classify the document. These types of features can be more easily measured over small areas such as inside a text character.
majority vote is performed on the resulting classifications from the 5NN classifier.
System Overview Figure 1 shows the block diagram of our printer identification scheme. Given a document with an unknown source, referred to as the unknown document, we want to be able to identify the printer that created it. For our test purposes we will use our Forensic Monkey Text Generator (FMTG) described in [8] to create random documents with known statistics to be classified. The first step is to scan the document at 2400 dpi with 8 bits/pixel (grayscale). Next all the letter “e”s in the document are extracted. The reason for this is that “e” is the most frequently occurring character in the English language. A set of features are extracted from each character forming a feature vector for each letter “e” in the document. Each feature vector is then classified individually using a 5-Nearest-Neighbor (5NN) classifier as described in [11]. The 5NN classifier is trained with 5000 known feature vectors. The training set is made up of 500 feature vectors from each of 10 printers listed in Table 1. Each of these feature vectors are independent of one another. To classify an unknown feature vector X, the euclidean distances between X and all the known feature vectors are obtained. A majority vote among the 5 smallest distances provides the classification result. Let Ψ be the set of all printers {α1 , α2 , · · · , αn } (in our work these are the 10 printers shown in Table 1). For any φǫΨ, let c(φ) be the number of “e”s classified as being printed by printer φ. The final classification is decided by choosing φ such that c(φ) is maximum. In other words, a
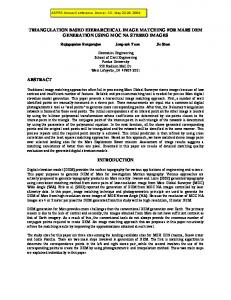
Graylevel Co-Occurrence Texture Features We want to be able to determine a set of features that can be used to describe each printer uniquely by observing an example of the output of the printer. We will treat the output scanned document as an “image” and use image analysis tools to determine the features that characterize the printer. We will accomplish this by extracting features from individual printed characters, in particular an “e”. Each character is very small, about 180x160 pixels and is non-convex, so it is difficult to perform any meaningful filtering operations in either the pixel or transform domain if we are interested only in the printed region of each character. The banding phenomenon introduces a periodic graylevel fluctuation in the printed character in the process direction. These variations can be modelled as textures in the character.[12] To model the texture we used graylevel co-occurrence texture features as described in [12, 13] as well as two pixel based features. Graylevel co-occurrence texture features assume that the texture information in an image is contained in the overall spatial relationships among the pixels in the image.[12] This is done by first determining the Graylevel Co-occurrence Matrix (GLCM). This is an estimate of the second order probability density function of the pixels in the image. The features are then statistics obtained from the GLCM. We assume that the texture in a document is predominantly in the process direction due to the banding signal. Figure 2 shows an idealized character, Img(i, j), from which features are extracted. The region of interest (ROI) is the set of all pixels within the printed area of the character. The determination of this region involves morphological filtering and is discussed in [8].
j
1
W
pglcm (n, m) =
ROI
1
1 Rglcm
glcm(n, m)
(4)
Twenty features are obtained from the GLCM. The first four are the marginal means and variances defined by Equations 7-10 which are estimated from the marginal probability densities defined by Equations 5 and 6.
i
pr (n) =
255 X
pglcm (n, m)
(5)
pglcm (n, m)
(6)
m=0
H pc (n) =
Img(i,j)
255 X m=0
Figure 2: Idealized character
255 X
µr = We define the number of pixels in the ROI to be X R= 1.
(7)
pc (m)
(8)
n2 pr (n) − µ2r
(9)
m2 pc (m) − µ2c
(10)
255 X
µc =
(1)
(i,j)ǫROI
m=0
We then estimate the Gray-Level Co-occurrence Matrix (GLCM). This matrix, defined in Equation 2, has entries glcm(n, m) which are equal to the number of occurrences of pixels with graylevels n and m respectively with a separation of (dr,dc) pixels (see Figure 3). The number of pixels over which this estimate is obtained is given by Equation 3. If the GLCM is normalized with respect to Rglcm , its entries then represent the probability of occurrence of pixel pairs with graylevels n and m with separation (dr,dc). We will choose dc = 0 and vary dr between 1 and 10 since we believe the textural variation is only in the process direction. Img(i,j)=n
pr (n)
n=0
σr2 =
255 X n=0
σc2
255 X
=
m=0
The next seven features are the energy of the normalized GLCM, three entropy measurements, the maximum entry in the GLCM, and two correlation metrics. These are defined by Equations 11- 17. Energy =
Img(i+dr,j+dc)=m
255 255 X X
p2glcm (n, m)
(11)
n=0 m=0
dc
hxy1 = −
255 255 X X
pglcm (n, m) log2 (pr (n)pc (m)) (12)
n=0 m=0
dr
hxy2 = −
255 255 X X
pr (n)pc (m) log2 (pr (n)pc (m)) (13)
n=0 m=0
Figure 3: Generation of glcm(n, m)
hglcm = −
255 255 X X
pglcm (n, m) log2 pglcm (n, m) (14)
n=0 m=0
X
glcm(n, m) =
1{Img(i,j)=n,Img(i+dr,j+dc)=m}
M axP rob = max{pglcm (n, m)} n,m
(i,j),(i+dr,j+dc)ǫROI
(15)
(2) Rglcm =
X (i,j),(i+dr,j+dc)ǫROI
1
(3)
ρnm =
255 255 X X (n − µr )(m − µc)pglcm (n, m) σr σc n=0 m=0
(16)
diagcorr =
255 255 X X
|n−m|(n+m−µr −µc )pglcm (n, m)
n=0 m=0
(17) Four features, Equations 19- 22, are obtained from the difference histogram defined by Equation 18. They are the energy, entropy, inertia, and local homogeneity of D(k) respectively. X D(k) = pglcm (n, m) (18) 0≤n≤255 0≤m≤255 |n−m|=k 255 X
Denergy =
hD = −
D(k)
D(k) log2 D(k)
k 2 D(k)
(21)
(22)
The last five features, Equations 25- 29, are obtained from the sum histogram defined by Equation 23. They are the energy, entropy, variance, cluster shade, and cluster prominence of S(k) respectively. X S(k) = pglcm (n, m) (23) 0≤n≤255 0≤m≤255 n+m=k 510 X
kS(k)
(24)
510 X
(25)
k=0
Senergy =
S(k)
k=0
S(k) log2 S(k)
(26)
k=0
σS2 =
510 X
(k − µS )2 S(k)
(27)
k=0
AD =
510 X (k − µr − µc )3 S(k)
3
k=0
BD =
(σr2 − σc2 + 2rσr σc ) 2
510 X k − µr − µc )4 S(k) (σr2 − σc2 + 2rσr σc )2
k=0
(30)
(Img(i, j) − µImg )2
(31)
(i,j)ǫROI
X
1 R
1{Img(i,j)=α}
(32)
pImg (α) log2 pImg (α)
(33)
(i,j)ǫROI
255 X
Results
255 X D(k) 1 + k2
510 X
Img(i, j)
(i,j)ǫROI
(20)
k=0
hS = −
X
X
hImg = −
k=0
µS =
1 R
1 R
α=0
255 X
hD =
2 σImg =
(19)
k=0
ID =
µImg =
pImg (α) =
k=0 255 X
In addition to the 20 graylevel features above, two simple features are also included and defined in Equations 31 and 33. These are the variance and entropy of the pixel values in the ROI.
(28)
(29)
Using our FMTG, we estimated that in a page of English text printed at 12 point font there are on average 458 “e”s per page. For a 10 point font there are on average 630 “e”s per page. To test our classification technique we use a test document containing 300 “e”s. This document is printed on each of our test printers and scanned at 2400dpi. Each scanned document is then classified using values of dr between 1 and 10, providing 10 classification results for each document. Using all 22 features described above, we find that the dr which provides the best classification results is dr = 5. The classification matrix for this choice of dr is shown in Figure 6. Each entry of the matrix is the number of “e”s out of the 300 in the test document which were classified as the printer listed at the heading of its column. For example, examining the first row we see that 197 “e”s, printed from the Brother HL-1440 were classified correctly. The second highest number of “e”s were classified as being printed by the Minolta 1250W. A majority vote indicates that this document was most likely printed by the HL-1440, which is correct. Again let c(φ) be equal to the number of “e”s from any one unknown document classified as being printed by printer φ. Furthermore let c(φ1 ) be the greatest among all classes, and c(φ2 ) be the second greatest. Then we say that the final classification resulting from the majority vote among the c(φ) has a higher confidence if the ratio between c(φ1 ) and c(φ2 ) is larger. In this case, all the printers are classified correctly and with a relatively high confidence with the exception of the Okidata 14e, which is classified as being a Minolta 1250W. The classification is repeated using 4 manually chosen 2 features. These features are σImg , hImg , µr , and Energy.
Scatter plots of these features which show good separation between all ten printes are shown in Figures 4 and 5. The HP LaserJet 4050 is a higher quality printer compared to the others in our test set, and the graylevel variance of its output is very low, moving all of its data points to the far left of Figure 4 off the graph. 2 Img
σ 3.2
vs. h
Img
for 10 printers. dr=1
hl1440 lj4050 e320 lj1000 lj1200 lj5M lj6MP 1250W 14e ml1430
3.1
3
Conclusion Printer identification using graylevel co-occurence texture features shows promising results. Although in Figure 6 we demonstrated good results, we would like to go further and reduce the number of features needed. Clearly this is possible given the results in Figure 7 using only 4 of the 22 original features. Our preliminary results indicate that some of the features may be redundant. Further work needs to be done in constructing an optimal feature set. It is important to note that the technique presented requires that prior information about the printers in question be known. If the unknown document was printed by a printer which is not included in the classifier training data set, then it will be mistakenly classified as one of the known printers. It will also be important to extend this technique to work with multiple font sizes, font types, and also different characters. Using our current system to classify a document using all the characters contained in it, not just “e”s, would require a separate 5NN classifier block for each character. This increases the complexity of the classifier. Ideally we would like a subset of features, or techniques for estimating the GLCM which are character independent. The same holds true for different font sizes and font types.
hImg
2.9
2.8
2.7
2.6
2.5
2.4 6000
6500
7000
7500
8000
2 Img
σ
2 Figure 4: σImg vs hImg
µ vs. Energy for 10 printers. dr=1
−3
10
r
x 10
hl1440 lj4050 e320 lj1000 lj1200 lj5M lj6MP 1250W 14e ml1430
9
8
7 Energy
The reason is that the confidence in the classification results using 4 features is in general lower than when using all the features. For example, the ratio between c(φ1 ) and c(φ2 ) for the Minolta 1250W when using 22 features is 3.69, while in the 4 feature case it is only 1.06. Similarly the HP LaserJet 6MP, Minolta 1250W, and Okidata 14e all have lower confidence in their classification results despite the fact that they are classified correctly when using only 4 features.
6
5
References
4
3
2 65
70
75
µr
80
85
90
Figure 5: µr vs Energy
Using these four features, we find that dr = 9 provides the best classification results which are shown in Figure 7. All the printers are classified correctly with the exception of the HP LaserJet 1200 which is classified as being an HP LaserJet 1000. This is reasonable since these two printers we believe use the same print engine. We can not say that the results obtained using 4 features are the same or better than when using all 22 features.
1. Mauro Barni, Christine I. Podilchuk, Franco Bartolini and Edward J. Delp, Watermark embedding: hiding a signal within a cover image, IEEE Communications Magazine, 39, 102 (2001). 2. R. W. Wolfgang, C. I. Podilchuk and E. J. Delp, Perceptual watermarks for digital images and video, in Proceedings of the IEEE, pp. 1108–1126 (1999). 3. C. I. Podilchuk and E. J. Delp, Digital watermarking: Algorithms and applications, IEEE Signal Processing Magazine, 18, 33 (2001). 4. Edward J. Delp, Is your document safe: An overview of document and print security, in Proceedings of the IS&T’s NIP18: International Conference on Digital Printing Technologies (2002). 5. Rudolf L. van Renesse, Paper based document security - a review, IEE European Conference on Security and Detection, 51, 75 (1997). 6. Rudolf L. Renesse, Optical Document Security, Artech House, Boston, MA (1998).
In\Out hl1440 lj4050 e320 lj1000 lj1200 lj5M lj6MP 1250W 14e ml1430
hl1440 lj4050 e320 lj1000 lj1200 lj5M lj6MP 1250W 14e ml1430 Majority Vote 0 1 1 0 11 6 21 6 hl1440 197 57 0 0 0 0 0 0 0 0 0 lj4050 300 0 0 0 2 0 0 13 1 e320 248 36 5 11 7 4 51 lj1000 4 0 0 152 66 3 0 0 14 11 13 1 29 lj1200 130 99 0 1 1 7 29 30 5 2 lj5M 165 60 0 14 11 6 28 29 9 20 lj6MP 153 30 33 0 2 1 7 4 20 3 1250W 181 49 0 25 1 2 2 3 62 3 1250W 128 74 10 0 9 15 21 30 13 17 124 ml1430 61
123
= Correctly Classified
123 = Incorrectly Classified 123 = 2nd highest classification Figure 6: Classification Results using 22 features and dr = 5
In\Out hl1440 lj4050 e320 lj1000 lj1200 lj5M lj6MP 1250W 14e ml1430
hl1440 lj4050 e320 lj1000 lj1200 lj5M lj6MP 1250W 14e ml1430 Majority Vote 0 0 3 2 24 12 41 8 hl1440 141 69 0 0 0 0 0 0 0 0 0 lj4050 300 0 0 0 0 1 0 4 0 e320 283 12 7 0 0 23 27 8 0 3 lj1000 152 80 26 20 4 0 3 lj1000 13 0 1 140 93 0 1 6 7 21 25 0 0 lj5M 187 53 33 0 25 44 39 16 0 26 lj6MP 66 51 40 0 0 0 31 12 5 0 1250W 109 103 0 33 1 0 1 1 36 15 14e 115 98 40 0 1 15 15 1 40 11 131 ml1430 46
123
= Correctly Classified
123 = Incorrectly Classified 123 = 2nd highest classification Figure 7: Classification Results using 4 features and dr = 9 7. Pei-Ju Chiang, Gazi N. Ali, Aravind K. Mikkilineni, George T.-C. Chiu, Jan P. Allebach and Edward J. Delp, Extrinsic signatures embedding using exposure modulation for information hiding and secure printing in electrophotographic devices, in Proceedings of the IS&T’s NIP20: International Conference on Digital Printing Technologies (2004). 8. Aravind K. Mikkilineni, Gazi N. Ali, Pei-Ju Chiang, George T.-C. Chiu, Jan P. Allebach and Edward J. Delp, Signature-embedding in printed documents for security and forensic applications, in Proceedings of the SPIE/IS&T Conference on Security, Steganography and Watermarking of Multimedia Contents, pp. 455–466 (2004). 9. Gazi N. Ali, Pei-Ju Chiang, Aravind K. Mikkilineni, Jan P. Allebach, George T. Chiu and Edward J. Delp, Intrinsic and extrinsic signatures for information hiding and secure printing with electrophotographic devices, in Proceedings of the IS&T’s NIP19: International Conference on Digital Printing Technologies, pp. 511–515 (2003). 10. Gazi N. Ali, Pei-Ju Chiang, Aravind K. Mikkilineni, George T.-C. Chiu, Edward J. Delp and Jan P. Allebach, Application of principal components analysis and gaussian mixture models to printer identification, in Proceedings of the IS&T’s NIP20: International Conference on Digital Printing Technologies (2004).
11. Keinosuke Fukunaga, Introduction to Statistical Pattern Recognition, Academic Press, San Diego, CA (1990). 12. Robert M. Haralick, K. Shanmugam and Its’Hak Dinstein, Textural features for image classification, IEEE Transactions on Systems, Man, and Cybernetics, SMC-3, 610 (1973). 13. Richard W. Conners, Mohan M. Trivedi and Charles A. Harlow, Segmentation of a high-resolution urban scene using texture operators, Computer Vision, Graphics, and Image Processing, 25, 273 (1984).