Transparent prioritisation, budgeting and resource allocation with multi-criteria decision analysis and decision conferencing by
Lawrence D. Phillips1 and Carlos A. Bana e Costa1,2
1
Department of Operational Research, London School of Economics and Political Science, Houghton Street, London WC2A 2AE, U.K. (
[email protected];
[email protected])
2
Centre for Management Studies of Instituto Superior Técnico, Technical University of Lisbon, Av. Rovisco Pais, 1049-001 Lisbon, Portugal
Working Paper LSEOR 05.75
ISBN 0 7530 1697 4
First published in Great Britain in 2005 by the Department of Operational Research London School of Economics and Political Science
Copyright © The London School of Economics and Political Science, 2005
The contributors have asserted their moral rights.
All rights reserved. No part of this publication may be reproduced, stored in a retrieval system, or transmitted in any form or by any means, without the prior permission in writing of the publisher, nor be circulated in any form of binding or cover other than that in which it is published.
Typeset, printed and bound by: The London School of Economics and Political Science Houghton Street London WC2A 2A
Working Paper LSEOR 05.75
ISBN 0 7530 1697 4
Transparent prioritisation, budgeting and resource allocation with multi-criteria decision analysis and decision conferencing
Lawrence D. Phillips1, Carlos A. Bana e Costa1,2
1
2
Department of Operational Research, London School of Economics Houghton Street, London WC2A 2AE, U.K. (
[email protected])
Centre for Management Studies of Instituto Superior Técnico, Technical University of Lisbon Av. Rovisco Pais, 1049-001 Lisbon, Portugal (
[email protected])
Abstract. Managers in both for-profit and not-for-profit organisations continually face the task of allocating resources by balancing costs, benefits and risks and gaining commitment by a wide constituency of stakeholders to those decisions. This task is complex and difficult because many options are present, benefits and risks are rarely expressed as single objectives, multiple stakeholders with different agendas compete for limited resources, individually optimal resource allocations to organisational units are rarely collectively optimal, and those dissatisfied with the decisions taken may resist implementation. We first explain three current approaches to resource allocation taken from corporate finance, operational research and decision analysis, and we identify a common mistake organisations make in allocating resources. The paper then presents a technical process, multi-criteria portfolio analysis, for balancing the conflicting elements of the problem, and a social process, decision conferencing, which engages all the key players during the modelling process, ensuring their ownership of the model and the subsequent implementation. This socio-technical process improves communication within the organisation, develops shared understanding of the portfolio and generates a sense of common purpose about those projects that will best realise the organisation’s objectives. The paper concludes with lessons we have learned from actual practice. Keywords: managerial decision making, multi-criteria decision analysis, resource allocation, prioritisation, budgeting, commons dilemma, Equity, real-world applications, system design, procurement, capital planning, capital budgeting.
Working Paper LSEOR 05.75
ISBN 0 7530 1697 4
2 Introduction Decision makers in all organisations continually face the difficult task of balancing benefits against costs and the risks of realising the benefits. Our experience with both for-profit and notfor-profit organisations shows that managers who must allocate resources are typically confronted with five problems. First, benefits are typically characterised by multiple objectives, which often conflict (Phillips, 1992). This is nearly universal for organisations in the voluntary (Quaddus, Atkinson and Levy, 1992) and public sectors (Bana e Costa, 2001), and typical for those in the private sector (Collins and Porras, 1996). Second, when decision makers are presented with a large number of opportunities they can not know the details of each one sufficiently well to make informed decisions. Third, if resources are allocated to each of several organisational units considered individually, the collective result appears not to make the best use of the total resource (Phillips, 1990). That is, individually optimal decisions are rarely collectively optimal, giving rise to inefficient use of the available total resource, a situation that illustrates the ‘Commons Dilemma’ (Hardin, 1968). Fourth, many people are usually involved. Some provide expert judgement and advice to the decision maker, but that assistance inevitably reveals fundamental conflicts, which possibly creates competition (Bana e Costa et al., 2002). Others, with power to interfere or influence decision making, are often difficult to identify. Resolving those conflicts, and finding win-win solutions, often accompanies the process of resource allocation (Bana e Costa, 2001). Finally, implementation by those who disagree with the resource allocation can easily lead to the formation of small teams of people surreptitiously working on non-approved projects in which they are heavily invested personally. These five characteristics of real-world resource allocation highlight the need for an approach that will enable decision makers to balance costs, risk and multiple benefits; to construct portfolios of investments across different areas such that the collective best use is made of the limited total resource; to consult the right people in a structured, coherent way, so that their multiple perspectives can be brought to bear on the issues; and to engage the key players to ensure their alignment to the way forward, while preserving their individual differences of approach. This can only be accomplished by blending a technical solution that captures the differing perspectives with a social process that engages those concerned. The purpose of this paper is to present such a process, which combines technical elements of multi-criteria decision analysis (MCDA) with social aspects of decision conferencing, resulting in a tested approach to working with key players that creates shared understanding of the issues, a sense of common purpose and commitment to the way forward. We begin with a brief review of other technical approaches to resource allocation, then introduce the decision conference
3 process. An explanation of the MCDA socio-technical approach to resource allocation is followed by the presentation of lessons we have learned from applying it in real-world cases. We finish with conclusions drawn from our experience of using the approach. 1.
Approaches to resource allocation
An important distinction must be made between resource allocation and prioritisation. Allocating resources requires an accountable manager to make decisions; prioritising options is an activity that can be carried out by key players, with the resulting priorities used by the accountable manager in making final decisions. We make this distinction because most of the approaches proposed for resource allocation are actually models for establishing priorities. Here, we approach resource allocation via prioritisation. It is useful to distinguish two different prioritisation tasks: appraisal of options and constructing portfolios. Option appraisal or evaluation is the process of arriving at an overall ordering of several options within an area. For example, a project manager of an R&D team might look at several options within the team’s area to decide which ones look most promising for further development. Constructing portfolios, on the other hand, refers to the appraisal of options across many areas and finding the best combinations of options for a given level of resource. An R&D director will wish to construct a portfolio within the available budget of the very best options across the many areas of development activity. In the remainder of this paper, we focus on the construction of portfolios, which necessarily requires option appraisal as a first step. The three main perspectives on portfolio resource allocation decisions derive from corporate finance, operations research optimisation methods, and decision analysis. Each places a different emphasis on how benefits, costs and risks are handled. The corporate finance perspective assumes that benefits are expressed in monetary terms, that the appraisal of a project’s worth is determined by calculating its net present value (NPV), and that the project should be undertaken if the NPV is positive, an indication that the benefits outweigh the costs (Brealey, Myers and Marcus, 1995). In not-for-profit organisations, the benefit of a project may be determined by applying cost-benefit analysis, which is based on social welfare economics, with willingness-topay and willingness-to-accept studies conducted to translate non-monetary benefits into monetary values (HM Treasury, 2003). With all costs and benefits expressed in present monetary values, NPVs can be calculated. In all cases, when budgets are limited, the appropriate criterion is not just a positive NPV, but rather the ratio of NPV to the investment costs, a profitability index that represents value-for-money. Risk is often accommodated in the discount rate applied to each year’s total cash flows, with higher discount rates applied to the projects that are more
4 risky. This requires a judgement of the risk associated with each project, as distinct from the risk of the organisation. The optimisation perspective of operations research casts the problem as one of maximising the sum of the benefits of all investments subject to the constraint that the budget cannot be exceeded. When projects are either chosen or not, this is known as the binary knapsack, named after the decisions one must make to fill a knapsack with the most valuable items that together fit in the limited confines of a knapsack. Of course, as Brown, Dell and Newman (2004) observe, this simple optimization model has to be modified for it to work in the real world. While accommodations are made for interactions between decisions, synergies, life-cycle management and other effects, the risk of not realising the full benefits is rarely mentioned. The third perspective arises from decision analysis, though two different approaches are evident in practice. In the first approach, conventional decision trees model each project’s risks and future decisions that could be taken after the receipt of relevant information (Clemen, 1996). Typically the consequences of each project are modelled in financial terms, often using NPV as the criterion, with the discount rate set as a risk-free rate, since all uncertainties about future events have been modelled as probabilities in the decision tree. The NPVs are weighted by probabilities and the resulting expected monetary values become the basis for ordering the options, or, when divided by costs, providing indices for constructing portfolios. The second approach relies on multi-criteria decision analysis for valuing the consequences of the options (Keeney and Raiffa, 1976), even to the extent of treating risks as criteria rather than as probabilities. For not-for-profit organisations, the benefit criteria are typically all non-financial, while mixtures of financial and non-financial criteria are used in for-profit organisations. These three perspectives express normative views about how prioritisation should be carried out, but how is it done in actual practice? A survey by the Centre for Medicines Research International of pharmaceutical companies in 1995 showed that 21 of the 28 companies responding to a questionnaire used a financial model to inform the decision to start full-scale development of a drug, 14 used a risk analysis model, 19 a marketing model, 3 a statistical forecasting model, 8 an in-house model, and 11 used decision analysis (MacFarlane, 1997). But human judgement was top of the list, with over 80% of companies noting its use. The transparency of information for decision-making was cited by many of the 60% of respondents who were satisfied with their current portfolio management system. Companies that were dissatisfied with their systems based their views on “…their inability to form a consensus internally on the type of data and methodology required, and also having a system that focused too much on projects rather than the whole portfolio.” (p. 9)
5 These findings confirm our experience that the final portfolio decisions are mainly a matter of human judgement, with models informing that judgement. To be useful to decision makers, models should be able to accommodate financial and non-financial benefit criteria, risk and uncertainty, data and judgement, and be transparent, while providing an audit trail. But models alone are insufficient. Unless they are included in a social process that becomes an accepted way of doing things, institutionalised within an organisation’s culture, they will not survive when their champions leave the organisation. We turn next to consider a social process, a decision conference, that can take many forms, so is adaptable to many different cultures. 2.
The decision conference
In May 1979, the managing director of the Westinghouse Elevator Company brought his entire 20-person management team, rather than just a few key senior managers, as had been expected, to a consulting company called Decisions and Designs, Incorporated, where they explored alternative designs for a new factory. To the surprise of the DDI consultants, at the end of the two-day meeting, participants were agreed about the best configuration of the factory, and a later follow-up confirmed that the successful implementation owed much to the buy-in of participants to the results. Thus was the first decision conference born, with its emphasis on creating aligned commitment as well as quality decisions. Today, thousands of decision conferences have been conducted in over 15 countries. Although decision conferences are conducted differently by the facilitators who run them, there are many common features, which we describe here. So what is a decision conference? It is a gathering of key players who wish to resolve important issues facing their organisation, assisted by an impartial facilitator who is a specialist in decision analysis and works as a process consultant (Schein, 1999), using a model of relevant data and judgements created on-the-spot to assist the group in thinking more clearly about the issues. Note that the role of the model is to serve as an aid to thinking and group learning, not to give ‘the right answer’ or to find an optimal solution. Rather, the model is ‘requisite,’ that is, sufficient in form and content to resolve the issues at hand (Phillips, 1984). The model represents the collective view of the group at any point during its generation and modification, and serves as a means to examine the impact of differences in perspective or vagueness in the data. Because the model is projected for all participants to see it as it is created, it is less likely to be perceived by participants as a ‘black box,’ which helps to gain confidence in model results. A decision conference is conducted in the ‘here-and-now,’ without a fixed agenda and preferably with no formal presentations. Four stages typify most meetings: exploration of the
6 issues, structuring and building a model, exploring the model and agreeing the way forward. Data are introduced when needed; issues are tackled when they arise; feelings of unease are expressed as they occur; debate is encouraged; differences of opinion are actively sought. As the model is built and participants examine the results for their realism and consistency, new intuitions about the issues arise, often leading to changes in the intuitions and sometimes provoking revisions to the model. As this iterative and interactive model-building process proceeds, shared understanding of the issues is created. Extensive sensitivity analyses show that many disagreements or uncertainties in the data make no difference to the overall results, and gradually a sense of common purpose emerges from the group. Eventually, commitment to the way forward is agreed. The consultant makes clear that his or her role is to guide the process to accomplish the overall task of arriving at an agreed prioritisation, while participants will be contributing the content. The consultant is guided by the ten principles of process consultancy, as explained by Schein (1999), in particular principle 5, “It is the client who owns the problem and the solution.” Thus, the consultant/facilitator guides the group in how to think about the issues, not what to think, which is the responsibility of the participants. In short, this decision aiding methodology assumes that problem-owners and their advisers, who may also be present, own all the necessary information, in the form of both hard data and judgement, to resolve the issues. No operational constraints are built in to the model at this stage, unlike typical modelling in operations research, for the simple reason that more and more constraints keep an organisation pumping resources into the status quo, thereby preventing the organisation from moving in new strategic directions. Interactions between options are assumed to exist, and appraisal of an option that depends on another option is carried out assuming for now that the other option will be executed. Team members are reminded that in appraising the options, realism and consistency are desired, that peer review operating within the team will assist in achieving those goals. Only when results reveal inconsistencies, are constraints imposed. It then takes at least two weeks for the senior staff to reflect on the outcome of the decision conference, for it will have revealed unexpected results, and these may need to be further tested with additional data, or reflected on to understand the apparent discrepancies. This period of digesting the results is an important step, and is often followed by the consultant/facilitator working with the decision maker and his or her team to explore new thoughts about the way forward. In the meantime, the facilitator has written a report about the decision conference enabling all participants to see the basis on which final decisions are made. In this way, even
7 though some currently-running projects are closed down, and other, new ones, are started, everyone sees the justifications. Some problems are so large they cannot be accommodated in a two-day decision conference. Then, sustained working with a client is required, using several decision conferences, along with workshops, interviews and individual meetings, a process we call decision conferencing. Designing this social process, including its technical components, at the start of the engagement is essential to ensure that bottom-up knowledge of what is realistically possible meets with top-down strategic direction of what is desired. Section 4 includes several approaches to this sociotechnical design. 3.
MCDA for prioritisation and resource allocation
3.1.
The value-for-money principle
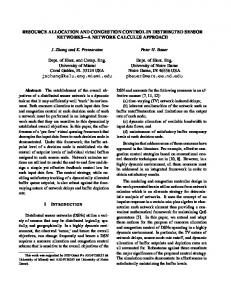
The prioritisation model for resource allocation is deceptively simple, uncontroversial, yet seldom used in organisations. All the three perspectives presented in section 1 agree with the principle that the correct basis for prioritisation, the one that ensures that best value is obtained for the available resource, is risk-adjusted benefit divided by cost, as represented by the triangle shown in Figure 1.
Value for Money
Riskadjusted Benefit
Cost Figure 1: The value-for-money triangle.
That is the theory, but what about the practice? Between us, the authors’ experience of helping organisations with resource allocation extends over 35 years, and extends to more than 70 for-profit and not-for-profit organisations across a wide span of sectors. Not once have we encountered an organisation that prioritises investments according to this theory. So how do they do it in practice? Many different methods seem to be employed, but most are some variant of the following five steps: 1. List the projects (investments); 2. Determine the benefit that each project is expected to create; 3. Order the projects from most to least benefit; 4. Associate a forward cost for each project; 5. Go down the list, choosing projects until the budget is exceeded. In short, projects are prioritised on the basis of benefits only.
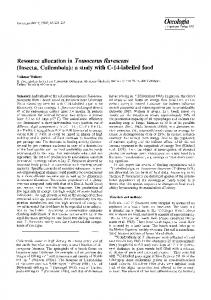
8 It is easy to show this does not make the best use of the budget, that choosing on the basis of the benefit-to-cost ratio is always better for maximising total benefit. The upper curve shown in Figure 2 shows 59 real projects prioritised on the basis of benefit-to-cost ratio. Each point represents a project, and its cost and benefit are shown as increments from the previous project to the left. The curve is everywhere concave looking upward because the projects have been ordered by the slope of the benefit/cost triangle associated with each one. The lower curve shows the same 59 projects ordered by benefits only; only the right side of each triangle is taken into account in the order, so the curve snakes upward, always below the upper curve. If the total available budget is only 4000, then by the benefit-only criterion, just six projects will be funded, for relative total benefit of about 40, but if the benefit/cost ratio is followed, then many projects will be included in the portfolio, for relative total benefit of about 75. Because the benefits-only curve always falls below the benefit/cost curve, prioritisation based on the benefits-only criterion is certain to make less effective use of the available resource. The ratio of benefits to costs is a normative principle if an organisation is looking to ensure value-for-money. We continue to be disappointed that this principle appears to elude so many organisations.
Figure 2: Prioritisation of 59 projects, either by their benefit-to-cost ratio or by benefits only.
One further important point needs to be mentioned. Insofar as future benefits are uncertain, then the benefits should be risk adjusted, so that the right side of the triangle represents riskadjusted benefit. In decision theory, this is accomplished by multiplying the benefits by the probability of realising them, a necessary step to ensure consistency of preference between projects with different benefits and probabilities of success (Raiffa, 1968).
9 Returning now to our main theme, the goal of MCDA modelling is to collapse multiple dimensions of benefit into a single risk-adjusted benefit, thereby defining the right side of each triangle. This is simply accomplished by constructing the benefit criteria so that they are mutually preference independent, thereby justifying an additive aggregation model. Let vij represent the value associated with the consequence of option i on criterion j. Let wj represent the weight assigned to criterion j. Then, the overall value of option i is simply
V = ∑w v i
j
ij
.
(1)
j
In words, the value scores assigned to the consequences of an option on all the criteria are multiplied by the respective weights assigned to the criteria and those products summed across all the criteria. The weights are scaling constants that represent the correspondence between value units on one criterion compared to another (as nine degrees Fahrenheit equate to five degrees Celsius). 4.2.
The Equity model
Variations on equation (1) are seen in MCDA software for portfolio analysis1; the mathematics depend on the structure of the model. Here we explain the approach taken in Equity, whose basic structure mimics the structure of all organisations: resources are expended at different levels in various organisational units or functions, here called areas, each working to create value so the organisation can fulfil its mission. Equity assumes that in each of K areas, the options are appraised against J benefit and risk criteria, resulting in K × J scales. The options in each area are first appraised against each criterion separately. This is done for each area individually, resulting in a value score
v
ij
for each option i on criterion j, such that for each scale 100 represents the
most preferred option and zero represents the least preferred option. Then, each of the K 0-100 scales for a given criterion j will be assigned, using swing-weighting, a within-criterion weight, wjk. The scale associated with the largest swing in value between two reference points is assigned a weight of 100, and all the others are given swing weights relative to 100. The scales assigned within-criterion weights of 100 for each criterion are then compared for their swings, resulting in a set of across-criteria weights wj. The value scores, the within criterion weights and the across criteria weights are the inputs necessary for EQUITY to calculate the overall value of each option, by applying this model (in which k(i) designates the area to which option i belongs):
1
MCDA software for portfolio analysis include: Equity, at www.catalyze.co.uk; High Priority, at www.krysalis.co.uk; and Logical Decisions at www.logicaldecisions.com.
10
∑w w v V = c ∑∑ ww j
j
jk ( i )
ij
i
j
k
j
.
(2)
jk
The normalising constant c ensures that the sum of all values of all options does not exceed 1000. Thus, each option becomes associated with a single doubly-weighted value, which measures its risk-adjusted benefit in units of preference that are now everywhere comparable. Finally, Equity calculates the benefit-to-cost ratios by dividing each option’s overall value by its total cost:
r
i
=Vi .
C
(3)
i
This process results in a single triangle associated with each option. The triangles are stacked in declining order of value-for-money priority as given by the slope of their hypotenuses to create an efficient frontier, as shown in Figure 3.
Figure 3: An efficient frontier created from an MCDA model. The graph displays cumulative benefits versus cumulative costs. Each point represents another project, with the F position defining the affordable portfolio: all projects down and to the left of F are within the available budget.
Note that EQUITY allows for the consideration of a minimum requirement in each area, so the initial point in the efficient frontier always corresponds to the portfolio formed by the
11 minimum requirements in all areas. The portfolio of projects up to and including F is then examined by the group, and the projects falling outside the affordable portfolio are carefully examined to ensure their exclusion is realistic. The shaded area under the efficient frontier includes all possible portfolios, that is, all possible combinations of options. It is at this point that operational constraints are introduced in a decision conference. For example, the decision maker may recognise that some options falling outside affordability are currently underway and cannot be stopped – as, for example, in the Barcelos case (Bana e Costa et al., 2002). Or the decision maker may reject some new projects falling within the portfolio because they require other resources, like equipment or manpower, which cannot be bought in because of current constraints on purchasing or hiring. In cases where proposed new projects have been included in the analysis assuming no constraints, the decision maker then proposes a portfolio, which might be the current portfolio consisting of all the current projects only. The software immediately works out its total risk-adjusted benefit and its total cost, plotting that position on the graph, as shown in Figure 4.
Figure 4: A proposed portfolio, P, that meets realistic constraints. A more beneficial portfolio at about the same cost is shown at B, while a less costly portfolio at about the same benefit is displayed at C.
The proposed portfolio, P, is well below the efficient frontier, indicating that it could be improved by moving to the efficient portfolio C (with about the same benefit as P but a lower cost) or B (with about the same cost as P but a higher benefit), or, indeed any portfolio within
12 the darker shaded region (many of which are both less costly and more beneficial than the proposed portfolio). Because of the commons dilemma mentioned in the introduction of this paper, the portfolio of current projects invariably falls well under the efficient frontier. It could only lie on it if all the points from B to the left were to consist of the current projects, and those points to the right of B were the new, proposed projects. Inevitably, current and new projects are intermingled on the frontier, with the result that the portfolio of current projects has to lie below the frontier, as any position on the lower curve in Figure 2 has to be below the upper curve. Analysis of 20 recent Equity models in which at least one benefit criterion was financial revealed that the added value identified by moving from P to B was, on average, 30%. In four cases the added financial value alone was more than $1 billion in expected (probability weighted) net present value. The inefficiency induced by the commons dilemma can be substantial. This P-C-B display greatly aids the decision maker in exploring improvements to the portfolio by allowing a trial-and-error exploration of new proposed portfolios as the decision maker steers the solution closer to the frontier. It is instructive to see how seriously the decision maker considers the constraints; proposed packages composed only of currently-funded projects cannot move to a better position on the efficient frontier without closing some projects and using the freed resource to fund new projects. An example of this can be seen in Figure 2. Note that the project showing in the lower curve in the vicinity of costs of 2000 to 3000 appears in the far upper right of the upper curve. Although this project is relatively high benefit, its cost is so large that it is poor on a value-for-money basis. These kinds of projects typically appear as highprofile, politically sensitive projects that are favoured by senior managers, but often are considered as wasteful of resources by others in the organisation. These “white elephants” might better be stopped or reduced to free funds for new projects. This approach helps decision makers to take the tough decisions to close down projects that are increasingly looking unpromising. As the group explores different portfolios, participants develop an appreciation that what is best for individual projects, or even areas, is not necessarily good for the whole, and they realise that giving up projects, or closing down an entire area, is no reflection on managers’ individual abilities, and is in the best interests of the organisation. 4.
Lessons from case studies
We present here lessons that we have learned from real-world applications, first focussing attention more on the modelling process, and then on the social process of prioritisation and resource allocation.
13 4.1.
Project prioritisation: the Allergan experience
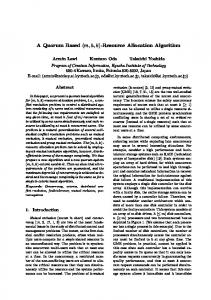
For eight years the first author has helped Allergan Incorporated, a pharmaceutical company, to review their portfolio of R&D projects. The original motivation for this engagement was threefold: 1. high degree of uncertainty about sales projections and judgements of probability of success, so little confidence in NPVs, 2. if one considers only NPV, probability of success and cost, near-term low-risk incremental projects are favoured and secure a majority of the resources, causing innovation and long term profitability to suffer, and 3. non-monetary values of the corporation, such as unmet medical need, protection of existing franchises and the degree to which a project supports the Company’s long-term strategic objectives, need to be explicitly considered in portfolio decisions. Guided by a central team headed by Steve Johnson, and with the support of the R&D manager and his senior staff, a two-day review of the portfolio has taken place each September. Projects are structured within five areas (“Front to Eye”, “Back of Eye”, “Skin Care”, “BTX/Neuro Pain” and “New Technology”) representing the major products of the Company, as shown in Figure 5; each column represents a different area within which projects are pursued. The lettered blocks represent projects. This base display is crucial to an understanding of the portfolio taken as a whole, but it took considerable work to achieve this structure, for at the start neither projects nor areas were at all well defined. (An R&D manager from another company, commenting on this base display for his projects, said, “This is the first time I have seen all our projects on one display.”) The projects are shown in their value-for-money order within each column, with new, proposed projects prefixed with a plus sign. Thus, as can be seen in Figure 5, all Back to Eye projects, either existing or new ones, are included in the efficient frontier. For the Front of Eye and Skin Care areas only on-going projects are included in the frontier portfolio, but three current Front of Eye projects (S, H and O) are excluded. For BTX/Neuro Pain, the value-formoney for some new projects is higher than that for ongoing projects, resulting in one current BTX/Neuro Pain project (V) being excluded from the frontier portfolio, while two new ones (9 and 14) are included. It is these findings that stimulate teams to re-think their strategies, and provide the motivation to seek projects that will provide better value. But doing this requires that all the key players know what the benefit criteria are, and these have changed for Allergan.
14
Figure 5: The affordable Allergan portfolio. Each column represents a therapeutic area, and the letters indicate specific projects in the area. A "+" sign indicates a new, proposed project, while all other projects are currently underway. All projects up to the bold line are included in the efficient frontier, identified by the shaded project and the letter F. Projects are shown in valuefor-money order within their areas, with lower priority projects appearing higher in the columns. There is no equivalence in priority across a given row. The up and down arrows identify the next and previous points on the efficient frontier from point F.
The Company grew over the eight years from an eye-care company to a specialty pharmaceutical company, so their benefit criteria evolved as the company shifted its strategic direction. For the 2003 portfolio review, the benefit criteria had evolved to NPV (financial value), Medical Need (extent to which the project will meet unmet medical need), Business Impact (protecting the existing business), Future Value (contribution to evolution to a specialty pharmaceutical company) and Probability of Success (probability that the benefits will be realized). Advance work with Marketing and the project teams provided input data of NPVs and probabilities of success; these and other issues were briefed to the group on the first day. During the two-day decision conference, participants collectively assessed preference values for the other three criteria. Within-criterion and across-criteria weights were judged by the group, enabling Equity to calculate the risk-adjusted value-for-money ratios required to construct the efficient frontier.
15 It is instructive to see the evolution of the frontier over the past five years from the first year that the modelling process was used to inform final decisions. Figure 6 gives the locations of the portfolio of funded projects at each review, shown at point P. 1999
1998
2001
2000
2002
Figure 6: Changes in the efficient frontier of R&D projects for Allergan over six years. The P position shows the location of the portfolio of funded projects, with B representing a higher benefit portfolio at about the same cost, and C showing a lower cost portfolio at about the same benefit.
16 The slimmer shaded areas in 2000 to 2002 compared to 1998 and 1999 are the result of a change in 2000 of the benefit criteria. In the earlier years, the benefit criteria focused mainly on the eye-care business, and the steep portions of the two curves identified projects that greatly benefit that business, gaining value from the NPV and Business Impact criteria, and from high probability of success. In 2000, the group added the Future Value criterion, which favoured projects that contribute to Allergan’s vision to become a specialty pharmaceutical company. This created a more balanced portfolio, as evident by the less steep initial portions of the efficient frontiers in the later years, and the slimmer shaded area. In addition, the P position moved closer to the frontier, evidence that Allergan’s portfolio was evolving to realising more value-formoney. An important development in the Equity software enabled Allergan to see the consequences of forcing an excluded project into the affordable efficient portfolio. Figure 7 shows one such analysis. A current project in Front of Eye, O, had been excluded from the frontier for the second year. Bringing it into the frontier would require funds to be released to pay for it, keeping within the total budget. Equity identified options C and AA as the lowest priority projects whose omission would pay for project O. This visual display of trade-offs provides a cogent reminder to decision makers that trade-off judgements are at the heart of constructing cost-efficient portfolios. Over the years, the MCDA modeling informed the final portfolio decisions by Allergan’s executive committee by serving as a summary to R&D management of the value-for-money associated with each project. In the later years, once managers gained confidence in the inputs to the model, they used the model’s outputs to recommend projects to the executive committee for final approval. Little controversy attended those decisions in the executive committee, largely because the committee’s members attended the decision conference and were active members, so consensus and commitment among the decision makers were built during the process. The main discussions occurred about projects in the vicinity of the affordable frontier, and on the mix of development and longer-term innovative projects. In September 2004, the portfolio process identified a particularly costly project for which research had established that benefits were looking increasingly marginal. About a month after the decision conference, the project, which had been licensed-in about three years earlier, was cancelled.
17
Figure 7: Trade-off analysis. Clicking on option O in Front of Eye forced it into the frontier portfolio (turning that block a light green), and Equity found the lowest priority projects within the frontier that could be traded out (turning blocks C and AA red), at about the same cost, to release funds to pay for option O.
4.2.
Designing the social process
Effective allocation of resources is not simply a technical matter of using appropriate modelling. As Sharpe and Keelin (1998) point out, the soft issues of trust and fairness, and the process within which the technical modelling is used, are even more important. The case reported here is an amalgamation of several real projects. We have taken the lessons from those projects to create a hypothetical but realistic engagement that illustrates the key points in designing the social process within which the resource allocation process takes place. Of course, the generic framework presented here must be adjusted to the specificities of each particular decision context. After the initial contact with the client, which establishes the subject and scope of the engagement, the consultant arranges a briefing of the senior decision makers to ensure their support for the process and to begin the process of determining the structure of the model, identifying and defining the criteria and agreeing the scope of options to be included in the analysis. A strategy group, which includes the accountable decision maker or a representative, is
18 established to guide the direction of the project and monitor progress, and a working group, which includes a member of the strategy group, is formed to ensure the smooth execution of the project. The strategy group is engaged for a half-day in developing the structure of the models to be used in the engagement: agreeing the areas to be covered, the kinds of options to be considered in each area, and the cost, risk and benefit criteria to be used in the model. Once they have acquired an intuitive feeling for how the MCDA modelling process works, they then consider how the process will be rolled out across the areas. A typical design is illustrated in Figure 8.
Kick-off Meeting
Engage strategy team
T e a m
M e e t i n g s
Review by senior managers for realism and consistency
Merge Meeting assess trade-offs explore portfolios
Evaluate and digest; recommend
Figure 8: A social process for decision conferencing.
After the work with the strategy team, the working group organises the kick-off meeting, bringing together the heads of all the teams that will help build the model. The meeting is chaired by the sponsoring manager who explains the purpose of the engagement and solicits everyone’s co-operation. A brief explanation of the MCDA modelling approach is presented by the senior consultant, who also outlines the subsequent tasks for the groups. This is followed by an open forum whose purpose is to review the benefit, risk and cost criteria proposed by the strategy group to sharpen the definitions and make modifications and additions. Throughout, questions are solicited as they arise, anticipating the way the individual groups will be conducted as decision conferences. Following the kick-off meeting, teams meet to provide the options and the associated input scores for their part of the MCDA portfolio model. At this stage the process is bottom-up: team members associated with the day-to-day work mobilise their intimate knowledge of what is being
19 done and what could be done, helped by the consultant/facilitator and one or more members of the working group. The teams are encouraged to think strategically, what can be done and why to achieve the objectives set by the strategy team, and not to become bogged down in how activities are to be carried out and by when. In particular, it is important to release the team’s budget and manpower constraints, encouraging them to think of new activities they could engage in if they had more budget or a different mix of people skills. Once the teams have completed their work, a senior team of vice-presidents or directors reviews the options put forward and their appraisals against the benefit, cost and risk criteria to make further checks on consistency and realism across all the teams. Suggestions for improvements are fed back to the teams who are asked to revise their work. The final versions are then gathered into a booklet, with a preface by the most senior person explaining the importance of the final merge meeting to the decision making process that will follow. In addition, a short description of the group’s tasks is provided by the consultant. The merge meeting brings together the team leaders with the senior staff to complete the model by judging within-criterion and across-criteria weights. This is the point where the bottom-up work meets the top-down judgements of the senior staff. The meeting usually begins with a review of the work of the teams, but done in a way that engages participants to ask questions and make observations that will contribute to the overall prioritisation task. The process of judging trade-offs is explained by the facilitator, who then involves the entire group, often using a nominal-group technique (Delbecq, Van de Ven and Gustafson, 1974) in assessing weights. The following description of the weighting process will make clear why weights can be assessed meaningfully only after the ranges on all scales have been established. First, one of the areas is chosen, and one criterion is selected. Participants are asked to imagine how much they care about the contribution all the area's projects would make to that criterion if were all successful. They are reminded that their judgement should be influenced by how many projects there are in an area, and whether they score well or poorly on the criterion. They are then asked to imagine the contribution to the criterion that all the projects in another area would make, again, if they were all successful. Participants are then invited to judge how much they care about those two collective contributions, and to state which is bigger. The bigger one is chosen and then compared to another area's scale, and so on. This paired-comparison method identifies the one area with the biggest swing in value on the given criterion, and it is assigned an arbitrary weight of 100. Second, the nominal group technique is invoked in successive comparisons of each area's scale to that 100, always for the same criterion. Participants are asked to write down
20 privately their judgement of an area scale's weight compared to the standard of 100. Then a show of hands enables the facilitator to construct on a flip chart a frequency distribution of the answers. The two people given the highest and lowest weights are then encouraged to explain their reasons, and when they are through, the other participants are invited to join the discussion. Usually, the result is sufficient convergence of views that the group can agree a weight, though sometimes another round is conducted. Extreme views compared to the group's consensus are recorded for later sensitivity analysis. Much time is then spent on sensitivity analyses, exploring differences in participants’ views of what should be included in the affordable portfolio, different weights on the benefit criteria and differences of opinion about specific scores (often, seeing how much improvement could be made to a project’s priority by increasing its judged NPV). Exploring proposed portfolios and conducting trade-off analysis provides participants with a grounded understanding of the projects exhibiting greater and lesser opportunities. The meeting ends with a discussion of what has been learned over the two days, and what portfolio looks most promising for recommending to the decision makers. After the merge meeting, a period of reflection on the model’s results is advisable. Some time is usually needed to digest fully the results, to prepare briefings of recommendations to the decision makers, and to explore the effects of new information that might alter the results in crucial areas. Adjustments to this new way of prioritising and allocating resources may call for changes in the structure of the organisation, and if senior management see the modelling as helpful to them, they may take steps to institutionalise the process. 4.3.
Discussion
The Equity structure solves a serious technical problem encountered by the traditional decision analytic approach to analyzing portfolios (Keeney, 1987): decision trees increase exponentially in size with increases in the number of areas and options within the areas. In the MCDA approach outlined here, the size of the model increases additively, making it possible to display quite large models in their entirety. Constraints are imposed visually. Minimum acceptable investment in any area is shown as the bottom level in each column. In Figure 5, that was considered to be an exit strategy from the area, but in many cases bottom-level options are simply the cheapest ones that would meet the minimum requirements in each area. Equity then starts at those minimum levels in all areas as it constructs the added value triangles above. Dependencies between two options are modelled assuming both will be chosen for inclusion in the affordable frontier portfolio. If they both are,
21 it does not matter that they appear in value-for-money priority order in the opposite order to their dependency; the efficient frontier says nothing about the time-sequence or causal order of the options. Physical dependence of one option on another may require forcing the key option into a position at the bottom of a column. Value dependence can be handled by iterating the model, first assuming the dependence, then, if necessary, valuing the options as if the other wasn’t present. In other cases, value dependences are among complementary projects, which should be viewed as parts of a same investment package and therefore included in the model as a single option (Bana e Costa et al., 2002). In general, we have found that while dependencies are often though to be a widespread issue for some problems, in practice they play a minor role. For this reason, we handle them through model iterations, focussing on only the very few dependencies that are shown to matter, rather than modelling all dependencies from the start. Overall, a major challenge for the consultant is to manage the trade-off between more sophisticated modelling and more attention to the social process. Our experience suggests that more value will be obtained through spending time on the social process. More and more refinements of the model usually deliver only marginal improvements to the final decisions (Keisler, 2005). 5.
Conclusions
In all organisations, resources are allocated to areas that correspond to functions or organisational units. Very often, people in the areas live in their own silos, making the best use possible of the resource that is available to them. Inevitably, this approach imposes the commons dilemma, particularly when strategic planning creates only single plans for each unit rather than options to be examined by senior management. Any attempts by senior management to make substantial changes to budgets are often met with resistance from the fiefdoms, who wish to be left alone to get along with their work. Introducing the MCDA process outlined here requires recognition of this tendency to protect existing fiefdoms, and to design the social process to be inclusive, open, transparent and fair. It is not always wise to show the location of the current portfolio relative to the efficient frontier; just the priority order of the points along the frontier may be sufficient for the group to recognise they could substantially improve the current portfolio. When trust in the process has been built, which can take two to three years, then examination of the current portfolio can yield dividends by encouraging individual teams to look more closely at their work. This MCDA process helps to increase communication across silos, to develop shared understanding of the portfolio as a whole, and to generate a sense of common purpose about
22 those projects that will best realise the organisation’s objectives. Transparency of the model makes it easy to brief upwards, and provides an audit trail of the decision making process, particularly important to organisations in the public sector. By taking a socio-technical approach, ownership of the results of the modelling develops and implementation is improved. The real payoff is in smarter decisions that increase the value created by the available resource. Acknowledgments The authors want to thank Allergan and FCT (Portuguese Science Foundation) for their support. References Bana e Costa, Carlos A. (2001). "The use of multi-criteria decision analysis to support the search for less conflicting policy options in a multi-actor context: Case study," Journal of Multi-Criteria Decision Analysis, 10, 111-25. Bana e Costa, Carlos A., Manuel L. Costa-Lobo, Isabel A. J. Ramos, and Jean-Claude Vansnick. (2002). "Multicriteria approach for strategic town planning: the case of Barcelos," in D. Bouyssou, E. Jacquet-Lagreze, P. Perny, R. Slowinsky, D. Vanderpooten and P. Vincke (eds), Aiding Decisions with Multiple Criteria: Essays in Honour of Bernard Roy: Kluwer Academic Publishers, 429-56. Brealey, Richard A., Stewart C. Myers, and Alan J. Marcus. (1995). Fundamentals of Corporate Finance. New York: McGraw Hill. Brown, Gerald G., Robert F. Dell, and Alexandra M. Newman. (2004). "Optimizing military capital planning," Informs, 34, 6, 415-25. Clemen, Robert T. (1996). Making Hard Decisions; An Introduction to Decision Analysis. Belmont, CA: Duxbury Press. Collins, James C. and Jerry I. Porras. (1996). Built to Last: Successful Habits of Visionary Companies. London: Century Limited. Delbecq, A., A. Van de Ven, and D. Gustafson. (1974). Group Techniques for Program Planning. Glenview, IL: Scott Foresman. Hardin, Garrett. (1968). "The tragedy of the commons," Science, 162, 1243-48. HM Treasury. (2003). The Green Book: Appraisal and Evaluation in Central Government. London: The Stationery Office. Keeney, Ralph L. (1987). "An analysis of the portfolio of sites to characterize for selecting a nuclear repository," Risk Analysis, 7, 2, 195-218.
23 Keeney, R. L. (1992). Value-Focused Thinking: A Path to Creative Decisionmaking. Cambridge, MA: Harvard University Press. Keeney, Ralph L. and Howard Raiffa. (1976). Decisions With Multiple Objectives: Preferences and Value Tradeoffs. New York: John Wiley. Keisler, Jeffrey M. (2005). "The value of assessing weights in multi-attribute portfolio decision analysis," Journal of the Operational Research Society, in press. MacFarlane, Fraser. (1997). "New survey highlights issues in portfolio management." CMR International News, 15, 8-10. Phillips, Lawrence D. (1984). "A theory of requisite decision models," Acta Psychologica, 56, 29-48. Phillips, Lawrence D. (1990). "Requisite decision modelling for technological projects," in Charles Vlek and George Cvetkovich (eds), Social Decision Methodology for Technological Projects. Dordrecht, Netherlands: Kluwer Academic Publishers, 95-110. Phillips, Lawrence D. (1992). "Gaining corporate commitment to change," in Clive Holtham (ed), Executive Information Systems and Decision Support. London: Chapman & Hall. Quaddus, M. A., Atkinson, D. J., Levy, M. (1992), "An application of decision conferencing to strategic planning for a voluntary organization," Interfaces, 22, 6, 61-71. Raiffa, Howard. (1968). Decision Analysis. Reading, MA: Addison-Wesley. Schein, Edgar H. (1999). Process Consultation Revisited: Building the Helping Relationship. Reading, MA: Addison-Wesley. Sharpe, Paul and Tom Keelin. (1998). "How SmithKline Beecham makes better resourceallocation decisions," Harvard Business Review, March-April 1998.