Probabilistic Combination of Multiple Evidence Heeyoul Choi1 , Anup Katake2 , Seungjin Choi3 , Yoonseop Kang3 , and Yoonsuck Choe1 1
3
Dept. of Computer Science and Engineering, Texas A&M University 3112 TAMU, College Station, TX 77843 {hchoi,choe}@cs.tamu.edu 2 Starvision Technologies, Inc. 400 Harvey Mitchell Pkwy South, College Station, TX 77845
[email protected] Dept. of Computer Science, Pohang University of Science and Technology San 31 Hyoja-dong, Nam-gu, Pohang 790-784, Korea {seungjin,e0en}@postech.ac.kr
Abstract. In pattern recognition systems, data fusion is an important issue and evidence theory is one such method that has been successful. Many researchers have proposed different rules for evidence theory, and recently, a variety of averaging rules emerged that are better than others. In these methods, the key issue becomes how to give the weights to the multiple contributing factors, in order to calculate the average. To get better weights for the multiple bodies of evidence, we propose the use of structural information of the evidence. The bodies of evidence lie on a certain informational structure which can be described by a probability distribution and the probability of each evidence can serve as a weight for the evidence. Our experimental results show that our method outperforms other previous methods. Key words: Evidence Theory, Data Fusion, Decision Making, Probability, Belief Function
1
Introduction
The nature and pace of advances in machine learning techniques is dramatically enhancing the effectiveness of pattern recognition methods. Many algorithms have been proposed for pattern recognition (see [1, 2] and references therein). However, usually these algorithms are suitable to handle only one input signal source, even though the signal might be a mixture from multiple sources (i.e., a multivariate variable). When humans recognize some kind of pattern, they use multiple sensors and merge them together, or multiple persons might recognize something and then combine their opinions. This is because one sensor or a single person may not be good enough to unambiguously recognize something, and in this case more sensors or persons may lead to clearer and more stable recognition. Furthermore, the multiple sources (signals or humans) may have different levels of uncertainty associated with them. Therefore, in pattern recognition systems,
we need to handle such different levels of uncertainties from multiple sources or multiple recognition systems which could be implemented as neural networks (NNs) [3]. In this case, data fusion becomes an important issue, where Bayesian theory, fuzzy logic, and evidence theory are known to be effective, even though there is no consensus on which method is more universally applicable [4–7]. Evidence theory (ET) is a mathematically well defined theory for handling conflict between different bodies of evidence. It is conceptually the same as Bayesian theory except that it uses epistemic (subjective) uncertainty [8]. The advantages of ET include its flexibility in theory and easy implementability. In ET, a set of elements can be considered as a hypothesis with an associated degree of belief, and the sum of all beliefs does not have to be 1.0, unlike Bayesian methods where the sum of all probabilities should equal 1.0. After the initial introduction of ET by Dempster [5], it has been improved [6, 9, 7] because in some cases the original ET’s combination rule is against our intuitive reasoning. Many researchers have proposed different rules to address this issue, and recently, some effective averaging rules have emerged, and in these rules, how to assign the weights becomes an important issue [9–11]. These extensions of ET have been applied to many pattern recognition problems [12, 13]. In this paper, we focus on an averaging method for the combination rule as proposed in [9–11]. We use the fact that multiple bodies of evidence give a probability distribution, and the probability of each piece of evidence on this distribution can serve as a weight for that evidence. Here, we simply use a Gaussian distribution as an approximation, to get the weights, and in turn calculate the average for the multiple bodies of evidence. We used the same data set from published averaging methods, and compared our method to those previous methods. Our experimental results are promising since our proposed method uses more information than other previous methods. The rest of this paper is organized as follows. First, we briefly review ET and some averaging rules for ET in section 2. Then, in section 3, we propose a new probabilistic combination rule with discussions about its merit against the previous methods and its potential application to neural network systems. Section 4 shows two experimental results with analysis. Finally, we conclude our work with a brief outlook in section 5.
2 2.1
Related Work Dempster-Shafer theory
Dempster [5] proposed evidence theory and Shafer [6] developed it which led to Dempster-Shafer theory (D-S theory). Here, we give a brief review of the D-S theory. For details, see [7] and references therein.
Let Θ be a set of hypotheses, and m be a basic belief assignment (BBA) which is a function from a subset of Θ to [0, 1] with the following properties. X
m(φ) = 0, m(A) = 1.
(1)
A⊆Θ
When two evidence bodies m1 and m2 are given, the Dempster’s combination rule for m(A) ˜ is defined by P m1 (B)m2 (C) m(A) ˜ = B∩C=A , (2) 1−K where
X
K=
m1 (B)m2 (C).
(3)
B∩C=φ
Here, K indicates basic probability associated with conflict. This can be easily expanded to more than two evidence bodies. As pointed out in [9], in some cases Dempster’s combination rule is against our intuitive reasoning. For example, when only one evidence has 0 belief but all others have 1 belief, still the combination is 0. To overcome this weakness, ET has been improved in some directions such as Yager’s modified Dempster’s rule, Inagaki’s unified combination rule, Zhang’s center combination rule, Dubois and Prade’s disjunctive consensus rule, mixing or averaging, convolutive X-averaging and so on [7]. Among all these approaches, the averaging approach is known to be better than others [7, 11]. 2.2
Averaging rules
In [9], Murphy proposed an averaging rule to avoid the nonintuitive combination in D-S theory as shown in the previous section. When there are N evidence bodies, Murphy’s rule first calculates the average of each hypothesis for the evidence. After calculating the averages, it applies the D-S combination rule with the averages N − 1 times. That is, Eq. (2) is modified as follows. P m(B) ¯ m(C) ¯ m(A) ˜ = B∩C=A ¯ , (4) 1−K where
¯ = K
X
m(B) ¯ m(C). ¯
(5)
B∩C=φ
Here, m(B) ¯ and m(C) ¯ are the averages of evidence for B and C, respectively. Note that it started using a first order statistics which is the average of the evidence. Here, all bodies of evidence have the same importance with the same weight in calculating the average, which is not always the case. As in human decision making, each evidence needs to be assigned with a different weight. If one evidence is in harmony with other evidence, then it can
be considered with high importance. Likewise, if one evidence is in high conflict, it can be considered less important. So, instead of a simple averaging rule, some other researchers have tried a weighted sum of evidence bodies [11, 10]. Although their methods can not be easily summarized in a few equations, generally speaking, they use distances between evidence bodies for different weights, which can be interpreted as a second statistics of the evidence. These methods have better performance than Murphy’s simple averaging method. However, the distance-based weight methods do not use all the information of the structure where the evidence bodies lie on. Also, they are not plugged into probability theory seamlessly and they are complex to implement.
3
Probabilistic Combination Rule
In this paper, we propose a new probabilistic combination rule for ET. Basically, as in [9] and [11, 10], we calculate a weighted sum of evidence bodies for the representative value for each hypothesis from all the evidence. However, it is natural to assume that evidence bodies make a structure as in other data sets (see manifold learning methods [14–16]) and this structure can be described by a probability distribution. Then, we can use the probability of evidence on the distribution for different weights. Here, we calculate a new weighted sum which uses probability of the evidence. Let mj (Ai ) be the jth evidence of ith hypothesis, where i = 1, ..., C and j = 1, ..., N . µi and σi2 are the mean and the variance of ith hypothesis, respectively. As in the maximum likelihood (ML) estimate, we use a biased variance instead of an unbiased one, since the mean is also estimated. Moreover, the biased one gives more informative result especially with the small number of data points, even though the unbiasedness is a very attractive property [17, chap 4]. We assume a Gaussian distribution for the evidence bodies of each hypothesis to get a weight wij for mj (Ai ) as follows. ¾ −(mj (Ai ) − µi )2 , (6) σi2 P where Zi is a normalization term so that j wij = 1. Note that we cannot use a multivariate Gaussian model which might be able to use correlations between hypotheses, because the number of evidence might be less than that of the hypotheses. Now, the weight for each evidence is given by 1 wij = exp Zi
½
w˜j =
1 X wij . N i
(7)
Then, the weighted sum of the evidence bodies for the hypothesis Ai is obtained by X m ¯ p (Ai ) = w˜j mj (Ai ). (8) j
After calculating the weighted sums for all the hypotheses, we apply D-S combination rule N − 1 times as other averaging methods do. With Eq. (8), Eq. (2) is modified as follows. P m ¯ p (B)m ¯ p (C) m ˜ p (A) = B∩C=A ¯ , (9) 1 − Kp where
¯p = K
X
m ¯ p (B)m ¯ p (C).
(10)
B∩C=φ
So, if one evidence has low probability in the evidence distribution, a very low weight is assigned to that evidence according to the probability. Likewise, an evidence with a high probability has high importance. In such a way, we use the information of the structure where the evidence bodies lie on and this is mathematically well defined even though the distribution model we assume here is simple. Our proposed method uses probability of evidence instead of just mean or distances. Although the probability is based on corresponding Mahalanobis distance between the evidence and the mean when we use a simple Gaussian model, it is simply calculated by the distribution. We can expand this approach to more complicated distributions with many other density estimation methods such as a mixture of Gaussian model rather than a simple Gaussian distribution. So, our method is conceptually different from others, and physically this probability is more meaningful than the normalized distance for weights [18, 19]. Also, probability is better than distance in terms of performance, which is confirmed in the next section. In addition to combining the results from multiple recognition systems, our technique can be used for data fusion to help develop a more efficient and robust neural network system. For example, given two sets of measurements, the number of input nodes have to be doubled, making the system more complex. However, we can use our technique to combine the measurements, thus reducing the input layer size. Furthermore, our method can help remove noise or outliers through the data fusion process. As a result, the neural network can converge faster (fewer input nodes) and be more robust (noise resistent).
4
Experiments
In order to show the useful behavior of our method, we carried out experiments with two different data sets used in the previous published methods: (a) the data set in [11] (Data A) and (b) the data set in [10] (Data B). We compared our proposed method to their methods proposed in each paper. We implemented D-S theory, Murphy’s averaging method and Chen’s averaging method in [11] but we simply used Yong’s results from the paper [10], for comparison with our results. Actually both cases are for target recognition systems where there is one true target (for both cases, the hypothesis A is the true target) with multiple evidence.
4.1
Data A
The belief table used in [11] is in Table 1. There are 5 evidence bodies and 3 BBAs for 3 hypotheses. Note that the second BBA for the hypothesis A is zero which is seriously conflicted with other evidence and evidence bodies 3, 4 and 5 have the same belief values. Intuitively, the hypothesis A should have a dominant belief after the combination rule and the hypothesis B should go close to zero. Also the influence of the second evidence is expected to be decreased as evidence bodies are added. Table 1. Evidence of Data A. Belief m(A) m(B) m(C)
m1 0.50 0.20 0.30
m2 0 0.90 0.10
m3 0.55 0.10 0.35
m4 0.55 0.10 0.35
m5 0.55 0.10 0.35
Table 2. Comparison of combinations for Data A. Methods Chen’s
Belief m(A) m(B) m(C) Prob. Weights m(A) m(B) m(C)
m1,2 0.1543 0.7469 0.0988 0.1543 0.7469 0.0988
m1,2,3 0.6026 0.2239 0.1735 0.7194 0.0945 0.1861
m1,...,4 0.8276 0.0355 0.1369 0.8594 0.0078 0.1327
m1,...,5 0.9048 0.0061 0.0891 0.9107 0.0010 0.0884
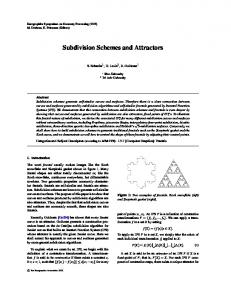
Table 2 shows the combination results of two methods as evidence bodies are added. We can see both methods have the hypothesis A going over 0.9 and the hypothesis B converging to almost zero after 5 evidence bodies are combined, which accords with our intuition. However, our proposed method converges faster than Chen’s method as well as Murphy’s, which we can see more easily in Fig. 1. In this figure, we can see that Murphy’s method converges in a linear way because it uses uniformly distributed weights, while Chen’s and our proposed method converge much faster than Murphy’s because they use the structure of evidence based on distances and probabilities, respectively. Note that the results of D-S combination for the hypothesis A are zero after evidence 2 no matter how high other BBAs are because it ignores all the conflicting evidence which can be interpreted as an AND operation as mentioned in [7]. Fig. 2 shows the weights for the evidence in three methods: Murphy’s, Chen’s and our proposed method. Fig. 2(a) shows how the weight for the second evidence changes as other evidence bodies are added. The second evidence is seriously
1 0.9
Belief assignment
0.8 0.7 0.6 0.5 0.4 0.3 D−S Murphy Chen Prob. Weights
0.2 0.1 0 1
2
3
4
5
Number of evidence bodies
Fig. 1. The belief assignments of the hypothesis A from several methods for Data A
conflicted with others, so we want to minimize the effect (or weight) for it. Our proposed method depress the weight much faster so the effect of the second evidence gets more minimized than in other methods. Fig. 2(b) shows the weight of all evidence bodies after all evidence bodies are combined in three methods. In our proposed method, evidence 2 has less weight and evidence 3,4 and 5 have higher weights than other methods, which means our method finds out the proper weights aligned with our intuition. 4.2
Data B
The belief table used in [10] is in Table 3. As mentioned earlier, ET can have a set of elements as one hypothesis. In this table, there are 3 elements (A, B and C) and 4 hypotheses with ({A, C}) in addition to the 3 elements. There are 5 evidence bodies and the second one is seriously conflicted as in the previous data. Table 3. Evidence of Data B. Belief m(A) m(B) m(C) m(A, C)
m1 0.5 0.2 0.3 0
m2 0 0.9 0.1 0
m3 0.55 0.1 0 0.35
m4 0.55 0.1 0 0.35
m5 0.6 0.1 0 0.3
In Table 4 and Fig. 3, our method converges faster than any other methods. Actually, Yong’s method seems slightly better than ours and much better than
0.5 Murphy Chen Prob. Weights
0.45 0.4
Weights
0.35 0.3 0.25 0.2 0.15 0.1 0.05 0 1
2
3
4
Number of additional evidence bodies
(a) 0.5 Murphy Chen Prob. Weights
0.45 0.4
Weights
0.35 0.3 0.25 0.2 0.15 0.1 0.05 0 1
2
3
4
5
Evidence bodies
(b) Fig. 2. The weights of three averaging methods: Murphy, Chen and Probabilistic Method. (a) The changing weight of the second evidence as the number of evidence increases, (b) The weights of all evidence bodies when 5 evidence bodies are given
Chen’s when only 3 evidence bodies are combined, because the distribution is not well developed yet. However, from 4 evidence bodies, our method works much better than Yong’s as well as any other methods. More interestingly, when 5 evidence bodies are combined, Yong’s method is worst compared to all other methods, still our method is the best.
Table 4. Comparison of combinations for Data B. Methods Yong’s
Belief m(A) m(B) m(C) Prob. Weights m(A) m(B) m(C)
m1,2 0.1543 0.7469 0.0988 0.1543 0.7469 0.0988
m1,2,3 0.4861 0.3481 0.1657 0.4768 0.4518 0.0656
m1,...,4 0.7773 0.0628 0.1600 0.9119 0.0556 0.0210
m1,...,5 0.8909 0.0086 0.1005 0.9879 0.0031 0.0039
1 0.9
Belief assignment
0.8 0.7 0.6 0.5 0.4 0.3
D−S Murphy Chen Yong Prob. Weights
0.2 0.1 0 1
2
3
4
5
Number of evidence bodies
Fig. 3. The belief assignments of the hypothesis A from several methods for Data B
5
Conclusion
In this paper, we proposed a new way to calculate weights for the averaging method in evidence theory. Our proposed method uses the informational structure of evidence in the form of a probability distribution. Our method is well supported mathematically and conceptually, and is simple to implement. The performance of our method turned out to be superior to other existing methods. A promising future direction is to replace the simplistic Gaussian distribution for the evidence to a more complex distribution. This will be especially necessary when the number of bodies of evidence is great.
Acknowledgments Portion of this work was supported in part by KIPA under the program of Software Engineering Technologies Development and Experts Education, by CRC for Artificial Neurosensory Device and Cognitive System, and by KOSEF WCU
Program (Project No. R31-2008-000-10100-0). Heeyoul Choi was supported by StarVision Technologies’s student sponsorship program.
References 1. Duda, R.O., Hart, P.E., Stork, D.G.: Pattern Classification. John Wiely & Sons (2001) 2. Fukunaga, K.: An Introduction to Statistical Pattern Recognition. Academic Press, New York, NY (1990) 3. Bishop, C.M.: Neural Networks for Pattern Recognition. Oxford University Press (1995) 4. Hall, D.L., Llinas, J.: An introduction to multisensor data fusion. Proceedings of the IEEE 85(1) (1997) 369–376 5. Dempster, A.P.: Upper and lower probabilities induced by a multivalued mapping. The annals of Statistics 28 (1967) 325–339 6. Shafer, G.: SA Mathematical Theory of Evidence. Princeton, NJ, Princeton University Press (1976) 7. Sentz, K., Ferson, S.: Combination of evidence in dempster-shafer theory. Technical Report Sandia report SAND2002-0835, Albuquerque, NM (2002) 8. Friedman, N., Geiger, D., Goldszmidt, M.: Bayesian network classifiers. Machine Learning (1997) 131–163 9. Murphy, C.K.: Combining belief functions when evidence conflicts. Decision Support Systems 29 (2000) 1–9 10. Yong, D., WenKang, S., ZhenFu, Z., Qi, L.: Combining belief functions based on distance of evidence. Decision Support Systems 38 (2004) 489–493 11. T. Chen and P. Que: Target recognition based on modified combination rule. Journal of Systems Engineering and Electronics 17(2) (2006) 279–283 12. Chen, A., Guan, Z.: Application of the information fusion based on evidence theory in urban environment. In: Proc. of SPIE. Volume 6043. (2005) 131–137 13. Xu, G., Tian, W., Qian, L., Zhang, X.: A novel conflict reassignment method based on grey relational analysis (GRA). Pattern Recognition Letters 28 (2007) 2080–2087 14. Seung, H.S., Lee, D.D.: The manifold ways of perception. Science 290 (2000) 2268–2269 15. Tenenbaum, J.B., de Silva, V., Langford, J.C.: A global geometric framework for nonlinear dimensionality reduction. Science 290 (2000) 2319–2323 16. Roweis, S.T., Saul, L.: Nonlinear dimensionality reduction by locally linear embedding. Science 290 (2000) 2323–2326 17. Hyv¨ arinen, A., Karhunen, J., Oja, E.: Independent Component Analysis. John Wiley & Sons, Inc. (2001) 18. Choi, H., Choi, S., Choe, Y.: Manifold integration with Markov random walks. In: Proc. Association for the Advancement of Artificial Intelligent (AAAI), Chicago, IL (2008) 19. Kondor, R.I., Lafferty, J.: Diffusion kernels on graphs and other discrete structures. In: Proc. Int’l Conf. Machine Learning. (2002)