KICEM Journal of Construction Engineering and Project Management Online ISSN 2233-9582
www.jcepm.org http://dx.doi.org/10.6106/JCEPM.2014.4.2.031
Comparative Study of GPS-Integrated Concrete Supply Management using Discrete Event Simulation Payam Rahnamayie Zekavat1, Mohammad Mehdi Mortaheb2, Sangwon Han3 and Leonhard Bernold4 Received October 29, 2013 / Revised February 1, 2014 / Accepted February 9, 2014
Abstract: The management of vehicular supply of “perishable” construction material, such as concrete mixes, faces a series of uncertainties such as weather, daily traffic patterns and accidents. Presented in this paper is a logistics control model for managing a hauling fleet with interrelated processes at both ends and queue capacities. Discrete event simulation is used to model the complex interactions of production units and the randomness of the real world. Two alternative strategies for ready mix concrete delivery, with and without an off-site waiting queue, are studied to compare supply performance. Secondly, the paper discusses the effect of an agent-based GPS tracking system providing real-time travel data that lessens the uncertainty of trucking time. The results show that the combination of GPS information with off-site queuing reduces productivity loss and process wastes of concrete placement as well as the idleness of supply trucks when crew or pump experience an unexpected stoppage. Keywords Discrete Event Simulation, Hauling Fleet Performance, Communication, GPS-Tracking, Spatial Limitation, Off-site Queuing, Traffic Pattern, Real-Time Sensor Data
I. INTRODUCTION
a result, the off-site batching of the concrete and its placement on site have to be tightly coordinated. Logistically, it would be desirable to secure a continuous concrete pouring at site by setting a higher supply rate than that of placement. Such an arrangement would force the hauling trucks to wait in a queue before unloading at the site. A study on performance of RMC showed that only in 17% of the cases the truck mixer time on site did not exceed 150% of pour time [5]. Ammar and Mohieldin [6] used simulation to handle the resource scheduling problem at the project level. Park et al. [7] investigated the truck mixer queue behavior in RMC delivery using system dynamics. Bernold [8] stated that unbalanced resource allocation leads to production rate fluctuation. In earthmoving, assigning too many hauling trucks to keep a loader busy is an example of unbalanced resource allocation which will not increase production, controlled by the loader, but reduces system productivity. For example, maximum productivity is achieved at the balance point where the loader is working at maximum production rate and supported with sufficient hauling trucks with acceptable bunching [9]. The idleness of trucks waiting in a queue can be reduced by applying the Just in Time (JIT) concept. However, Bernold and AbouRizk [10] mentioned a series of barriers to implementing JIT in construction supplies that depends heavily on road-based trucks exposed to the many traffic issues. Disturbances will ripple to the last process in the chain and can cause costly production losses. The key control variable in JIT delivery of RMC is the transit time. Therefore, a fleet planning has to consider the RMC batching capacity, concrete pouring rate at site and the variability in road-based delivery time.
Similar to manufacturing, construction adopted the concept of prefabrication through a globally distributed supply chain. The goal is to take advantage of price advantages, high labor skills, quality and weather differentials. Like manufacturing the construction industry struggles to coordinate the flow of material with its suppliers but faces unique challenges. Typically, an order from construction site triggers the off-site design and production of a divers set of supplies such as window sets or structural steel. While some material has a long lead-time do others need a just-in-time delivery with minimal delivery time. Therefore, real-time information flow, quality inspections and delivery have to be organized to coordinate the supplies with work progress at the site. For example, Hatmoko and Scott [1] developed a model to quantify the impact of supply chain delays on the performance of a building project. They showed that material, labor and information flows significantly affect project’s performance. In order to overcome the difficulty in coordinating the large number of divers material supplies, many research efforts focuse on testing of state-of-the-art IT in enterprise resource planning [2], supply chain logistics [3] and material management at field level [4]. Introduced in early 20th century, ready mixed concrete (RMC) has become a common method of supplying concrete in the developed world. Truck mixers are the key element of fresh concrete supply that link batching plant to the construction site by providing temporary storage. Although specific additives would postpone the hardening process, their high costs discourage the use. As
¹ PhD Candidate, School of Civil and Environmental Engineering, UNSW, Australia,
[email protected] , (*Corresponding Author) ²Assistant Professor, School of Civil and Environmental Engineering, Sharif University of Technology, Iran:
[email protected] 3 Assistant Professor, Dept.of Architectural Engineering, University of Seoul, Republic of Korea,
[email protected] 4 A/Professor, Dept. of Civil Engineering, Universidad Tecnica FSM, Valparaiso, Chile,
[email protected]
31
Comparative Study of GPS-Integrated Concrete Supply Management using Discrete Event Simulation
For the purpose of studying concrete placement performance, this paper decomposes RMC supply chain into four parts namely: a) Raw material (i.e., rock quarry, cement plant), b) batching, c) fresh concrete delivery and d) the pump-placement. It is assumed that the ready mix plant has large strategic storage facilities for its main resource materials ensuring an uninterrupted batching on demand. The batch production of concrete involves sophisticated equipment for transporting, weighing and mixing the desired ingredients according to several standard recipes that are requested by the contractor. A fleet of truck mixers perform the delivery. While the batch plant control room is responsible to dispatching the correct mix and amounts for a truck, truck driver discharge the concrete from the drum into a chute, bucket (skip) or a pump hopper. The discharge rate (m3/hr) is tied to the placing speed of concrete crew. An example of a special constraint dictating the discharge rate is the wall. Here the hydrostatic pressure of concrete that is poured too quickly might cause the formwork to leak or even break apart. Finally, the limited space available in cities might lead to a situation where only the unloading truck is allowed on site.
following arrives before the preceding truck has left, it has to begin cycling around the site much like an airplane arriving too early in the target airport. In this case, the truck will return to the “gate” at uncertain time intervals until the unloading space is empty. On the other hand, extending off-site waiting of the truck in order to assure immediate service at site may result in idleness of the onsite resources. Both situations contribute to wasted time despite the main function of a queue to prevent idleness of the process to be served. Discrete event simulation is an excellent tool to study the effect of an off-site waiting queue by comparing two scenarios: a) Off-site waiting, and b) on-site zero-queue. In either case, a full truck arriving at the construction site when the unloading space is not empty will be sent on a short but random-duration roaming circle. This is repeated until it finds an empty space. III. MATHEMATICAL MODEL OF SUPPLY PROCESS Results of an AHP survey (Appendix A) showed that the most critical factors for an efficient concrete delivery process are “hauling” and “site preparedness to accept arriving trucks”. Accordingly, those two issues are most important elements for studying the performance of ready-mix concrete delivery systems while the batch plant can be considered deterministically. In this model concrete is hauled by trucks having fixed capacities between origin and destination. Let H 1,..., m be a set of available trucks with a capacity Qh for each h H . Delivery trucks repeat the cycle several times till all ordered concrete is delivered. n is the variable counts each truck’s cycle number. Let G (V , A) represents hauling tasks graph with vertex V 0,1,2 , where 0 stands for batching plant, 1 represents off-site queue and 2 is consumption point. The arc set is defined as A i, j : i, j V , i j . According to the two fundamental possible routes 0-1-2-0 and 0-2-0 totally four arcs named 0,1 , 1,2 , 0,2 and 2,0 exist in studied problem. Apparently repetitive routes like 0-1-2-R-2-0 or 0-2-R-20 are contingent when a delivery truck meets site but finds another truck is being served. R in repetitive routes refers to “Roaming” in the simulation model and adds a fifth arc i.e. (2,2) to the network. uijn, h determines if an
II. PROBLEM DEFINITION Tang et al. [11] observed that “on the whole, the causes of unsatisfactory concrete delivery are more likely due to the lack of precise site planning rather than the scheduling at the concrete plant.” Indeed, all process models used to study efficiency of repetitive delivery tasks include a queue (on-site queue). A queue is a spatial resource that enables entities to wait before being accepted by the next object in the process flow. Considering queue as a resource facilitates the study of its constraints. Actually, limited space on-site and traffic rules are the two main reasons for restricting the waiting queue. For example, in daytime heavy vehicles might be prohibited to occupy an entire traffic line in a downtown area. Night-work is a potential solution but increases cost of supply, added safety measures, lighting problem, noise and surcharges for nighttime work. Jackson [12] believes that adequate lighting, traffic control devices, and public involvement are the key components of nighttime road work. Arditi et al., [13] showed that the nighttime construction is more hazardous than the daytime construction. Furthermore, Hinze [14] also questioned the reliability of “material delivery” in nighttime construction. In conclusion, despite higher cost, the possible increase in efficiency of a nighttime strategy is not a given. An alternative is to create a waiting area for queuing the trucks outside the restricted area (off-site queue). The major difference between on-site and off-site waiting queues is the timing of queue entry and exit. While a full truck leaves the on-site queue immediately after the preceding truck completed its service a truck waiting in an off-site queue exits the queue earlier with sufficient time left to finish the last segment of the delivery. However, the travel time between the off-site waiting area and the construction site fluctuates according to traffic conditions making an accurate prediction impossible. If a
individual arc is included in the route traversed by truck h in its n th cycle or not. uijn,h 1 if arc i, j is passed otherwise it equals zero. Each arc i, j A has a positive length which is associated to a cost cijn, h regarding to the time, truck h spends to traverse between
i
and j in n th
cycle. In a static point of view cijn, h can be replaced with a constant determined according to averaged historic data. In a dynamic viewpoint, this cost is varying in time with respect to traffic load and availability of service machine at site. As explained, a truck approaching to the site should find server idle to enter the site otherwise should keep hauling and return to site later to check for a service. Dd i denotes a commodity vector where positive d i is 32 KICEM Journal of Construction Engineering and Project Management
Payam Rahnamayie Zekavat, Mohammad Mehdi Mortaheb, Sangwon Han and Leonhard Bernold
the amount of supplied concrete by vertex i , and d i is the amount of demand in corresponding vertex for negative d i s. Because the entire production is used,
iV
di 0
is
validated.
Where
d 0 d 2
and
d1 d1 0 if vertex 1 is included in the route. The
costing of delivery is based on the time it takes to complete an entire cycle that begins and ends at the batching plant. Total cost is calculated based on the hourly cost of a truck times the total cycle time [15]. For a truck h the cost per cycle ( uijn, h .cijn, h ) is the
FIGURE I STROBOSCOPE MODEL OF SCENARIO BASED OPERATION (OFF-SITE QUEUE IS CONVERTED TO ZERO-QUEUE POLICY BY OMITTING SHADED QUADRANGLE AND CONNECTING NORMAL RETURN TO FORK.)
(i , j ) A
summation of following components: a) Travel cost h M , where h is unit mileage cost and M is total mileage of trip. When a truck arrives to the site and finds server busy a roaming distance is added. The increasing cost is covered by M . b) Waiting cost hW , where h is unit waiting cost and W is the total waiting time in the trip because of waiting idle in a queue. Total delivery cost equals
Nh
hH
n 1
(i , j ) A
uijn, h .cijn, h
FIGURE II ANYLOGIC MODEL OF CONCRETE DELIVERY OPERATION (OFF-SITE QUEUE IS CONVERTED TO THE ZERO-QUEUE POLICY BY OMITTING SHADED QUADRANGLE AND CONNECTING “DELAY” ACTIVITY “RETURN” TO “CHECKPOINT” WHICH IS A “SELECTOUTPUT” ACTIVITY.)
, where N h is number of
completed cycles by truck h at the end of delivery process. The problem is selecting between different routes to minimize total cost while keeping server busy as much as possible regarding to traffic limitations and conditions. Stochastic simulation can now be used to model and study with the effect of the many constraints.
The truck fleet consisted of 11 trucks. Collected time study data used for testing the simulation model is summarized in Table 1. As shown, no ‘Roaming’ was observed in the study which was attributed to the foreman’s approach in using the off-site queue. Waiting trucks were released from the queue in a manner to assure direct service upon arriving to the site. However, keeping trucks longer than necessary in the off-site queue caused server idleness. However, a ‘Roaming’ task had to be included to be able to run the model. ‘Roaming’ time is variable in time as a function of encountered traffic load. ‘Roaming’ time is random and short comparing to ‘Return’ time. Since nature of ‘Roaming’ was transportation, and the other two transportation activities (‘Return’ and ‘QueToSite’) had normal distribution, the same distribution was selected for ‘Roaming’. Distribution parameters of ‘Roaming’ set to a fraction (η) of ‘QueSiteTra’ parameters because they both take place under the same traffic conditions. ‘CheckPoint’ is another key component of the model. It represents a decision node where availability of the “concrete pump” is checked. It takes no time to make a decision either to send the entity to construction site or to delay by sending it to ‘Roaming’. Note that, in contrast to off-site queue where ‘Return’ terminates when hauling vehicle enters off-site queue, ‘Return’ ends at ‘Checkpoint’ in zeroqueue scenario. Measured distributions fed to the model and η was adjusted in order to result in the production rate that satisfies two conditions: a) Precise production rate fairly close to field measurements, and b) leading to no ‘Roaming’. η=20% was selected with simulation result
IV. MODELING FOR DISCRETE EVENT SIMULATION Stochastic process simulation has become an accepted tool to study construction processes [16]. STROBOSCOPE [17] or Symphony [10] are two simulation software used for teaching and design. Figures 1 and 2 compare the models for STROBOSCOPE and a universal software called Anylogic [18]. V. TESTING OF SIMULATION MODEL A simulation model must be tested to ensure a sufficient representation of the real world. For that purpose, data was collected during the construction of a multistory building located in Sydney’s central business district (CBD). Because of space and traffic limitations only one truck could be unloaded at the one time. For this reason, an off-site waiting queue 2.4 kilometer from the site was established.
33 Vol.4, No.2 / Jun 2014
Comparative Study of GPS-Integrated Concrete Supply Management using Discrete Event Simulation
and normalized ‘Return’ time= 1, the server is idle 92% of the time decreasing to 74% when the normalized ‘Return’ time is reduced to 0.125. For a fixed ‘Return’ period and a increasing fleet size production raises with a constant slope until a fracture point. As shown, changing ‘Return’ times always produce similar slopes. For small fleets, the length of time spent on the ‘Return’ has a direct impact on the total cycle time that determines overall production. Thus, adding one truck increases production linearly. In contrast, adding one unit to a fleet of trucks far beyond the balance point [10] doesn’t affect hauling capacity as the bottleneck server dictates the upper limit. A fracture point is representative of the situation where dominant conditions shift from ‘Return’ time solely to combination of ‘Return’ time and hauling capacity. Production rate is less sensitive to ‘Return’ time in larger fleets as the trucks spend more time in the waiting queues while the pump is being kept busy. At the same time, the effect of the random distribution of return time is getting smaller. The overall goal is to assign a number of trucks sufficient to keep the concrete pump continuously busy.
of 5.5 truck unloaded per hour which was reasonably close to actual rate of 5.3 truck per hour. TABLE I MODELING TASK DURATION (SECONDS) Task Distribution Parameters Start point End point Return Normal µ = 5093, σ = 816 Site Off-Site Queue QueSiteTra Normal µ = 577, σ = 97 Off-Site Q Site ueue Roaming η.(QueSiteTra Paramet ers) N/A* Site Site 0 < η < 1 i.e. 20% Service Cauchy µ = 713, σ = 54 N/A N/A ٭ACCORDING TO OBSERVATION NO ROAMING OCCURRED
The initial condition is defined as the rate that trucks join the off-site queue for the first time. It is common in concrete delivery (as well as other similar costumer-teller processes) to assume that considerable fraction of hauling entities is available at initial scene. The largest observed time interval between two trucks that joined the off-site queue at the start-up stage was about 5% of the measured mean return time. Figure 3 shows the results of a sensitivity analysis on the average production rate as a function of the initial availability of trucks. It shows that within a normal range of 5% its effect is negligible. To make it statically reliable, each simulation condition was replicated 100 times and average outputs were reported throughout the paper.
FIGURE IV ENVELOPE OF PRODUCTION RATE VERSUS RETURN TIME AND FLEET SIZE
VII. COMPARATIVE ANALYSIS OF OFF-SITE QUEUE SITUATIONS
Figure 5 provides a graphical comparison between hauling fleets with and without off-site queues. Two curves represent each fleet size with different regimes producing a family of curves. The first regime called ‘parallel’ refers to the situation that zero-queue policy is absolutely preferable to off-site queue. Production rate tends to be constant because the concrete pump is operating continuously. Oversized fleet and shorter travel times ease development of parallel condition where zeroqueue policy should be selected. Intensifying effective factors dominates parallel regime in a larger region. The ultimate situation referring to infinity ‘Return’ time is called ‘identical’. Undersize fleet brings formation of ‘identical’ regime forward. As illustrated in Figure 5, regardless of ‘Return’ time, two approaches don’t differ significantly in ‘identical’ regime. In this case actually no off-site queue forms and each truck will be sent directly to construction site. ‘Transition’ phase describes the unsteady section between two extreme regimes and is
FIGURE III EFFECT OF INITIAL CONDITIONS ON MEAN PRODUCTION RATE
VI. WHAT-IF ANALYSIS Figure 4 presents the variation of production rate with respect to travel time and fleet size. General trend is that production rate increases as fleet size enlarges and ‘Return’ time shortens. A normalized ‘Return’ time is used in the graph presented in figure 4. The normalized ‘Return’ time was obtained by dividing each number over the maximum observed ‘Return’ time (7302 Seconds). It’s practical to categorize ‘Return’ time into short and long in order to develop a guideline to select among queuing policies. ‘Service’ time is a proper bottom line to compare different ‘Return’ times. For example, with only 2 trucks 34
KICEM Journal of Construction Engineering and Project Management
Payam Rahnamayie Zekavat, Mohammad Mehdi Mortaheb, Sangwon Han and Leonhard Bernold
FIGURE V WHAT-IF ANALYSIS OF OFF-SITE QUEUE
more common in the medium size fleet with moderate ‘Return’ time. The two curves graphing the hourly production using 50 trucks with or without an off-site queue are parallel with the zero-queue resulting in a higher output of approximately 5 trucks per hour. This indicates that 50 units far exceed the balance point and the pump is “bottlenecking” the production. On the other hand, changing the return time for 20 trucks without an off-site queue moves the production from the left- to the right side of the balance point resulting in a large drop. Curves for 5 and 2 trucks show the effect of migrating further left while a fleet of 5 passes through all 3 phases and determines the threshold for using off-site queue. Of course the zero-queue policy performance is anticipated to be higher or at least the same as off-site queue. It is interpreted as the effect of extra uncertainty by adding a waiting time to the cycle. Simulation results confirm that an off-site queue is an uncertain component to be included in the process. In this case, separation from construction site is the main source of uncertainty. Efforts required to coordinate such a separated component with whole system reduce production rate more than what actually achieved by regulating hauling equipment. This is the reason leading to lower efficiency of an off-site waiting queue as fleet size increases. Since an off-site queue does
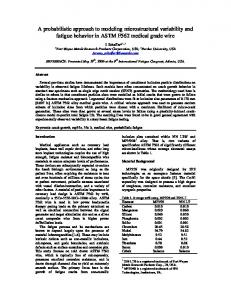
not affect service time uncertainty, arriving trucks may find the server busy even after standing in the off-site queue. However, application of state-of-the-art communication technologies to coordinate between site, off-site queue, and hauling road is essential for the effective use of the off-site queue. It should be noted that the simulation model does not consider that the number of trucks could affect the “normal” traffic. This assumption is quite rational when the number of trucks is comparatively small. A more extensive study would be needed if the fleet itself would contribute to the congestion thus adding to the travel time. VIII. GPS BASED TRUCK MANAGEMENT TO MITIGATE PROCESS WASTES It was discussed that the uncertainty about traffic and travel time are fundamental deficiencies that diminish the effectiveness of managing the fleet and concrete placement. It’s hypothesized that by bridging the communication chasm between tucks, batch plant and site, the off-site queue can be converted into an effective fleet regulator. Figure 6 depicts the architecture of a needed communication system to include truck-embedded
FIGURE VI DESIGN OF TRUCK-TRACKING SYSTEM
35 Vol.4, No.2 / Jun 2014
Comparative Study of GPS-Integrated Concrete Supply Management using Discrete Event Simulation
GPS units, ruggedized user interface at site and a mobile Short Message Service (SMS). Real-time GPS data can be used to enhance probabilistic models [19] to improve the accuracy in controlling process time and cost. In addition, trucks’ travel data can be fed to existing models such as [20-21] to evaluate carbon footprint of the hauling process. For this study, it is assumed that the real time position of each truck is communicated live to the concreting foreman at site. The simple processing of the data will provide information about travel time and route details from batching plant to the site, number of trucks waiting in the off-site queue, and travel time from off-site queue to the site for the truck currently being served. This information provides a clear understanding of hauling fleet performance to the concrete foreman and supports him in adjusting on-site work speed, if possible. A typical live route visualization is depicted in Figure 7. The GPS agent, included in Figure 6, is able to provide real-time
position and time information to the off-site queue management agent (OMA) programmed to use decision making algorithms to trigger text messages to the corresponding truck driver waiting in the off-site queue. OMA still has to allow for deviation from average measured travel time from off-site queue to the site. Of course, with the use of real-time information, the decisions should be more reliable. In order to assess the effect of creating a GPS supported communication network a new simulation model was established. For this, ‘CheckPoint’ and ‘Roaming’ were removed from the original model and delays in ‘QueSiteTra’ changed. Equation 1 was used to ensure that no roaming occurs and a truck is released from an off-site queue based on known service and travel times to the site (via GPS from the previous truck). Although more sophisticated algorithms could be used the algorithm to calculate delay suffices to demonstrate the impact of relying on real-time IT.
FIGURE VII INTERFACE OF ONLINE GPS TRACKING WEBPAGE BY MASTRERNAUT [22]
36 KICEM Journal of Construction Engineering and Project Management
Payam Rahnamayie Zekavat, Mohammad Mehdi Mortaheb, Sangwon Han and Leonhard Bernold
Delayi 1 MaxQueSiteTrai 1 , Servicei Conditions: Delay1 QueSiteTra1
X. SUMMARY AND CONCLUSION (1)
The time-depended JIT supply of critical resources feeding an on-site process on a congested urban construction site creates a unique challenge to the involved managers. Results of an AHP analysis confirmed the common understanding that traffic conditions and waiting times in the unloading queue are the most critical factors effecting both productivity and production of concrete placement. In order to study this interesting problem, a comprehensive mathematical model was developed. Instead of deriving explicit answers using mathematics alone, discrete event simulation was used to assess the consequences of traffic restrictions on the performance of hauling equipment. The concrete delivery process was simulated for a combination of varying fleet sizes and ‘Return’ times in order to assess the efficiency of implemented management alternatives. Taken together, off-site queuing did not provide significant advantages due to the lack of accurate information on the progress on site and the traffic on the last haul segment. Using the smooth stream of trucks controlled by the off-site queue can still be disrupted when, upon arrival on site, no space for unloading is available, sending the truck into “Roaming” circle. The second part of the paper discusses the effect of using advanced communication and real-time locating systems to reduce this uncertainty. It is shown how the off-site waiting queue becomes very effective in regulate delivery logistics. The added accuracy of truck arrivals decreased the waiting time of the concrete pump which, as a consequence, increased the productivity of the crew placing the concrete. GPS-integrated off-site queue management of delivery trucks in heavy traffic areas shows great promise to cut process wastes while elevating production rates.
Delay2 1.5 QueSiteTra2
Where Delayi represents the travel time from off-site queue to the site used in the ith iteration. QueSiteTraand Service are random numbers generated using measured distributions for off-site queue to site travel and unloading duration respectively. Simulation results show that connecting ‘islands of communication’ reduces server idle time by 13% and as predicted the average number of trucks waiting in the off-site queue was increased. That means that it is also possible to reduce number of hauling trucks which is true value to the concrete supplier. IX. ELECTRONIC CONSTRUCTION KIOSK As a wireless hub, Electronic Construction Kiosk (eCKiosk) is designed to link workfront to the project’s information network. Figure 8 depicts the hardware design of the eCKiosk consisting of a steel structure supporting a sun-protection roof and a 42 inch touchscreen. Although it basically works as information delivery tool it also provides a data collection platform. Indeed the main advantage of eCKiosk is its interactive design. eCKiosk facilitates interaction among ecommunication islands eliminating the need for a conventional paper-based information delivery. Data collected from different points of interest are retrievable through the eCKiosk upon demand. For example, information regarding real-time position of truck mixers or their arrival times or the amount of delays is communicated to the concrete foreman right at the workfront. GPS data in combination with traffic information records provide a reliable decision making tool for the batching plant as well as on site placement.
REFERENCES [1]
[2]
[3]
[4]
[5]
[6]
[7] FIGURE VIII THE eCKIOSK PROTOTYPE
37 Vol.4, No.2 / Jun 2014
J.U.D. Hatmoko, S. Scott, “Simulating the impact of supply chain management practice on the performance of medium‐sized building projects”, Construction Management and Economics, vol. 28, no. 1, pp. 35-49, 2010. E.W.L. Chan, “Action Research: the Use of Enterprise Resource Planning System in Construction Engineering and Project Management”, Journal of Construction Engineering and Project management, vol. 1, no. 3, pp. 19-27, 2011. T.H. Shin, S.W. Yoon, S. Chin, “A Construction Supply Chain Management Process with RFID/WSN-based Logistics Equipment”, Journal of Construction Engineering and Project management, vol. 2, no. 4, pp. 11-19, 2012. N. Kasim, “ICT Implementation for Materials Management in Construction Projects: Case Studies”, Journal of Construction Engineering and Project management, vol. 1, no. 1, pp. 31-36, 2011. M. Anson, S.L. Tang, K.C. Ying, “Measurement of the performance of ready mixed concreting resources as data for system simulation”, Construction Management and Economics, vol. 20, no. 3, pp. 237-50, 2002. M. A. Ammar, Y.A. Mohieldin, “Resource constrained project scheduling using simulation”, Construction Management and Economics, vol. 20, no.4, pp. 323-30, 2002. M. Park, W. Kim, H. Lee, S. Han, “Supply chain management model for ready mixed concrete”, Automation in Construction, vol. 20, no. 1, pp. 44-55, 2011.
Comparative Study of GPS-Integrated Concrete Supply Management using Discrete Event Simulation
[8]
[9]
[10]
[11]
[12]
[13]
[14]
[15] [16]
[17]
[18] [19]
[20]
[21]
[22] [23]
L.E. Bernold, “Simulation of non-steady construction processes”, Journal of Construction Engineering and Management, vol. 115, no. 2, pp. 163-78, 1986. S. D. Smith, “Earthmoving productivity estimation using linear regression techniques”, Journal of Construction Engineering and Management, vol. 125, no. 3, pp. 133-41, 1999. L.E. Bernold, S. AbouRizk, “Managing Performance in Construction”, Wiley, Hoboken, New Jersey, ISBN 978-0-47017164-6, 2010. S.L. Tang, K.C. Ying, M. Anson, M. Lu, “RMCSIM: A simulation model of a ready‐mixed concrete plant serving multiple sites using multiple truckmixers”, Construction Management and Economics, vol. 23, no. 1, pp. 15-31, 2005. J. Jackson, “Nighttime road construction: current issues”, Centre for Transportation Research and Education Iowa State University, 2005. D. Arditi, D. Lee, G. Polat, “Fatal accidents in nighttime vs. Daytime highway construction work zones’, Journal of Safety Research, vol. 38, no. 4, pp. 399-405, 2007. J.W. Hinze, D. Carlisle, “An evaluation of the important variables in nighttime construction”, Seattle, WA: Transportation Northwest, Department of Civil Engineering, University of Washington, 1990. L. Bernold, “Construction Equipment and Methods”, John Wiley & Sons, Inc., ISBN 978-0-470-16986-5, 2013. M.R. Manavazhi “Hybrid modelling framework for synthesizing virtual structures”, Construction Management and Economics, vol. 18, no. 4, pp. 415-26, 2000. J. Martinez, P.G. Ioannou, “General purpose simulation with stroboscope”, Proceedings of the Winter Simulation Conference, IEEE, Piscataway, pp. 1159–66, 1994. Anylogic Version 6 – Manual. XJ Technologies, http://www.xjtek.com/, 2008. C.T. Hyun, T.H. Hong, S.M. Ji, J.H. Yu, S.B. An, “The Development of Probabilistic Time and Cost Data: Focus on field conditions and labor productivity” Journal of Construction Engineering and Project management, vol. 1, no. 1, pp. 37-43, 2011. K.J. Yi, “Modelling of On-Site Energy Consumption Profile in Construction Sites and a Case Study of Earth Moving”, Journal of Construction Engineering and Project management, vol. 3, no. 3, pp. 10-16, 2013. A.M. Hajji, M.P. Lewis, “Development of Productivity-based Estimating Tool for Fuel Use and Emissions from Earthwork Construction Activities”, Journal of Construction Engineering and Project management, vol. 3, no. 2, pp. 58-65, 2013. Masternaut Connect, http://www.masternaut.com. T.L. Saaty , “The Analytical Hierarchy Process: Planning, Priority Setting, and Resources Allocation”, McGraw-Hill, New York, 1980.
38 KICEM Journal of Construction Engineering and Project Management
Payam Rahnamayie Zekavat, Mohammad Mehdi Mortaheb, Sangwon Han and Leonhard Bernold
APPENDIX A: ASSESSMENT OF IMPORTANCE AND CONCERNS USING AHP Finally these pair-wise studies converted to weights determining the priorities of attributes. Consistency ratio (Equation A-1) is a tool to check if comparison matrices are statistically reliable or not. Only matrices with consistency ration less than 10% are statistically acceptable which is respected in this study.
A Typical concrete mixing, delivery and pouring process is analyzed using Analytic Hierarchy Process (AHP) to determine effect of each task on process performance. Tasks ranked higher are included in the process modeling while low prioritized components are excluded. AHP is a structured method to organize and make complex decisions. Established by [23] based on mathematics and psychology AHP was used in wide range of subjects from economy, industry and health to education. AHP helps to find the solution which is most consistent whit predefined objectives. AHP provides a cognitive and rational framework to built decision problem, define and measure effective factors, understand the relationship between parameters and goals, and assess alternatives. Upon reviews of available literature regarding concrete delivery, informal negotiations with twelve PhD candidates in Construction Engineering and Management at UNSW (Coming from different countries they collectively had many years of work experience), and authors’ self-experience a collection of parameters was determined as influential factors on concrete work productivity. Then wi which is each attribute weight in achieving final objective calculated from AHP. Figure A1 depicts hierarchy of influence to establish attributes’ interdependency and facilitate their analysis through AHP. Next step is pair wise comparison of attributes in each hierarchy level. Mean of statistically acceptable opinions was used to determine each attribute’s weight and develop comparison matrices. These matrices are produced by pair-wise comparison of attributes in each hierarchy stage based on Saaty’s proposed scale. Each array of preference matrix indicates how much characteristic on that row preferred upon attribute placed on corresponding column.
CR CI / RI
Where RI random index is approximated by Saaty, and CI is consistency index defined as below: CI (max n) /(n 1)
(A-2)
Where max is the maximum Eigenvalue for a given matrix and n is the matrix dimension which is the number of attributes included in that matrix. AHP weights are reported in Table A1, however, based on self-expertise an individual user may adjust these weights. Current study highlighted that ‘traffic condition’ and ‘trucks standing idle in the queue’ are two main barriers against efficient concrete work. It’s shown that special care is required regarding on-site placing and hauling. This significant influence justifies the necessity of complete understanding of how traffic load, condition and limitation affect total work outcome. The problem is more serious when a traffic limitation influence queue condition, in such a case the most two effective parameters are combined and inappropriate management may block total procedure and cause significant loss. The survey also found that similar to existing observations the most important task in batching plant was ‘weighting’ while ‘price’ and predicting its ‘fluctuation’ were the main concerns in raw material supply chain.
FIGURE A-I HIERARCHY OF ATTRIBUTES
39 Vol.4, No.2 / Jun 2014
(A-1)
Comparative Study of GPS-Integrated Concrete Supply Management using Discrete Event Simulation
TABLE A-I AHP WEIGHTS FOR EACH STAGE AND CATEGORY Stage and Category
Weight %
I- In-Site Placing A. Project Type B. Site Position C. Queue D. Placing Method E. Unloading II- Hauling/Delivery F. Distance G. Traffic Condition H. Limited Number of Trucks I. Scheduling J. Operation Cost III- Batching Plant K. Storage L. Material Transport M. Weighting N. Mixing O. Loading P. Managerial Action Q. Response to Site Condition R. Quality Tests IV- Raw Material S. Price T. Availability U. Down-stream Supply
26.2 1.3 2.0 14.0 5.3 3.4 59.0 2.9 26.1 14.9 10.2 5.0 9.8 0.4 0.2 2.1 0.9 0.4 3.2 1.3 1.1 5.2 3.4 1.3 0.5
40 KICEM Journal of Construction Engineering and Project Management