a n a ly s i s
Probabilistic modeling of Hi-C contact maps eliminates systematic biases to characterize global chromosomal architecture © 2011 Nature America, Inc. All rights reserved.
Eitan Yaffe & Amos Tanay Hi-C experiments measure the probability of physical proximity between pairs of chromosomal loci on a genomic scale. We report on several systematic biases that substantially affect the Hi-C experimental procedure, including the distance between restriction sites, the GC content of trimmed ligation junctions and sequence uniqueness. To address these biases, we introduce an integrated probabilistic background model and develop algorithms to estimate its parameters and renormalize Hi-C data. Analysis of corrected human lymphoblast contact maps provides genome-wide evidence for interchromosomal aggregation of active chromatin marks, including DNasehypersensitive sites and transcriptionally active foci. We observe extensive long-range (up to 400 kb) cis interactions at active promoters and derive asymmetric contact profiles next to transcription start sites and CTCF binding sites. Clusters of interacting chromosomal domains suggest physical separation of centromere-proximal and centromere-distal regions. These results provide a computational basis for the inference of chromosomal architectures from Hi-C experiments. The structures of chromosomes and the interactions among them are a fundamental component of any physical model of gene and genome regulation. Chromosomal organization has therefore been explored for many decades using methods that vary in scale and resolution1–4. The inherent throughput limitations of the traditional visual methods for quantifying chromosomal structure have been alleviated over the last few years with the development of the chromosome conformation capture (3C) technique for quantifying contact probabilities between specific loci5–7, and with the initial scaling of this technique to assays quantifying the contacts of one locus versus the entire genome8,9. The recent exciting introduction of the Hi-C method10 for mapping pairwise contacts on a genomewide scale means that high-throughput genomic techniques may soon pave the way to physical and quantitative three-dimensional models of genome regulation. Department of Computer Science and Applied Mathematics, Weizmann Institute of Science, Rehovot, Israel. Correspondence should be addressed to A.T. (
[email protected]). Received 16 February; accepted 25 August; published online 16 October 2011; doi:10.1038/ng.947
Nature Genetics VOLUME 43 | NUMBER 11 | NOVEMBER 2011
To fulfill this promise, 3C techniques and their derivations must become robust and quantitative. The complicated experimental procedure that includes fixation, digestion, ligation and amplification or capture of 3C or Hi-C products necessarily carries with it numerous biases and experimental artifacts11. As the experimental readout becomes more extensive (from few quantitative PCR readouts in a typical 3C experiment, to billions of sequenced bases in a Hi-C experiment), the need for comprehensive computational modeling and the ability to develop powerful statistical approaches increases markedly. In this analysis we introduce an integrated probabilistic model for analyzing Hi-C experiments, working toward identification of the major systematic biases in the experiment and developing tools for robust interpretation of the data following their normalization. Using the new tools, we reanalyze lymphoblast Hi-C data from experiments that employed two different restriction enzymes and show that normalized replicates are robustly comparable. Normalized Hi-C contact maps provide genome-wide evidence for trans clustering of hypersensitive sites and transcriptional foci, and reveal remarkable enrichment of long-range cis contacts at active promoters. Furthermore, the data allow the quantification of symmetry breaking in contact probability decay near active transcription start sites (TSSs) and binding sites of the insulator binding protein CTCF, and uncover a partitioning of the transcriptionally nonactive fraction of the genome into a centromereproximal cluster and a centromere-distal cluster. With the expected continuous improvement in sequencing depth, higher resolution normalized Hi-C contact maps have the potential to transform our understanding of chromosomal architecture. RESULTS Source of systematic biases in Hi-C experiments Hi-C experiments are designed to measure the contact probability between different chromosomal loci on a genome-wide scale. This is done by cleaving fixed chromosomes into restriction fragments using six-cutter restriction enzymes and ligating fragment ends to form ligation junctions connecting two loci that are nearby in three-dimensional space. These junctions are further processed (by shearing, biotin-based enrichment and size selection) to generate a pool of trimmed ligation products for paired-end sequencing. In a recent innovative work, GM06990 human lympho blast cells were assayed using two types of restriction enzymes,
1059
a n a ly s i s
Mapping
300K 200K 100K
e
f
HindIII
0.60
PCR + sequencing
NcoI
GC-rich GC-poor
0
0.40
0.45
–1.0
0.35
0.40
–2.0 –3.0
0.20
0.35 0.20
GC content
Fragment length
g
1.0
0.60
0.45
20
10 0 1, 00 2, 0 00 0 4, 00 0 10 ,0 00
0
2, 0 00 0 4, 00 10 0 ,0 00
10
00
Fragment length
–7.2
–4.0
10,000
Mapping
h
–4.0
60
–3.0
1,000
Sum of distances to cutter sites (d1+d2)
0.
–2.0
100
100
0.
100
10,000
GC content
HindIII
NcoI 1.00
1.00
1.0
Enrichment (log2 scale)
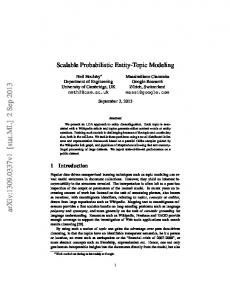
generating 29 million reads linking 1.67 million potential HindIII restriction fragments and 28 million reads linking 1.5 million NcoI restriction fragments 10. We survey several potential sources for biases in the complex Hi-C experimental procedure and demonstrate how these biases affect the two replicate experiments under study (Fig. 1). As the strongest phenomenon affecting global contact probabilities is the chromosomal territory effect, we study biases affecting interchromosomal (trans) contacts separately from those affecting intrachromosomal (cis) contacts. We first observed that part of the Hi-C sequence pairs is likely to represent ligation products between nonspecific cleavage sites rather than restriction fragment ends. As shown (Fig. 1a,b), 22% of the trans read-pairs in the HindIII experiment and 12% in the NcoI experiment were mapped with a generally uniform distribution over the restriction fragments, in contrast to the majority of reads that mapped with the expected distribution within 500 bp (the size selection parameter) of the nearest restriction site. The cleavage and ligation events that generated these reads are unlikely to have occurred on cutter sites. We therefore discard them from downstream analysis. Another potential source of Hi-C bias is the length of restriction fragments (in other words, the distance between adjacent cutter sites). For example, long and short fragments may have variable ligation efficiencies or compete differently on ligations with cis and trans fragment ends 1060
Percentage mappability
0 Figure 1 Sources of Hi-C biases. (a,b) Spurious ligation products. Hi-C ligation products (shown –1.0 0.75 0.75 schematically in a) are expected to map near –2.0 restriction sites because of size selection. The sum –3.0 0.50 0.50 of distances from mapped Hi-C sequences to the Mappable sequence –4.0 nearest restriction sites was computed for each 0.50 0.75 1.00 0.50 0.75 1.00 Percentage Percentage Hi-C paired read, and the distribution of distances mappability mappability was reconstructed (b). Two distinct populations of reads are observed, one distributed as expected for normally ligated and size-selected products (HindIII 78%, NcoI 88%) and one including reads mapped farther away from restriction sites. (c,d) Fragment lengths and ligation efficiency. Restriction fragments of different lengths are shown schematically in c and can be hypothesized to affect crosslinking and ligation efficiency. The trans Hi-C coverage enrichment is defined as the ratio between the observed number of trans contacts and the total number of assayed fragment pairs. Shown are coverage enrichments for all of the fragment ends, binned into 20 equal-sized bins according to fragment length (x and y axes). Similar trends are observed for the HindIII and NcoI experiments. (e,f) Local GC content and Hi-C coverage. Ligation product processing and sequencing may be biased by GC content (e). Trans-contact enrichments (f) stratified according to the GC content of the 200 bp near the restriction fragment ends show intense and contrasting GC biases for the HindIII and NcoI experiments. (g,h) Effect of sequence uniqueness. Different fractions of uniquely mappable short tags are observed next to restriction sites (g). As shown in h, this has a direct empirical linear effect on Hi-C coverage. Percentage mappability
© 2011 Nature America, Inc. All rights reserved.
–1.0
2,000 1,000
1,000
1,
Fragment length
2,000
1.0 0
4,000
1,000
Enrichment (log2 scale)
4,000
–6.1
NcoI 10,000
400K
Sum of distances to cutter sites (d1+d2)
Enrichment (log2 scale)
HindIII
500 bp
600K
0K 100
d2
10,000
Long fragment
200K
0K
d1
800K
35 0. 40 0. 45 0. 60
Nonspecific product: (d1+d2) > 500 bp
500 bp
GC content
d2
Intermediate fragment
1,000K
400K
No. reads
d1
d
Short fragment
1,200K 500K
0.
Ligation
c
NcoI Specific Nonspecific 88% 12%
HindIII Specific Nonspecific 78% 22%
0. 2 0. 0 35 0. 40 0. 45
b
Biotin adapter
No. reads
a
(Fig. 1c). As shown (Fig. 1d), restriction fragment lengths are indeed correlated with trans-contact probabilities. Notably, although the effect is nonlinear (and the fragment pools in the two experiments are different), the bias is highly reproducible (HindIII versus NcoI element-wise Spearman’s ρ = 0.96). The effect of fragment lengths on cis-contact probabilities was also reproducible between experiments but was shown to be markedly different from the trans effect (Supplementary Fig. 1). A known major source of bias in sequencing experiments is the nucleotide composition of the DNA under study12,13. We outline key steps in the Hi-C procedure that are likely to be affected by the GC content near the ligated fragment ends (Fig. 1e). Analysis of the correlation between the GC content of the 200 bp next to the restriction site and the probability of trans contact (Fig. 1f) shows that GC content is a source of incompatibility between the replicates. The GC-content bias maps for the HindIII and NcoI data sets were inversely correlated (element-wise ρ = −0.14), providing a partial explanation for a global low correlation between the derived trans-contact maps. A final genomic variable affecting trans-contact probabilities in a purely technical fashion is the mappability (or genomic uniqueness, see Online Methods) of the fragment ends (Fig. 1g). Mappability is predicted and confirmed (Fig. 1h) to have a linear effect on the estimated trans-contact probabilities. In summary, we characterize several sources of potential systematic bias VOLUME 43 | NUMBER 11 | NOVEMBER 2011 Nature Genetics
a n a ly s i s
0.4 0.3 0.2 0.1 0
� = 0.19
–53.3M
L = 200
–53.4M –53.5M –53.6M 10
5 10 15 NcoI no. reads
200
250
100 150 Chromosome 1 (Mb)
200
250
Log likelihood
� = 0.8
–105.9M –106.0M
HindIII 0.45 0.41
L = 200
–106.1M 10
−0.5 0.5 NcoI log ratio
f
50
−0.5
–105.8M
Normalized contact enrichment (log2 scale) 1
0.38
0
0.36 0.36 0.38 0.41 0.45 GC content (1 Mbp)
–1
1K 1M 10M GC window size NcoI
GC content (1 Mbp)
100 150 Chromosome 1 (Mb)
0.5
1K 1M 10M GC window size NcoI
Normalized 1D coverage
GC content (1 Mbp)
0.4 0.2 0 −0.2 −0.4
5
0
HindIII log2 ratio
NcoI HindIII 1D coverage 1D coverage
HindIII log2 ratio NcoI log2 ratio
© 2011 Nature America, Inc. All rights reserved.
0.2 0.1 0 −0.1 −0.2
HindIII
10
0
9 8 7 6 5 12 10 8 6 4 50
c
−4 −3 −2 −1 0 1 Correction factor (log2)
Fragment strand Opposite strand (control)
Raw 1D coverage
15
Predicted
Observed
e Log likelihood
0.4 0.3 0.2 0.1 0 −4 −3 −2 −1 0 1 Correction factor (log2)
b
d
NcoI Density
Density
HindIII
HindllI no. reads
a
0.45 0.41 0.38 0.36 0.36 0.38 0.41 0.45 GC content (1 Mbp)
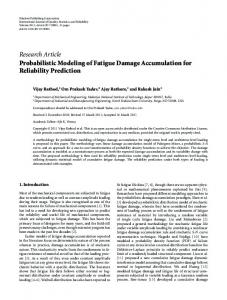
Figure 2 Model performance. (a) Shown are distributions of the model correction factors for all combinations of fragment end pairs. The ratio between the tenth and ninetieth percentiles (dashed lines) is over sixfold for both data sets. (b) Observed (black) and model-predicted (red) trans 1D coverages are depicted along chromosome 1 in 1-Mb resolution, showing low correlation between HindIII and NcoI. (c) After normalization, the correspondence between the HindIII and NcoI 1D enrichments (ratios of observed and expected coverage) is significantly improved. (d) Observed trans 1D coverage profiles in NcoI (x axis) and HindIII (y axis) are depicted on the top, showing poor reproducibility ( ρ = 0.19). The normalized coverage profiles (ratio of observed to expected reads) are substantially more consistent (bottom, ρ = 0.8). (e) Shown in black are the log-likelihood scores of the Hi-C probabilistic model (y axis) as a function of the size of the GC-content window used (x axis). For both replicates, a clear peak is detected when computing GC content using 200 bp (roughly half the size-selection parameter) upstream of the fragment end. No such preference is observed when computing GC content using the sequence downstream of the restriction site (red). Log-likelihood score of a model lacking GC correction is shown as a baseline (dotted lines). (f) Shown are normalized contact enrichments stratified by regional GC content of the contacting fragment ends. Contacts between fragment ends with similar GC content are enriched. This correlation is observed even though local GC contact is normalized.
in the Hi-C data sets, showing that in some cases their effect may decrease the correlation between replicate experiments. A probabilistic model for Hi-C contact maps normalization To account for the different sources of biases discussed above, we defined a multiplicative probabilistic model that computes the prior probability of a trans (and, separately, cis) contact between two fragment ends given their mappability, fragment length and GC content. We developed an algorithm to estimate maximum-likelihood model parameters given an empirical raw contact map (Supplementary Fig. 2) and applied it to the HindIII and NcoI maps separately. By combining the different effects into one correction factor per pair of fragment ends, the model predicts a sixfold difference between the chance of covering ligation pairs with favorable (upper 10%) and unfavorable (lower 10%) fragment parameters (Fig. 2a). We used distributed computing to calculate the expected coverage for each of the ~1 × 10¹² potential ligation events in the genome and derived normalized trans-contact maps by dividing the observed number of contacts between 1-Mb chromosomal bins by the expected number of contacts predicted by the model for these regions (Online Methods). We found that the overall element-wise correlation among trans-contact maps changes from ρ = −0.11 on raw counts, to ρ = 0.37 on raw counts normalized by number of fragment pairs per chromosomal bin, to ρ = 0.59 after full normalization (Supplementary Fig. 3). To visualize the consistency of the derived maps we plotted the Nature Genetics VOLUME 43 | NUMBER 11 | NOVEMBER 2011
total number of trans contacts involving each of the chromosomal bins (one-dimensional or 1D coverage). We found that the observed 1D coverage profiles of the two replicates were poorly reproducible (Fig. 2b,c, ρ = 0.19). We then divided the raw 1D coverage by the model-expected number of trans contacts and plotted the normalized profiles, revealing a highly reproducible behavior (Fig. 2d, ρ = 0.8 for all chromosomes). The probabilistic model therefore captures core experimental biases affecting Hi-C coverage, allowing the normalized contact maps to be interpreted robustly and in a reproducible way. Trans contacts associate GC-content domains Regional GC content (computed over 1-Mb windows) is highly correlated with numerous large-scale genomic features, including gene density, banding patterns, repetitive content, epigenetic marks and more. In contrast, the probabilistic Hi-C model is designed to control for technical amplification biases associated with local-sequence GC content (over a few hundred bases). It is therefore important to verify that the model does not indirectly cancel potential physical contacts between chromosomal regions with high or low regional GC content. We addressed this question by computing the likelihood of the model when computing GC content in windows of increasing sizes upstream of the restriction site. For control we used the GC content of windows downstream of the restriction site (as these are not being processed during the experiment). We found that the model predicts 1061
a n a ly s i s
H3K4me1
600K 400K 200K
H3K4me3
PolII
–5 kb Active TSSs Inactive TSSs
d 50–100K 20–50K 10–20K 5–10K 1–5K
Gene view 0.8 0.6 0.4 0.2 0 −0.2 −0.4
0–1K
0– 1 1– K 5– 5K 1 10 0K – 20 20K 50 –50 –1 K 0 >1 0K 00 K
1 1– K 5– 5K 10 10K – 20 20K 50 –50 –1 K 0 >1 0K 00 K
0–
1 1– K 5– 5K 10 10K – 20 20K 50 –50 –1 K 0 >1 0K 00 K
0–
0–
1 1– K 5– 5K 10 10K – 20 20K 50 –50 –1 K 0 >1 0K 00 K
–1
0
Distance to peak
Downstream
Upstream
– –4 1M –200K –100K 00 –4 K –20K –10K 0 –5K K 5 10K 20K 40K 10 K 200K 400K 0K 1M
>100K
0 –5M M
–0.2
5 10M M
0 –0.1
Normalized contact enrichment (log2 scale) 1
Distance from TSS +5 kb
Figure 3 Chromosomal architecture around active chromatin. Upstream contact excess Downstream contact excess 0.30 (a) Fragment ends (NcoI) were binned according to the (promoter view) (gene view) Active TSSs distance to the nearest H3K4me3, H3K4me1, DNase0.25 Inactive TSSs hypersensitivity and RNA PolII peak. Bar graphs depict 0.20 the number of fragment ends in each bin. (b) Contact 0.15 TSS enrichment for a pair of bins is defined as the ratio between 0.10 observed and expected number of trans contacts between all fragment ends associated with the two bins. Enrichments 0.05 are further normalized by the average values for each row 0 and each column (top bar graphs, see Online Methods) and −0.05 Distance are depicted as color-coded matrices. In all cases the data from TSS reflect a preference for contacts between active foci (bottom left) and between regions that are remote from them (top right). (c) Shown are the differences in NcoI log2 enrichment values (y axis) when comparing cis contacts involving fragment ends up to 5 kb upstream of a TSS and controls. The data are generated for a set of spatial bins representing contacts over specific chromosomal distances (x axis), separately for TSSs that were marked as active (red) and inactive (blue). Confidence ranges represent propagated binomial standard deviation. (d) Same as c, but for fragment ends within 5 kb downstream of a TSS. (e) Upstream contact excess was computed by subtracting the downstream contact enrichments profile from the upstream contact enrichment profile. Downstream contact excess was defined conversely. The figure depicts a positive upstream contact excess from the promoter side of active TSSs, and a positive downstream contact excess from the gene side of active TSSs. Excess is observed strongly up to 40 kb, and more weakly for up to 1 Mb from the TSS.
e
the empirical data optimally when the GC content is computed from a 200-bp window upstream (but not downstream) of the restriction site (Fig. 2e). This trend is observed consistently for the HindIII and NcoI experiments despite their anticorrelated GC trends (recall Fig. 1f), implying that the model’s GC-content correction is adequately targeted at technical biases caused by local GC content. The corrected maps are therefore expected to maintain large-scale structures associating trans contacts with regional GC content or related genomic features, if such structures exist. The data (Fig. 2f) show consistent preferential contacts among chromosomal domains with low regional GC content and among domains with high regional GC content. The stringent design of the model assures that the clustering of domains with low and high GC content is independent of the local GC content of the sequenced fragments. We hypothesize that these contact preferences are driven by genomic and epigenomic factors that are themselves correlated with GC content, as we discuss next. Trans-chromosomal contacts around epigenetic hotspots A frequently discussed and studied aspect of nuclear architecture is the aggregation of chromosomal loci that are transcriptionally active4,14,15. We studied normalized Hi-C trans-contact maps to characterize such architectural features from a genome-wide (although low-resolution) 1062
5M 10 M
5K 10 K 20 K 40 K 10 0K 20 0K 40 0K 1M
M
–4 M 00 –2 K 00 –1 K 00 K –4 0K –2 0K –1 0K –5 K
–5
–1
–1
0M
Differential enrichment
© 2011 Nature America, Inc. All rights reserved.
Downstream
Distance from TSS
H3K4me1
0.1
–1
Upstream
–1
0– 1 1– K 5– 5K 1 10 0K – 20 20K 50 –50 –1 K 0 >1 0K 00 K
0– 1 1– K 5– 5K 10 10K – 20 20K 50 –50 –1 K 0 >1 0K 00 K
1 1– K 5– 5K 10 10K – 20 20K 50 –50 –1 K 0 >1 0K 00 K
DNase
0.2
Distance to peak
Contact enrichment
1D contact enrichment (log2 scale)
b
0–
0–
1 1– K 5– 5K 10 10K – 20 20K 50 –50 –1 K 0 >1 0K 00 K
0
Promoter view 0.8 0.6 0.4 0.2 0 −0.2 −0.4
5 10M M
PolII
– –4 1M –200K –100K 00 –4 K –20K –10K 0 –5K K 5 10K K 20 4K 100K 200K 400K 0K 1M
H3K4me3
0 –5M M
DNase
Contact enrichment
c
Genome partitioning
Number of fragment ends
a
perspective. Using data on the linear epigenomic makeup of human lymphoblast cells16, we partitioned Hi-C fragment ends into groups according to their distance to the nearest DNase-hypersensitive site (DHS), or the nearest H3K4me3, H3K4me1 or RNA polymerase (PolII) peak (Fig. 3a, Online Methods). We found that fragments near active chromatin marks are enriched for trans contacts and that regions remote from active marks were also more likely to self-interact than expected by chance (Fig. 3b). Stratified control for regional GC content confirmed that these enrichments cannot be explained merely by the known high regional GC content at active sites (Supplementary Fig. 4). Analysis of the correlation between trans contacts and histone marks, controlled for DHS occupancy, suggested that hypersensitivity may be associated with enriched contact probability more directly than other epigenetic marks, because regions proximal to DHS foci tend to be in contact even when other epigenetic marks are low, whereas the converse is usually not true (Supplementary Fig. 5, compatible with a recent report17). Taken together, normalized Hi-C maps provide genome-wide evidence for preferential aggregation of active chromosomal domains. Because multiple epigenetic factors are correlated with active chromatin, higher resolution analysis will be required to resolve the complex interplay between transcription, epigenetic marks and nuclear clustering. VOLUME 43 | NUMBER 11 | NOVEMBER 2011 Nature Genetics
b
d Downstream
Long-range cis contacts around active TSSs Analysis of the distribution of Hi-C cis contacts around active, H3K4me3-occupied TSSs demonstrates a specific local chromosomal architecture around transcriptionally active sites. As shown (Fig. 3c), the cis contacts involving restriction fragment ends located 0–5 kb upstream of an active TSS (that is, on the promoter side) are strongly enriched 20 kb to ~400 kb upstream and, in a weaker fashion, 40 kb to ~400 kb downstream of the TSS. This increase in the probability of long-range contacts may be associated with the active transcriptional state, as fragments located upstream of an inactive TSS show a much weaker enrichment over the controls. A mirrored phenomenon is observed when studying contacts involving fragment ends 0–5 kb downstream of an active TSS on the gene side (Fig. 3d). Fragment ends near the TSS (at both the promoter and gene sides) give rise to an asymmetric cis-interaction profile (Fig. 3e). Remarkably, even though the promoter and gene fragment ends used for reconstructing the cis profiles are only 5 kb apart on average (with a TSS separating them), the asymmetries of the resulting cis profiles are reversed. Excess upstream contacts are observed from the promoter side, and excess downstream contacts are observed from the gene side suggesting that active TSSs may participate in forming chromosomal boundaries. In summary, pooling together cis-contact profiles provides strong evidence for an architectural role of TSSs in organizing their surrounding domains and confirms the abundance of long-range cis-chromosomal contacts associating active TSSs with neighboring, potentially regulatory, loci. Asymmetric contacts around CTCF binding sites CTCF binding sites are studied extensively in the context of insulation of chromosomal domains and are hypothesized to provide chromo somes with a grid of highly organized anchor points facilitating domain demarcation and looping interactions18–20. Analysis of the trans contacts of fragment ends grouped according to their distance from a CTCF site reveals preferential clustering of the CTCF-bound region (Fig. 4a), in a way similar to marks associated with active Nature Genetics VOLUME 43 | NUMBER 11 | NOVEMBER 2011
3′
5M 10M
3′
Upstream contact excess (5′ adjacent view)
Downstream contact excess (3′ adjacent view)
0.15 0.10
CTCF
0.05 0
5K 10K 20K 40K 100K 200K 400K 1M 5M 10M
5′
Distance from CTCF +5 kb
5M 10M
–1M –400K –200K –100K –40K –20K –10K –5K 5K 10K 20K 40K 100K 200K 400K 1M
0.20
–5 kb
–10M –5M –1M –400K –200K –100K –40K –20K –10K –5K
0– 1 1– K 5– 5K 10 10 – K 20 20 50 –5 K –1 0K 0 >1 0K 00 K
5′
–1
3′ adjacent view Upstream
Downstream
Distance from CTCF
0
Distance to peak 0.5 0.4 0.3 0.2 0.1 0 −0.1
5′ adjacent view Upstream
–1M –400K –200K –100K –40K –20K –10K –5K 5K 10K 20K 40K 100K 200K 400K 1M
Distance to peak
c
0.5 0.4 0.3 0.2 0.1 0 –0.1
–10M –5M
Normalized contact enrichment (log2 scale) 1
0–1K 1–5K 5–10K 10–20K 20–50K 50–100K >100K
Contact enrichment
CTCF
0.2 0.1 0 –0.1 –0.2
Differential enrichment
1D contact enrichment (log2 scale)
a
Contact enrichment
Figure 4 Chromosomal architecture around CTCF binding sites. (a) Contact matrices were projected on genomic bins generated according to the distance to the nearest CTCF site (NcoI). Enrichment values (normalized as in Fig. 3b) are depicted as a colorcoded matrix (column averages are depicted on top). CTCF sites, but also regions that are remote from any CTCF site, are shown to interact more than expected by chance. (b,c) Shown are the normalized cis-contact profiles (computed as in Fig. 3c,d) for fragment ends located on the 5′ side (b) or the 3′ side (c) of CTCF sites. Increased contact probability is observed in a region up to 400 kb from the site, but contacts that are directly crossing the binding sites are depleted. (d) Upstream contact excess was computed by subtracting the downstream contact enrichments profile from the upstream contact enrichments profile. Downstream contact excess was defined conversely. The data show a positive upstream contact excess when analyzing fragment ends in the 5′ side of a CTCF site, and a positive downstream contact excess when analyzing fragment ends in the 3′ side of a CTCF site. Although the CTCF asymmetry profiles are similar to those observed near active TSSs, the two effects are observed independently, as shown in Supplementary Figure 6b,c.
–10M –5M
© 2011 Nature America, Inc. All rights reserved.
a n a ly s i s
Distance from CTCF
c hromatin (stratified control for DHS is shown in Supplementary Fig. 6a). Analysis of cis contacts involving fragments located 0–5 kb on one side of a CTCF binding site reveals contacts asymmetry that persists over a range of up to 400 kb, confirming the correlation between CTCF and organized local chromosomal domains (Fig. 4b–d). Notably, although 15–20% of the TSSs show evidence for CTCF binding, the contact asymmetries associated with CTCF sites and TSSs are observed independently (Supplementary Fig. 6b,c). The local changes in genome organization around CTCF sites are likely to combine with additional factors and form larger domains. Demarcation and isolation of such domains were previously attributed to inter actions with the nuclear membrane (or the nuclear lamina)21,22. We next studied trans-contact enrichment as a function of the chromosomal association with the nuclear lamina. Even though the analysis was based on fibroblast lamina interaction profiles (that are likely to be only partially conserved in lymphoblasts22), we found that laminabound and lamina-unbound regions show a tendency to selfaggregate (Supplementary Fig. 7a). Of note, H3K4me3 transcription hot spots that are within lamina-associated domains do not preferentially interact, in marked contrast to the behavior of transcription sites that are away from the lamina (Supplementary Fig. 7b). Contact clustering of trans maps Although current sequencing depth limits the resolution of the normalized Hi-C trans-contact map, several architectural features are noticeable even when using a coarse-grained view (Fig. 5a). Chromosomal territories naturally stand out as the strongest features defining the map. To reveal subtler structures, we have developed a simple approach for clustering chromosomal domains using only trans contacts. In short, our clustering strategy groups together chromosomal domains (1 Mb) on the basis of their trans contacts alone, allowing clustering of elements on the same chromo some only through a common third party. Previous analysis of the raw Hi-C data suggested the existence of two compartments in the genome, one active and the other inactive10. Clustering of the 1063
a
Clustered contact map
Normalized contact enrichment (log2 scale) 2.0 1.0 0.5 0 −0.5 −1.0
c(%)
2 3
4 5 6 7 8 9 10 12 14 16 18 Chromosome
Regional GC content
30 20 10 0
(%) 50 40 30 10 0
High-activity Low-activity Low-activity cluster centromere-proximal centromere-distal cluster cluster
21X
d
DNase
Genome-wide cluster distribution
X 22 21 20 19 18 17
100K
1
GC content
16 15 14 13
Distance to nearest peak
100K
normalized contact maps reveals a finer cluster structure in a reproducible manner 10 (Fig. 5b and Supplementary Fig. 8). One 0 cluster, covering 31% of the genome, consists of GC-rich and transcriptionally active Distance to nearest peak loci, correlating well with the preferential CTCF (%) contacts between active epigenetic marks 20 discussed above (Fig. 5c). This cluster is 10 more often observed at small chromosomes 0 (with the exception of the gene-poor chromo some 18) and therefore underlies the previously reported coclustering. The other two Distance to nearest peak clusters are characterized by low genomic activity and low GC content. The two lowactivity clusters cannot be distinguished based on available functional or epigenomic information, yet the genome-wide cluster distribution (Fig. 5d) reveals a consistent physical partitioning of chromosomes into centromere-proximal (28%) and centromeredistal domains (41%). It currently cannot be resolved whether the mechanisms contributing to the observed physical clustering of centromere-proximal domains involve transient cell cycle–dependent effects, or reflect a stationary nuclear architecture. A similar effect, albeit on chromosomes that are two orders of magnitude smaller, was recently observed in yeast23. DISCUSSION The Hi-C approach for genome-wide mapping of chromosomal contacts is a remarkable experimental achievement, with a potential to reveal chromosomal architecture in a comprehensive and unbiased way. The applicability of the technique relies on extensive computational modeling to ensure that the complex and multistaged experimental procedure and the millions of reads generated by it are fully exploited. We have presented a probabilistic model for the analysis of Hi-C chromosomal contact maps and identified several sources of systematic biases that affect the prior probability of generating and sequencing Hi-C ligation products. Analysis of normalized Hi-C contact maps that were derived by the model
(%) 50 40 30 10 0
PolII
12 11 10 9 8
100K
H3K4me3
7 6
Distance to nearest peak (%) 20
3 2 1
10 0
5 4
Lamina
1/8 2/8 3/8 4/8 5/8 6/8 7/8 8/8
(%) 20
1064
b
Whole-genome contact map
0.36 0.37 0.38 0.40 0.41 0.43 0.46 0.47
Figure 5 Contact map clustering. (a,b) The normalized trans-contact map (a) and its clustering to three groups (b) are depicted for the NcoI data set. Chromosomes were divided into three distinct clusters, each characterized by enrichment for intracluster contacts and depletion of intercluster contacts. Cis contacts, which are not used in the clustering, are colored gray. (c) Properties of contact map clusters. Shown are the distribution of regional GC content (over 1-Mb windows), distance to the nearest DNase, H3K4me3, PolII and CTCF peak, and fibroblast lamina enrichment for the three clusters. The red cluster strongly correlates with marks of active chromatin, and the blue/green clusters correlate with nonactive marks. (d) The spatial organization of clusters on the chromosomes. Shown are chromosome diagrams, color-coded according to the association of each 1-Mb domain with one of the clusters. The active cluster (red) is distributed over the entire genome but is enriched on the gene-rich and small chromosomes. The two low-activity clusters divide the genome into centromere-proximal (green) and centromere-distal (blue) fractions.
100K
© 2011 Nature America, Inc. All rights reserved.
a n a ly s i s
Lamina distal Lamina proximal LaminB1 enrichment (fibroblasts)
High-activity cluster Low-activity centromere-proximal cluster Low-activity centromere-distal cluster Missing data
demonstrates how to eliminate these biases and provides reproducible global insights into chromosome architecture. The resolution of the Hi-C–derived contact maps analyzed in this work is limited by the number of available reads and cannot be expected to reveal locus-specific architectural details that are finer than several megabases in scale. We have shown here that with appropriate control, some biological interpretation can still be drawn by pooling together chromosomal contacts between regions with known biological function or specific epigenetic marks. Using this approach, we were able to support the existence of nuclear transcriptional foci by identifying enrichment of trans interaction between H3K4me3 loci or DHSs, even after controlling for local and regional GC-content effects. The data also show a prototypical architecture of chromosomal contacts around TSSs and CTCF binding sites, providing a genome-wide confirmation for extensive longrange cis contacts and asymmetric structure around these elements. Another useful strategy for the analysis of coarse-grain Hi-C maps is the application of global clustering to reveal the overall chromo somal architecture of the nuclei under study. This unsupervised approach demonstrated the existence of one cluster representing a self-interacting core of gene-rich, active domains and partitioned the remaining nonactive genome into a centromere-proximal cluster and a centromere-distal cluster. VOLUME 43 | NUMBER 11 | NOVEMBER 2011 Nature Genetics
a n a ly s i s It is expected that a large number of Hi-C studies providing improved coverage and comparing different cell types will become available in the near future. The approach we propose here can facilitate the analysis of these data, aiming at the characterization of chromosomal structures at higher resolution and leading toward the association of these structures with regulatory function. Methods Methods and any associated references are available in the online version of the paper at http://www.nature.com/naturegenetics/. Note: Supplementary information is available on the Nature Genetics website.
© 2011 Nature America, Inc. All rights reserved.
Acknowledgments We thank W. de Laat for discussions and members of the Tanay group for critical reading of the manuscript. Research at A.T.’s laboratory was supported by the Israeli Science Foundation and by the EPIGENESYS FP7 program of the European Commission. AUTHOR CONTRIBUTIONS E.Y. and A.T. conceived and performed the analysis. E.Y and A.T wrote the article. COMPETING FINANCIAL INTERESTS The authors declare no competing financial interests. Published online at http://www.nature.com/naturegenetics/. Reprints and permissions information is available online at http://www.nature.com/ reprints/index.html. 1. Fullwood, M.J. et al. An oestrogen-receptor-alpha-bound human chromatin interactome. Nature 462, 58–64 (2009). 2. Bantignies, F. et al. Polycomb-dependent regulatory contacts between distant Hox loci in Drosophila. Cell 144, 214–226 (2011). 3. Schoenfelder, S. et al. Preferential associations between co-regulated genes reveal a transcriptional interactome in erythroid cells. Nat. Genet. 42, 53–61 (2010). 4. Fraser, P. & Bickmore, W. Nuclear organization of the genome and the potential for gene regulation. Nature 447, 413–417 (2007).
Nature Genetics VOLUME 43 | NUMBER 11 | NOVEMBER 2011
5. Miele, A. & Dekker, J. Mapping cis- and trans- chromatin interaction networks using chromosome conformation capture (3C). Methods Mol. Biol. 464, 105–121 (2009). 6. Hagège, H. et al. Quantitative analysis of chromosome conformation capture assays (3C-qPCR). Nat. Protoc. 2, 1722–1733 (2007). 7. Dekker, J., Rippe, K., Dekker, M. & Kleckner, N. Capturing chromosome conformation. Science 295, 1306–1311 (2002). 8. Simonis, M. et al. Nuclear organization of active and inactive chromatin domains uncovered by chromosome conformation capture-on-chip (4C). Nat. Genet. 38, 1348–1354 (2006). 9. Simonis, M. et al. High-resolution identification of balanced and complex chromosomal rearrangements by 4C technology. Nat. Methods 6, 837–842 (2009). 10. Lieberman-Aiden, E. et al. Comprehensive mapping of long-range interactions reveals folding principles of the human genome. Science 326, 289–293 (2009). 11. Dekker, J. The three ‘C’ s of chromosome conformation capture: controls, controls, controls. Nat. Methods 3, 17–21 (2006). 12. Dohm, J.C., Lottaz, C., Borodina, T. & Himmelbauer, H. Substantial biases in ultra-short read data sets from high-throughput DNA sequencing. Nucleic Acids Res. 36, e105 (2008). 13. Aird, D. et al. Analyzing and minimizing PCR amplification bias in Illumina sequencing libraries. Genome Biol. 12, R18 (2011). 14. Mitchell, J.A. & Fraser, P. Transcription factories are nuclear subcompartments that remain in the absence of transcription. Genes Dev. 22, 20–25 (2008). 15. Sexton, T., Umlauf, D., Kurukuti, S. & Fraser, P. The role of transcription factories in large-scale structure and dynamics of interphase chromatin. Semin. Cell Dev. Biol. 18, 691–697 (2007). 16. Ernst, J. et al. Mapping and analysis of chromatin state dynamics in nine human cell types. Nature 473, 43–49 (2011). 17. Hakim, O. et al. Diverse gene reprogramming events occur in the same spatial clusters of distal regulatory elements. Genome Res. 21, 697–706 (2011). 18. Phillips, J.E. & Corces, V.G. CTCF: master weaver of the genome. Cell 137, 1194–1211 (2009). 19. Fu, Y., Sinha, M., Peterson, C.L. & Weng, Z. The insulator binding protein CTCF positions 20 nucleosomes around its binding sites across the human genome. PLoS Genet. 4, e1000138 (2008). 20. Handoko, L. et al. CTCF-mediated functional chromatin interactome in pluripotent cells. Nat. Genet. 43, 630–638 (2011). 21. Guelen, L. et al. Domain organization of human chromosomes revealed by mapping of nuclear lamina interactions. Nature 453, 948–951 (2008). 22. Peric-Hupkes, D. et al. Molecular maps of the reorganization of genome–nuclear lamina interactions during differentiation. Mol. Cell 38, 603–613 (2010). 23. Duan, Z. et al. A three-dimensional model of the yeast genome. Nature 465, 363–367 (2010).
1065
ONLINE METHODS
© 2011 Nature America, Inc. All rights reserved.
Mapping reads to the genome. Hi-C raw reads were downloaded from NCBI (GSE18199), where HindIII (AAGCTT) was present in two replicates (13,512,316 and 16,186,884 reads), and NcoI (CCATGG) was present in one replicate with 28,658,937 reads. The first 50 bp from the two sides of each paired-end read were separately mapped to the genome (build hg18) using MAQ24 with default parameters. Reads for which both sides were uniquely mapped (MAQ quality > 30) were kept, leaving us with 6,917,680 and 7,781,213 pairs for HindIII, and 15,515,266 pairs for NcoI. Mappability score. Each restriction fragment has two fragment ends that can participate independently in ligation events. The coordinates of the fragment ends were computed by scanning the genome assembly (hg18) for the enzyme cutter sites (HindIII, 1.67 million ends; NcoI, 1.5 million ends). To compute the fragment end mappability score the whole-genome sequence was split into artificial reads (50-bp reads, starting every 10 bp) and then mapped back to the genome using MAQ. For each fragment end the mappability score was then defined to be the portion of artificial reads mapped uniquely to the genome (MAQ quality > 30) within a 500-bp window starting at the fragment end toward the fragment. After discarding fragment ends with a mappability score less than 0.5 we are left with 1.52 million HindIII fragment ends and 1.34 million NcoI fragment ends. Only paired reads that mapped to two valid fragment ends were used in downstream analysis. Identification of nonspecific ligation products. Each paired read is marked as a nonspecific cleavage product if the sum of the two distances to the nearest cutter sites is larger than 500 bp. Unlike cleavage with restriction enzymes, these nonspecific cleavage events depend on local DNA features (such as chromatin compaction) and are therefore harder to control for. In this work we analyze only cutter-specific cleavage events, which form the main bulk of the data. Seeds for correction matrices. To robustly assess different biases affecting Hi-C coverage we studied separately trans and cis contacts (for cis contacts, fragment end pairs that are within less than 1 Mb from each other are not used to construct the model). We bin fragment ends according to the length of their corresponding fragments into 20 equally sized bins denoted by (Bilen )i20= 1. The seed matrix for fragment lengths (shown in Fig. 1d) is defined as: Slen[i, j] = (1 / Pprior ) ⋅
Olen[i, j] , Tlen[i, j]
where Pprior is the prior probability to observe a pair and is equal to the total number of observed trans pairs divided by the total number of possible trans pairs, Olen[i, j] is the number of observed trans pairs such that one fragment end is in bin Bilen and the other is in bin Blen j , and Tlen[i, j] is the total number of possible unique trans pairs such that one fragment end is in bin Bilen and the other is in Blen j . The GC-content seed matrix Sgc is computed in a similar manner, defining the bins according to the GC content of the 200 bp near the fragment end, toward the fragment. Fragment length and GC-content bin ranges are given in Supplementary Table 1. The empirical mappability matrix Smap (Fig. 1h) is computed in the same manner, using five bins over the mappability score (0.5–0.6, 0.6–0.7, 0.7–0.8, 0.8–0.9, 0.9–1.0). Learning the correction model. Given two fragment ends a, b, the probability P (Xa, b) to observe them in a paired-end read (that is, to get a pair of reads that map uniquely to them) is defined as: P ( Xa, b ) = Pprior ⋅ Flen (alen , blen ) ⋅ Fgc (agc , bgc ) ⋅ M (a) ⋅ M (b), where alen, blen, agc, bgc are the fragment length bins and GC-content bins of the two ends, Flen (alen, blen), Fgc (agc, bgc) are two real valued functions, and M(a), M(b) are the mappability scores of the ends. Our algorithm uses maximum likelihood to estimate Flen (alen, blen) and Fgc (agc, bgc) (each is defined by a symmetric matrix with 400 = 20 · 20 parameters). The likelihood function is: L(Flen , Fgc ) = =
∏
{a , b}∈I
P ( Xa ,b ) ⋅
∏
∏
{a , b}∉I
c = (alen , agc , blen , bgc )
Nature Genetics
(1 − P ( Xa, b ))
P ( Xa, b )nc ⋅ [1 − P ( Xa, b )]mc
where I is the set of observed fragment end pairs, nc is the number of observed pairs that match the bin criteria of c, and mc is the number of pairs that match 0 = Slen and Fgc0 = Sgc the criteria but were not observed. We initialize Flen (as defined in the previous section) and maximize the likelihood function by alternating between the optimization of the two matrices: n+1
(i) Flen
n+1
(ii) Fgc
n+1
n = arg max L(Flen , Fgc ), Fgc Flen
n+1
n = arg max L(Flen , Fgc ), Flen Fgc
n = Fgc n = Flen
The algorithm repeats the two steps above (using the standard BFGS nonlinear optimization algorithm) until the improvement in the log-likelihood is smaller than an arbitrary threshold (1 in our analysis here). The resulting correction matrices are similar but not identical to the seed matrices (see Supplementary Fig. 2). The adjustment derived by the likelihood optimization procedure can be attributed to the cross-correlation of fragment length, GC content and mappability. Projecting the model on epigenetic features. H3K4me3, DNase and CTCF enrichment tracks for the GM06990 (ref. 25), PolII and H3K4me1 enrichment tracks for the GM12878 (ref. 26) were all downloaded from the UCSC genome browser. For H3K4me3 we denote as peaks the top 2% loci, which occupy approxi mately 120,000 distinct genomic intervals. For H3K4me1 we use the top 1% to define peaks (82,000 intervals), and for DNase, CTCF and PolII we use for peak definition the top 0.5%, which occupy respectively 40,000, 48,000 and 36,000 distinct genomic intervals. For all tracks above, each fragment end is assigned a value according to the distance between the fragment and the nearest peak. The LaminB1 enrichment track for Tig3 lung fibroblasts21 (including data on probes with a median distance of 750 bp) was smoothed using 2-kb sliding windows. Each fragment end was then associated with a lamina enrichment value according to the mean smoothed LaminB1 enrichment of the fragment. Fragment ends were binned according to their regional GC-content level (1-Mb windows centered on each of the fragment ends), lamina enrichment and distance from the above epigenetic peaks. For any arbitrary division of the genome into bins B1, B2, …,Bn we then compute two matrices. The matrix O[i, j] contains the number of observed contacts between fragment ends in bins [i, j], and the matrix E[i, j] contains the total expected number of contacts between all pairs of fragment ends in bins [i, j], assuming the background model described above. As the number of fragment end pairs is large (order of 1 × 10¹²), we have implemented an efficient distributed computing scheme for computing this matrix. The observed and expected matrix marginals are defined as O[i] = ∑ O[i, j] and E[i] = ∑ E[i, j].The normalized j j contact enrichment for a pair of bins Bi, Bj is then computed using the formula O[i, j] , E[i, j] ⋅ N[i] ⋅ N[ j] where N[i] =
O[i] E[i]
is a normalization factor that takes into account the variable total coverage for different bins. Stratification controls for GC content or DNase hypersensitivity (as in Supplementary Figs. 4 and 5) were performed by considering Cartesian products of two bin sets (for example, GC content and H3K4me3 occupancy) and computing normalized contact enrichment between the extended bins sets. Normalized contact maps. To generate genome-wide contact maps (as in Fig. 5a), we divided the genome-wide contact matrix into square 1 × 1 Mb bins. We computed a coarse-grained matrix O[i, j] of observed contacts by distributing reads among these bins, and a matrix E[i, j] containing the expected number of contacts in each bin, assuming the background model described above. Given current sequencing depth, the expected number of Hi-C reads in each square bin is smaller than 1. We therefore smoothed the observed and expected contact matrices using linear weights as follows: O gw [i, j] =
∑
−W < l < W , −W < k < W
O[i + k, j + l] ⋅ wk , l ,
doi:10.1038/ng.947
where W = 10 and
wk , l =
1 . k + l +1
The smoothed expected-contact matrix Egw[i, j] is defined in a corresponding manner. The genome-wide contacts enrichment matrix is D[i, j] =
E
gw
O gw [i, j]
[i, j] ⋅ N gw [i] ⋅ N gw [ j]
,
where N gw [i] =
O gw [i] E gw [i]
© 2011 Nature America, Inc. All rights reserved.
is a normalization factor that takes into account the variable total coverage for different square bins. Computing average cis profiles. To generate cis-contact enrichment profiles around a predefined (for example, active or inactive) set of TSSs, we first extracted the set of restriction fragments that have at least one fragment end within 5 kb from a TSS in the set and are completely located upstream (defining the ‘upstream’ profile) or downstream (defining the ‘downstream’ profile) of the site. The resulting set of fragment ends defined two sets of the TSSassociated fragment ends. We then estimated contact enrichment as a function of chromosomal distances for each set of TSS-associated fragment ends as follows: (i) computing the observed number of contacts connecting TSSassociated fragment ends with fragment ends within bins of chromosomal distances (defining distances using restriction fragments centers and binning them as shown in Figs. 3 and 4); (ii) normalizing the observed contacts profile by the number of contacts expected given the probabilistic model described above, trained using intrachromosomal contacts that are distant by more than 1 Mb (Supplementary Fig. 1); (iii) dividing the resulting normalized cis-contact curves, which represent a near-exponential decay in contact probability as a function of the distance, by control curves that were derived analogously but
doi:10.1038/ng.947
using random instead of the TSS-associated fragment ends; the result is the contact enrichment profile (as in Fig. 3c,d); and (iv) estimating the standard deviation of the resulting ratios (used for the confidence intervals in Fig. 3c,d) by propagating the binomial errors on the expected number of contacts at each spatial bin through the enrichment formula. To define the active TSS landmarks, we used TSSs from the UCSC known gene table with H3K4me3 occupancy in the 30% top percentiles, resulting in approximately 17,000 and 19,000 fragment ends upstream and downstream, respectively, of the TSS. Inactive TSS landmarks were defined as the bottom 60%, resulting in 43,000 and 48,000 fragment ends upstream upstream and downstream, respectively, of the TSS. An identical approach was applied to CTCF binding sites. CTCF peaks were defined as the top 0.5% coverage percentiles, resulting in approximately 92,000 fragment ends (same number for upstream and downstream), and were handled similarly to TSSs, with the only exception being that the strand of CTCF sites was always considered to be the plus strand. Clustering algorithm. We adapted the standard k-means clustering algorithm to perform trans-contact clustering. The input of the algorithm is the normalized genome-wide contact map D defined above. The matrix represents proximity between 1-Mb chromosomal segments, and it is used to define a distance D[i, j] between 1-Mb chromosomal segments i, j that are on different chromosomes. The distances between chromosomal segments on the same chromosome are undefined and are ignored by the algorithm. The distance between a segment i and a cluster of segments J is defined to be the average distance between i and the segments in J (ignoring undefined values). Given these definitions, the algorithm works like standard k-means clustering, initializing clusters using k random segments and repeatedly reassigning segments to the cluster with minimal distance until convergence. 24. Li, H., Ruan, J. & Durbin, R. Mapping short DNA sequencing reads and calling variants using mapping quality scores. Genome Res. 18, 1851–1858 (2008). 25. Sabo, P.J. et al. Discovery of functional noncoding elements by digital analysis of chromatin structure. Proc. Natl. Acad. Sci. USA 101, 16837–16842 (2004). 26. Mikkelsen, T.S. et al. Genome-wide maps of chromatin state in pluripotent and lineage-committed cells. Nature 448, 553–560 (2007).
Nature Genetics