assessment of concrete structures is recommended, i.e. fully probabilistic
durability design, which necessarily ... (2008) and the fib Model Code (2010).
Evidently ...
Probabilistic modelling of concrete structures degradation B. Teplý, P. Rovnaníková, P. Rovnaník, D. Vořechovská Faculty of Civil Engineering, Brno University of Technology, Brno, Czech Republic,
[email protected],
[email protected],
[email protected],
[email protected] Abstract: Sulfate attack is a set of complex and overlapping chemical and physical processes caused by reactions of numerous cement components with sulfates originating from external or internal sources. These processes can lead to eventual deterioration of concrete composition and properties; in addition, these reactions depend on the environmental exposure, including access of moisture and temperature changes. In the context of performance-based approaches, sustainability consideration and whole life costing, suitable models, which can reliably predict the behavior of hydrated cement systems of concrete structures subjected to sulfate attack during the service life, are needed. A consistent approach to the durability assessment of concrete structures is recommended, i.e. fully probabilistic durability design, which necessarily requires the utilization of stochastic approaches. The present work is restricted to models for the description of concrete under the external sulfate attack. The primary sources of external sulfates are natural sulfates in soils or dissolved in ground water, sulfates originating from the atmospheric pollution or from the decomposition and oxidation of proteins in waste water. Several models for concrete corrosion rate are presented, compared and some parametric analyses are shown. Keywords: sulfate attack, concrete, modeling, stochastic approach
1. Degradation Modeling In the context of performance-based approaches for the design or assessment of concrete structures, time is the decisive variable and the durability issues are pronounced. Also, the reliability aspects are important as they is attribute to service life, maintenance, inspection, repair and the life-cycle cost – see also ISO 13823 (2008) and the fib Model Code (2010). Evidently, durability and reliability are often crucial structural performance characteristics and the reliability level for relevant limit states has to be analysed frequently utilising mathematical models for degradation prognosis. When doing this it can be useful to have a range of models available for the structural task in question. The engineer can then select a suitable one with respect to the type of relevant limit state, although frequently, for pragmatic reasons, the model choice is based on the availability of model data and effective software. Modelling of degradation processes may be based on models of different levels of sophistication: a) macro-level; b) simplified models, probabilistic approach; c) micro-level. The level a is the most simple, often being called a “deemed-to-satisfy” set of rules (mostly according to current codes), and does not allow for the design/assessment of a specified service life with a specified
5th International Conference on Reliable Engineering Computing (REC 2012) Edited by M. Vořechovský, V. Sadílek, S. Seitl, V. Veselý, R. L. Muhanna and R. L. Mullen Copyright © 2012 BUT FCE, Institute of Structural Mechanics ISBN 978-80-214-4507-9. Published by Ing. Vladislav Pokorný − LITERA
559
B. Teplý, P. Rovnaníková, P. Rovnaník, D. Vořechovská
reliability level. The level b comprises simple models (often semi-empirical) verified by comparisons with results obtained from testing under experimental and real-life conditions; the variables are treated as random quantities, so the outputs are also capable of expressing statistical and probabilistic quantities (service life assessment). This is the level dealt with in the present work. The level c is the most refined one, where the models are complex and are developed making use of basic physical laws and often also the constitutive laws of mechanics, thus leading to the problem of needing to solve partial differential equations. This level of sophistication is too high for everyday design practice. Note that levels b and c may be viewed as performance-based design types. Many variables applied in the assessment of deteriorating concrete structures show random spatial variability. In contrast, the majority of published analyses deal with 1D representation, which enables the investigation of a “point in space” or “hotspot”. Because of this, only temporal variability is taken into account. However, numerous proposals for approaches which also facilitate the analysis of the spatial characteristics of deterioration processes have recently appeared – e.g. Darmavan & Stewart (2003), Straub (2011). Frequently, random fields in 2D space are used, often simulated by means of random variables generated for a chosen mesh in stochastic finite element analysis. The requirement for data concerning the correlation structure in space creates a challenge in real-life cases; therefore, monitoring/testing can be employed. A more appropriate and economical decision about the service life consequences can then be based on defining the limit states for a certain proportion of the structure, and not merely for an isolated hotspot. The spatial variability can also be captured by using e.g. cellular automata technique – for an example of this applied to chloride ingress see Podroužek & Teplý (2008).
2. Tool for practical applications Any decision process dealing with degradation prognosis needs a suitable set of models and efficient tools with stochastic capabilities. In this context, and with regard to the level b mentioned above, a software package called FReET-D (see e.g. Teplý et al. (2007)) has been developed. The utilization of stochastic approaches - a combination of analytical models and simulation techniques - was involved in the creation of this specialized software for assessing newly-designed as well as existing concrete structures. FReET-D is a programme associated with the multipurpose probabilistic software for statistical, sensitivity and reliability analysis of engineering problems, FReET (Feasible Reliability Engineering Tool), which is based on efficient reliability techniques, see (Novák et al., 2003) and (Vořechovský and Novák, 2003). FReET can be utilized in two modes: as a stand-alone multipurpose programme for any user-defined problem, and as a module integrated with ATENA software, which is produced by Červenka Consulting, Prague; this integration has been developed within the SARA project (Bergmeister et al., 2007). FReET-D provides: (i) modelling of degradation phenomena in concrete structures, statistical and sensitivity analyses; Bayes updating; (ii) assessment of service life; (iii) assessment of reliability measures; (iv) risk assessment. For the purposes of options (ii) and (iii) the user may create different simple limit conditions of the following types:
560
5th International Conference on Reliable Engineering Computing (REC 2012)
Probabilistic modelling of concrete structures degradation
Pf P( A B) Pd
(1)
Pf P(t S t D ) Pd
(2)
or
where A is the effect of the analysed action, B is the barrier and Pd is the target probability value. Generally, both A and B are time dependent and hence Pf or reliability index β are time dependent too. The time tS is a predicted time value corresponding to the limit given by eq. (1), i.e. the predicted service life, tD is design service life. The FReET-D module has been developed by implementing a number of degradation models for reinforced concrete structures. Degradation models are time dependent mathematical functions that show the average increase of cumulative degradation over time. These models are parameterized with several material, structural and environmental parameters which are considered to be random variables. For all models, the factor ψ (the general multiplier) of model uncertainty is provided to compensate for the possible inexactness or incompleteness of results. The main criteria in selecting the degradation model for each specific use are: the type of relevant degradation mechanism, the definition of the appropriate limit state and the given exposure conditions; the availability of statistical data or the testing method for the input variables of each model; the accuracy of the model when using the available data in relation to the required accuracy/strategy level. The list of models currently implemented in FReET-D is specified in Table I (mainly 1D models). The implementation of additional models is still in progress. The original literature sources for all models that are predominantly deterministic are referenced in the FReET-D manuals. The individual models listed in Table I can be used to construct and analyze different limit states according to Eq. (1) or (2). Input parameters are defined as random variables which are described by their probability density functions (PDF) and statistical parameters or can also be described by user-defined raw data. A mutual statistical dependence between input variables can be prescribed and is controlled by a simulated annealing method (Vořechovský & Novák, 2009). Some models may be highly input-demanding; in order to simplify the handling of inputs their statistical sensitivity analysis is provided by means of Spearman rank-order correlation coefficients so the user may easily gain measurements of the relative effect of each basic variable. The present paper briefly mentions “old” features of the software tool FReET-D described previously in Teplý et al. (2007) and concentrates in more detail on some recently attached models for different degradation effects, namely sulphuric and general acid attack. According to the user-defined type of analysis FReET-D provides the following type of outputs: after performing the statistical analysis (via the Monte Carlo method or Latin Hypercube sampling method), the statistical moments of output variables are shown in a numerical and graphical way; also, the values of the sensitivity coefficients for individual inputs are provided; Bayes updating is performed when additional data are inputted; reliability analysis provides the probability of failure value or reliability index relevant to a userdesigned limit condition. For this purpose the FORM technique may also optionally be utilized; the best-fitted PDF may be automatically found for the output quantity.
5th International Conference on Reliable Engineering Computing (REC 2012)
561
B. Teplý, P. Rovnaníková, P. Rovnaník, D. Vořechovská
Chloride ingress
Carbonation
Degradation mechanism
Table I. Models implemented in FReET-D
Model notation
Note
Carb1a Carb1b Carb2a Carb2b Carb3 Carb4a Carb4b Carb5a Carb5b Carb6 Carb7 Carb8 Carb9
Carbonation depth at time t; time to depassivation
Chlor1a Chlor1b
Depth of chlorination at time t; time to depassivation
Model b provides calculation of the saturation concentration of Cl- via an analytical formula
Chlor2a Chlor2b Chlor3a Chlor3b
Concentration of chlorides at depth x and time t
Model b provides calculation of the diffusion coefficient via an experimentally derived formula fib-Model Code 2010 model; model b provides calculation of surface Cl - conc. for specific conditions via an analytical formula
Corr1 Corr2 Reinforcement corrosion
Output
Corr3 Corr4 Corr5 Corr6 Corr7
Ditto; simplified model Concretes from Portland cement; influence of temperature Concretes from blended cements; model b differs by RH function Concretes from blended cements; model b is for HVFA concretes Concretes from blended cements; type of cement considered Concretes from blended cements; fib-Model Code 2010 model Concrete from Portland cement with a lime-cement mortar coating
Uniform type of corrosion Pitting type of corrosion Pitting type of corrosion Crack initiation on the steel-concrete interface; uniform corrosion Crack width on concrete surface; uniform corrosion Crack initiation on the steel-concrete interface; uniform corrosion Yield stress and ultimate stress - apparent values; strain at ultimate strength Prestressed reinforcement, pitting corrosion; fracture mechanics approach
Sulphate attack
Net rebar diameter at time t Pit depth at time t Net cross sectional area of rebar at time t Time to cracking due to corrosion Crack width due to corrosion at time t Time to cracking due to corrosion strength and ductility of corroded steel Stress intensity factor at the pit tip at time t
Sulf
Rate of concrete corrosion
Corrosion of concrete sewer pipes
Acid attack
Scc1a Scc1b
Concretes from Portland cement; model b differs by RH function
Acid
Depth of concrete corrosion
i) User defined concentration of the acid ii) User defined pH of mineral acid solution iii) Buffering media consideration
562
5th International Conference on Reliable Engineering Computing (REC 2012)
Probabilistic modelling of concrete structures degradation
3. Description of models recently added to FReET-D 3.1. SULPHIDE ATTACK ON CONCRETE In sewer collection systems there is a corrosion problem involving the destruction of concrete pipes or structures by acid produced from hydrogen sulphide gas – ASCE Manual (2007). A certain kind of bacteria causes this type of corrosion, which is termed microbiologically induced corrosion (MIC). The bacteria responsible include sulphur-oxidizing bacteria (Thiobacillus), which oxidize sulphide into sulphuric acid. The degradation of concrete sewer pipes due to sulphuric acid attack can be assessed by the frequently cited model by Pomeroy and Parkhurst (1977) for the deterioration rate c of concrete [mm/year]:
c 11.5kA1
(3)
where k = the factor representing the proportion of acid reacting (only an estimated value and ranging from 1.0 when the acid formation is slow to 0.3 when it is formed rapidly), Ф = the flux of H2S (or sulphide release [g H2S/(m2 hr)]), A = acid-consumption capability, i.e. the alkalinity of the concrete, expressed as the proportion of equivalent calcium carbonate [g CaCO3/g concrete]. For granitic aggregate concretes A ranges from 0.17 to 0.24, while for calcareous aggregates it ranges from 0.9 to 1.1, the equivalent A value for mortar-lined pipes being 0.4; ψ = the coefficient of model uncertainty (optional). Flux Ф can be expressed according to the ASCE Manual (2007) and Tee et al. (2011) as
0.7(su)3 / 8 jS lim (b / P)
(4)
where j is the pH-dependent factor for the proportion of H2S, s is the slope of the pipeline, u is the (m/sec), Slim is the limiting value of sulphide concentration or dissolved sulphide concentration, P is the wetted perimeter P of the pipe wall and b is the surface width of the stream. Note that the variables s and u are in reality strongly dependent on each other (the greater the slope, the greater the velocity of the stream); this fact can be specified by appropriate statistical correlation of these two input variables while using FReET-D. Starting from the example shown in Tee et al. (2011) a parametric study has been performed using FReET-D. The following data were selected for a sewer pipe of outer diameter = 2.286 m and wall thickness = 0.216 m, flowing half full: Table II. Input data for an analysed example of sulphate attack Notation Unit Distribution Mean COV Slim mg/l LN(2 par) 3.12 0.10 s % LN(2 par) 0.001 (up to 0.003) 0.10 u m/sec LN(2 par); 0.60 0.10 A N 0.20 0.05 j deterministic 0.28 P m deterministic 2.91 b m LN(2 par) 1.854 0.10 ψ deterministic 1.0 Note: (i) the imposed Spearman correlation coefficient of variables s and u equals 0.9 (ii) from pH = 7.4 it follows the value of constant j − Pomeroy and Parkhurst (1977)
5th International Conference on Reliable Engineering Computing (REC 2012)
563
B. Teplý, P. Rovnaníková, P. Rovnaník, D. Vořechovská
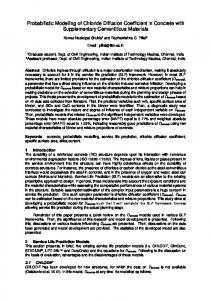
The variable s was set as a parameter in the range from 0.0010 to 0.0030 to show the effect of possible scatter due to the non-precise embedding of pipes. It is depicted in Fig. 1.
Figure 1. Deterioration rate of a sewer pipeline affected by sulphate attack as a function of the slope of the pipeline with depicted standard deviations resulting from statistical analysis.
3.2. ACID ATTACK According to the fib Model Code (2010) the degree of concrete degradation caused by acid attack is defined by the corrosion depth d with respect to the original surface. It comprises the depth of material removed by abrasion and/or crystallization pressure and the depth of corroded material remaining on the concrete surface. The estimation of the time before a given depth of corrosion is reached is an important decision criterion for the designer. Supposing the loss of surface material is negligible and the strength of the acid is assumed to be constant, the corrosion depth d [m] may then be estimated from the “square root” law d kc ct ψ
(5)
where c = the concentration of acid in [mol/L] and can be given as a (i) direct input quantity, or assessed either (ii) by Eq. (6) or (iii) by Eq. (7); t = contact time in [s], and ψ is the model uncertainty coefficient (optional). The constant kc mediates the effect of concrete composition on the corrosion process and includes the effect of cement content and type, additions, w/c ratio and aggregate solubility. According to the fib Model Code (2010) no prediction formula for this constant may as yet be given − it should be determined by appropriate experiments, see e.g. Beddoe and Schmidt (2009a, b). As an example of utilizing this source the following kc values for concrete fabricated from CEM I with a mass of 400 kg/m3 were gained: w/c = 0.4 → kc = 10.64; for w/c = 0.50 kc = 12.46 and for w/c = 0.60 kc = 14.10. For mineral acids c [mol/L] is given by the proton concentration of the acid as calculated from its pH
564
5th International Conference on Reliable Engineering Computing (REC 2012)
Probabilistic modelling of concrete structures degradation
c 10 pH
(6)
In the case of buffering media it is necessary to know the pH and the total content ctot of acid and acid anions (e.g. acetate and acetic acid), dissolved CO2 or ammonium: c
10 pH ctot ( 10 pH K s )
(7)
where Ks = the dissociation constant in [mol/L] and ctot = the total content of acid and conjugate base, dissolved CO2 or ammonium in [mol/L]. For an illustrative example the following conditions and input data were used to calculate the corrosion depth. Concrete with a cement content of 400 kg/m3 and w/c = 0.5, the variable kc LN(12.46; 1.25), and the concentration of the acid was set to LN(0.1; 0.02) mol/L; it affected the concrete for a period of 10 years. Statistical analysis gives a mean corrosion depth value of 12.4 mm with COV = 0.14 and Lognormal (3par) as the best fitted PDF.
Acknowledgements This paper has been prepared with the financial support of the Technologic Agency of the Czech Republic, project No. TA 01011019, and the Czech Science Foundation grant No. P105/10/1156 “COMOCOS Complex modeling of concrete structures”.
References ASCE Manuals and Reports of Engineering Practice, No. 60, Gravity Sewers, American Society of Civil Engineers, New York, USA, 2007. Beddoe, R.E. and Schmidt, K. Acid attack on concrete – effect of concrete composition. Part 1. Cement International, 7(3), 88-94, 2009. Beddoe, R.E. and Schmidt, K. Acid attack on concrete – effect of concrete composition. Part 2. Cement International, 7(4), 86-93, 2009. Bergmeister, K., Strauss, A., Pukl, R. and Novák, D. Structural analysis and reliability assessment, SARA Part I: Life-cycle reliability assessment, virtual simulation for health monitoring and damage identification of bridges. In Proc. of 3rd International Conference on Structural Health Monitoring of Intelligent Infrastructure (SHMII-3 2007), Vancouver, Canada, 2007. Darmawan, M.S., Stewart, M.G. Spatial variability of pitting corrosion and its effect on the reliability of prestressing wires. In Der Kiureghian, Madanat & Pestana (eds.), Application of Statistics and Probability in Civil Engineering, 541-548. Rotterdam: Millpress, 2003. EN 1990. Basis of Structural Design, European Standard, 2002. EN 1992-1-1 Design of concrete structures – Part 1.1: General rules and rules for buildings, European Standard, 2003. fib Bulletin No. 34, Service Life Design, 2006. fib Model Code 2010, Final draft, Lausanne, 2010. ISO 13823. General Principles in the Design of Structures for Durability, 2008.
5th International Conference on Reliable Engineering Computing (REC 2012)
565
B. Teplý, P. Rovnaníková, P. Rovnaník, D. Vořechovská Novák, D., Vořechovský, M. and Rusina, R. Small-sample Probabilistic Assessment – software FREET. In Proceedings of the 9th International Conference on Applications of Statistics and Probability in Civil Engineering ICASP 9, Millpress Rotterdam, San Francisco, USA, 91–96, 2003. Podroužek, J., Teplý, B. Modelling of chloride transport in concrete by cellular automata. Engineering Mechanics 15(3): 1-10, 2008. Pomeroy, R.D. and Parkhurst, J.D. The forecasting of sulfide build-up rates in sewers. Progr. Water Technol. 9 (3), 621-628, 1977. Straub, D. Reliability updating with inspection and monitoring data in deteriorating reinforced concrete slabs. In Faber, Köhler & Nishijima (eds.), Application of Statistics and Probability in Civil Engineering, 2309-2316. London: Taylor & Francis Group, 2011. Tee, K.F., Li, Ch.Q. and Mahmoodian, M.: Prediction of time-variant probability of failure for concrete sewer pipes. In Proc. of XII DBMC, Porto, Portugal, Vol. I, 447-454, 2011. Teplý, B., Matesová, D., Chromá, M., Rovnaník, P. Stochastic degradation models for durability limit state evaluation: SARA – part VI. In Proc. of 3rd International Conference on Structural Health Monitoring of Intelligent Infrastructure, Vancouver, British Columbia, Canada, p. 187 (Abstract), full length paper on CD-ROM, 2007. Vořechovský, M., Novák, D. Statistical correlation in stratified sampling. In Proceedings of the 9th Int. Conf. on Applications of Statistics and Probability in Civil Engineering – ICASP 9, San Francisco, USA, Rotterdam Millpress, 119-124, 2003. Vořechovský, M., Novák, D. Correlation control in small-sample Monte Carlo type simulations I: A simulated annealing approach. Probabilistic Engineering Mechanics 24: 452-462, 2009.
566
5th International Conference on Reliable Engineering Computing (REC 2012)