KSCE Journal of Civil Engineering (2014) 18(4):853-864 Copyright ⓒ2014 Korean Society of Civil Engineers DOI 10.1007/s12205-014-0373-x
Construction Management
pISSN 1226-7988, eISSN 1976-3808 www.springer.com/12205
TECHNICAL NOTE
Probabilistic Multiobjective Optimization of Sustainable Engineering Design Jui-Sheng Chou* and Thanh-Son Le** Received November 21, 2011/Accepted June 20, 2013
··································································································································································································································
Abstract As the global population reaches 7 billion and standards of living are increasing, engineers are being pressured to use limited natural resources to satisfy ever-increasing demand. Project engineers are currently charged with achieving a balance between cost and duration, and must consider environmental factors to reach sustainable development. This work proposes a novel probabilistic multi-objective optimization algorithm to attain sustainable construction cost, project duration, and CO2 emissions simultaneously in an uncertain project environment. The novel algorithm, which is based on Particle Swarm Optimization integrated with Monte Carlo simulation, is applied to generate a low-carbon economy and cleaner production. A typical construction project is selected to demonstrate the application of proposed algorithm for making sustainable decisions under multi-objectives. The proposed method demonstrated its risk analysis capacity by obtaining non-dominant optimized solutions for cleaner construction. This paper contributes to facilitating project managers in achieving a design that satisfies technical and quality requirements with lowest cost, shortest duration, and minimal adverse impacts on the environment. Keywords: sustainable development, construction engineering, multiobjective optimization, particle swarm algorithm, probabilistic simulation, risk analysis ··································································································································································································································
1. Introduction In design stage of a construction project, cost is conventionally the most important consideration of Project Managers (PMs). The challenge for PMs is to achieve a solution that has the least cost and fulfills all technical and quality requirements (Hwang and Ng, 2013). Consequently, minimizing cost is generally the ultimate goal of the design process. Another factor that must be considered is duration as project duration declines, construction cost increases. Therefore, PMs typically must deal with two competing quantitative objectives: minimizing cost and project duration. As the global population reaches 7 billion and standards of living are increasing, engineers faced with using limited natural resources to satisfy ever-increasing human demands. In this scenario, the awareness of Sustainable Development (SD) has increased worldwide. Although some consider SD an oxymoron and contest its applicability (Redclift, 2005), it has garnered public attention as a primary concern in both developed and developing countries (Hwang and Tan, 2012; Son et al., 2011). Moreover, SD has left its footprint in policy making in several countries (Quental et al., 2009). These policies influence most areas of society, ranging from agriculture to industry and services. The goal of SD is to lead human activity toward a sustainable
future. One pillar of SD is to minimize the adverse effects of human activities on air, water, soil, and ecosystems. One of the most significant environmental issues is Global Warming. Global Warming is the phenomenon of rising temperatures. Increased global temperatures have had adverse impacts (IPCC, 2007), such as increasing sea level and the amounts and patterns of precipitation, increasing the frequency and intensity of extreme weather events, melting glaciers, extinguishing species, and augmenting the ranges of disease vectors. According to the United Nations Intergovernmental Panel on Climate Change (IPCC), the increase in anthropogenic greenhouse gases (GHGs), such as water vapor, carbon dioxide (CO2), methane and other gases, has warmed the Earth’s atmosphere. This phenomenon arises from the absorbing of outgoing infrared radiation by GHGs. Notably, CO2 emissions (CEs) are implicated as the primary cause of GW because they are the most significant anthropogenic GHG (IPCC, 2006). All industries, including the construction industry, should focus on reducing CEs. The construction industry has a key role in meeting this goal. For instance, the cement industry accounted for 5% of worldwide GHG emissions (IIGCC, 2004). In total, 54% of global energy utilization is attributed to buildings and their construction. This energy use accounts for roughly 25% of
*Professor, Dept. of Civil and Construction Engineering, National Taiwan University of Science and Technology, Taipei 106, Taiwan (Corresponding Author, E-mail:
[email protected]) **Graduate Research Assistant, Dept. of Civil and Construction Engineering, National Taiwan University of Science and Technology, Taipei 106, Taiwan (Email:
[email protected]) − 853 −
Jui-Sheng Chou and Thanh-Son Le
the US's total CEs, contributing significantly to climate change (Godfried and Annie, 1999). Although many countries have implemented policies to reduce CEs by the construction industry, developing a strategic policy for tangible action is a complex task. One barrier to achieving the goal of reducing CEs is stakeholders during project stages, particularly during the design stage (Williams and Dair, 2007). Typically, the goal of the design process remains to minimize the cost of a construction project. Thus, the challenge now faced by PMs is to achieve a design that satisfies all technical and quality requirements, has the lowest cost and shortest project duration, and minimizes any adverse impacts on the environment. Therefore, this work proposes a novel approach that helps PMs during the design stage reconcile the need for optimizing cost and time with the smallest amount of CEs during construction. The remainder of this paper is organized as follows. Section 2 reviews literature to identify current techniques used to estimate project cost, duration, and CEs during construction. Section 3 discusses the background of Particle Swarm Optimization (PSO), probabilistic simulation, and estimation models. Section 4 describes the novel optimization algorithm, namely, the Probabilistic Multi-Objective PSO (PMOPSO) algorithm. A case study using the PMOPSO algorithm for a paving project, a common construction activity, is presented in Section 5. Finally, a discussion and conclusions are given in Section 6.
2. Related Works The recent development of multi-objective optimization techniques has markedly contributed to the resolution of problems in the construction industry (Kandil et al., 2010). For instance, Moussourakis et al. (2004) applied an analytical model to solve the time-cost tradeoff problem for construction projects (Moussourakis and Haksever, 2004). El-Rayes et al. (2005) employed an evolutionary optimization to solve the durationcost-quality tradeoff in a highway construction project (El-Rayes and Kandil, 2005). Similarly, Huang et al. (2008) solved this problem using a modified Ant Colony algorithm (Huang et al., 2008), and Yang (2009) used an improved PSO algorithm (Yang, 2009). These studies focused on conventional tradeoff problems in the construction stage. The proposed optimization technique enhances the benefits to contractors who fail to address the sustainability concerns of general stakeholders. Another research approach that greatly contributes to achieving sustainability in the construction industry is to estimate the effects of a construction project on the environment, especially, estimating air emissions and the energy used. For example, Oka et al. (1993) estimated air pollution caused by the construction of an office building in Japan using the Input-Output (I-O) method (Oka et al., 1993). The amount of air pollution was obtained based on the amount of resources used in the lifecycle of the office building.
Suzuki and Oka (1998) also utilized the I-O method to estimate energy consumption and the amount of CEs, which were calculated by aggregating all activities in the lifecycle of an office building (Suzuki and Oka, 1998). Seo and Hwang (2000) employed the I-O method and activity-based construction to calculate the amount of CO2 emitted during the lifecycle of a residential building, comprising the stages of materials manufacturing, construction, operation, and demolition (Seo and Hwang, 2001). Subsequently, some researchers have extended SD to infrastructure projects. Park et al. (2003) employed a process-based method to estimate the amount of CO2 emitted in the lifecycle of paved roadways (Park et al., 2003). The amount of CO2 emitted was obtained by summing the CEs from each stage in the lifecycle. Similarly, Loeffler et al. (2008) estimated diesel fuel consumption and CEs from forest road construction (Loeffler et al., 2008). Taplin et al. (2006) employed simulation to estimate CEs from a mining project (Taplin et al., 2006). Another crucial step in achieving sustainability for a construction project is to compare construction materials (Chau et al., 2007), structures, methods, and types of energy used by a project. For instance, Guggemos and Hovard (2005) compared the environmental effects of steel- and concrete-framed buildings using process-based Lifecycle Analysis (LCA) and the economic I-O (Yasantha Abeysundara et al., 2009). These studies showed that the steel-framed building emitted fewer air pollutants and consumed less energy than the concrete-framed building (Cole, 1998; Guggemos and Horvath, 2005). Upton et al. (2008) compared the energy usage and GHG emissions of wood and other materials in the United States (Upton et al., 2008). They noted that wood-based houses systems consume roughly 15-16% less energy for non-heating/cooling purposes and emit 20-25% less GHGs than houses with steel- or concrete-based systems. Gonzalez and Navarro (2006) evaluated the differences in CEs of houses made of different materials (Gonzalez and Garcia Navarro, 2006). They determined that using sustainable materials in a housing project reduced CEs by 27.28%. All of these studies made great contributions to the CEs problem in construction estimation regardless of practical project duration-cost tradeoffs. Moreover, most studies employed deterministic quantitative models and neglected the uncertainty inherent in the construction industry. Insufficient information in the early stages of a project causes considerable uncertainty in the relationship among project duration, cost, and CEs. Therefore, a reliable estimation method is needed that is superior by using probabilistic approaches. Monte Carlo Simulation (MCS) is a powerful tool for uncertainty analysis and has been widely employed for project cost estimation (Chou et al., 2009; Touran, 1993; Wang et al., 2007), lifecycle cost analysis and budge management (Hong et al., 2006; Khedr, 2006; Yang, 2005). Monte Carlo simulation has also been utilized as a risk management tool to deal with uncertainty in other industries such as electricity production (Sonnemann et al.,
− 854 −
KSCE Journal of Civil Engineering
Probabilistic Multiobjective Optimization of Sustainable Engineering Design
2003), and cement production (Gabel and Tillman, 2005). To optimize probabilistic results, the PSO algorithm has demonstrated its capacity via a broad range of applications. For instance, Tan et al. (2008) optimized resource conservation for an industry application using an adaptive PSO algorithm (Tan et al., 2008). Lin et al. (2008) resolved parameter estimation of a nonlinear rational filter using PSO (Lin et al., 2008). Al-Anzi and Allahverdi (2007), who optimized a two-stage assembly scheduling problem using Tabu search, PSO, and Early-DueDate algorithm heuristics, found that the PSO algorithm was the most efficient (Al-Anzi and Allahverdi, 2007). Chatterjee et al. (2007) integrated PSO in the training process of a neural network for robot-arm control (Chatterjee et al., 2007). Tan (2007) proposed a modified PSO algorithm to minimize the pollutants from clay-brick production (Tan, 2007). The efficiency of a PSO algorithm for a multi-objective optimization problem can be expressed by the antenna array problem (Mussetta et al., 2009), flow shop scheduling problem (Li et al., 2008; Mohemmed et al., 2008), human resource allocation problem (Jia and Gong, 2008), and engineering applications (Liu et al., 2010). In summary, few studies considered multiple project objectives optimization with a stochastic process under an uncertain environment though Chou and Le (2011) has briefly presented its applicability in a conference (Chou and Le, 2011). This work fills this gap by further delineating the novel approach that integrates PSO with MCS to deal with stochastic optimization for multi-objectives, i.e., PMOPSO, in sustainable construction project management.
Fig. 1. Research Flow
3. Research Methodology The generic design process generally yields solutions that maximize economic criteria while satisfying technical constraints. However, a new challenge has arisen in that sustainable engineers face concerns associated with project cost, project duration, and environmental issues. The proposed PMOPSO algorithm is applied to solve this problem by yielding a group of Non-Dominant Solutions (NDSs) in which all solutions are “optimized”. Fig. 1 shows the PMOPSO flowchart and its process is discussed as follows. 3.1 Monte Carlo Simulation Monte Carlo simulation is a method for iteratively evaluating a deterministic model using sets of random numbers as inputs. This method is frequently used when a model is complex and nonlinear or involves uncertain parameters. 3.1.1 Creating Model and Assessing Probability Function The first simulation step is to construct a mathematical model that contains desired simulation parameters. One must determine which parameters are random variables and which are deterministic values. A decision must be based on previous research or expert experience. After identifying random variables, the character of Vol. 18, No. 4 / May 2014
each random variable is investigated to identify the most suitable probability distribution function. 3.1.2 Generating Correlated Random Variables When generating random variables, inputs are randomly created based on their distribution functions. Generating Correlated Random Variables (CRVs) is generally more difficult than generating independent random variables. Most studies focused only on CRVs within the same family, such as normal (Scheuer and Stoller, 1962), log-normal (Jones and Miller, 1966) and gamma distribution (Corner and Kirkwood, 1996). These methods cannot yield CRVs with arbitrary distribution functions. In this work, the Normal-To-Anything (NORTA) method (Cario and Nelson, 1997) is utilized to generate CRVs X with the following properties: Xi ← FX , i =1, 2, .., n, where each FX is an arbitrary cumulative distribution function and Corr ( Xi ) = M , where M is given. The NORTA procedure has the following steps: • Compute C such that M = C ⋅ C , where C is a Cholesky lower triangular matrix • Generate an independent standard normal multivariate R • Transform R to a correlated standard normal random vector Z = (Z1, Z2, …, Zn), where Z = C ⋅ R • Compute Ui = Φ ( Zi ) i = 1, 2, …, n , where Φ is the stan-
− 855 −
i
i
Jui-Sheng Chou and Thanh-Son Le
networks (Emsley et al., 2002; Huawang and Wanqing, 2008), and Activity-Based Costing (ABC) (Niazi et al., 2006; StaubFrench et al., 2003). Of these techniques, ABC is the most effective based on its accuracy and relevance for projects (BenArieh and Qian, 2003), particularly in the design phase. Moreover, using a single-value estimation technique usually yields an unreliable outcome. Thus, the probabilistic activity-based cost estimation technique is applied to the following estimation model.
Fig. 2. Sample CPM Network
n
dard-normal Cumulative Distribution Function (CDF) –1 –1 • Compute xi = F i ( ui ), i = 1, 2, …, n , where Fi is the inverse of the marginal CDF 3.1.3 Simulation and Result Analysis After generating random variables, these values are employed to evaluate the model created in previous steps. Output is retained after each iteration. The above process is repeated until the number of iterations reaches a predefined limit. Simulation output can be presented as probability distributions (histograms) or converted into error bars, reliability predictions, tolerance zones, and confidence intervals for subsequent decisions.
F cos t =
where COSTi is the unit cost of activity i, n is the number of activities, and Fcost is project cost. 3.2.3 CO2 Emission Estimation Model The activity-based estimating method is also suitable to assessing the CEs during construction assuming that CEs come from fuel consumption of construction equipment. Since construction activity is known at this moment, the uncertainty of CEs principally comes from variance in fuel consumption; thus, fuel consumption rates are modeled as a random variate. The mathematical equation for deriving CEs is n
FCO = 2
3.2.1 Project Duration Estimation Model In this work, a Critical Path Method (CPM) is integrated with MCS to deal with uncertain project duration in the design phase. A typical CPM network (Fig. 2) can be solved with the following linear programming description (Demeulemeester and Herroelen 2002). n
∑ W i ⋅ FCi
(4)
i=1
where FCO is the total amount of CEs, n is the number of activities, and FCi is the amount of CO2 emitted to complete a unit of work of activity i. The value of FCi can be obtained by multiplying the amount of fuel used by a conversion factor for consuming fuel. Table 1 shows the CO2 conversion factor (IPCC, 2006) for various energies. 2
(1) 3.3 Stochastic Process Based on the mathematical models defined previously, one can conduct stochastic simulation. The stochastic procedure for the
i=1
Subject to: ESstart = 0 For each link between node i and j: ESi+Di ≤ ESj All variables ≥ 0 where ESi, Di, and ESj are the early start of activity i, the duration of activity i, and the early start of activity j, respectively; and ESfin is the early start of the finish activity. The probable duration of each activity can be calculated as follows: Di = W i × TIMEi
(3)
i=1
3.2 Mathematical Estimation Models
Minimize ESfin + ∑ ESi
∑ W i ⋅ COSTi
(2)
where Wi and TIMEi are the amount of work and required time to accomplish one unit of work in activity i, respectively. 3.2.2 Project Cost Estimation Model Several techniques can be utilized for cost estimation, such as parametric estimation (Chengalur-Smith et al., 1997; Chou, 2009a; Chou et al., 2009), case-based reasoning (Chou, 2009b; Thibault et al., 2006; Wu and Huang, 2008), artificial neural − 856 −
Table 1. CO2 Conversion Factor for Energy Types Fuel Crude Oil Orimulsion Natural Gas Liquids Motor Gasoline Aviation Gasoline Jet Gasoline Jet Kerosene Other Kerosene Shale Oil Diesel Oil Residual Fuel Oil LPG Ethane Naphtha
Conversion factor 3.101 2.118 2.838 3.070 3.101 3.101 3.153 3.149 2.793 3.186 3.127 2.985 2.858 3.262 KSCE Journal of Civil Engineering
Probabilistic Multiobjective Optimization of Sustainable Engineering Design
exploitation. A large value of w indicates that particle velocity is high; thus, preventing particles from being confined in local optima. Likewise, a small value of w indicates that particles are moving slowly, which causes them to exploit the same search area. Constants c1 and c2 are acceleration coefficients, which determine whether particles prefer to move closer to pbest or gbest. Notably, rand1 and rand2 are two independent random variables between 0 and 1. The termination criterion for the PSO algorithm is reaching a certain number of iterations or when the objective meets a predefined value. A generic PSO algorithm contains the following steps: Step 1: Initialize the first population swarm Step 2: Update the velocity of each particle using Eq. (5) Step 3: Update the location of each particle using Eq. (6) Step 4: Evaluate the fitness function Step 5: Update pbest and gbest Step 6: Loop to step 2 until the stop criterion is reached
4. The Novel PMOPSO Algorithm
Fig. 3. Simulation Process
activity-based estimating process is as follows: (1) identify project activities; (2) calculate the amount of work according to each activity Wi, which is a function of decision variables and other parameters; (3) fit the distributions to each cost item, time unit, and CE unit; (4) simulate project time, cost, and CEs; and, (5) determine the CDFs (Fig. 3). 3.4 Fundamentals of PSO Notably, PSO is designed to mimic the social behavior of animals in groups, such as birds in ocks or sh in schools, as well as swarm theory (Kennedy and Eberhart, 1995). The initial population consists of random individuals or particles in the search space that search for the optimal solution. Each particle is depicted by its velocity and location. The velocity of each particle is obtained by its local best (pbest), the best solution achieved through search history, the global best (gbest), and the best solution attained by the entire swarm. Suppose the search space is D-dimensional and the swarm has N particles. Particle i i i i i is located at position X = ( X 1, X 2, …, X D ) and has a velocity, i i i i V = ( V 1, V 2, …, V D ) where i = 1, 2, …, n,…, N. For each particle s s r and dimension s, the new velocity V r and position X r can be calculated using the following equations. s
s
s
s
V r ( n + 1 ) = w ⋅ V r ( n ) + c1 ⋅ rand1 ⋅ ( pbestr ( n ) – X r ( n ) ) s
+ c2 ⋅ rand2 ⋅ ( gbest – X r ( n ) ) s
s
s
X r( n + 1) = X r (n) + V r(n + 1)
(5) (6)
The function of inertial weight w is to control exploration and Vol. 18, No. 4 / May 2014
This work uses the novel PMOPSO algorithm that integrates MCS and PSO. The configuration of the probabilistic multiobjective optimization consists of a decision variable X = (X1, X2, … Xn), three objective functions-construction cost, project duration, and CEs, the lower bound (Xmin) and upper bound (Xmax) of decision variables, an unequal constraint function g(X) = (g1(X), g2(X), …, gn(X)), and an equal constraint function h(X) = (h1(X), h2(X), …, hp(X)). The problem to find X is as follows: Minimize construction cost Minimize project duration Minimize CEs Subject to gi(X) ≤ 0 i = 1, 2, …, m hi(X) = 0 i = 1, 2, …, p Xmin ≤ X ≤ Xmax The constraint-handling process developed by Li et al. (2002) is adopted based on its effectiveness and simplicity. This process is based on the degree of constraint violation, which is computed using the following equation (Li et al., 2009): Φ( x ) =
m
∑ max (0, gi( x ) )
(7)
i=1
where Φ( x ) returns a zero on the condition that all constraints are satisfied; otherwise, Φ( x ) returns a positive number when at least one constraint is violated. Due to the difficulty in fulfilling equality constraints, a constraint is considered violated when it exceeds a certain value ε. Based on this approach, a solution i is said to be a constraint-dominated solution j when any of the following conditions are satisfied: • Solution i is feasible and solution j is not • Both solution i and j are infeasible, but solution i has a smaller constraint violation • Both solution i and j are feasible and solution i dominates solution j The pseudo PMOPSO algorithm is as follows.
− 857 −
Jui-Sheng Chou and Thanh-Son Le
The mathematical expression of a bouncing routine is shown in the following equations:
Initialize first swarm randomly Initialize particle velocity Evaluate the constraint violation of each particle Evaluate objective functions Store non-dominated solutions in the archive Initialize the first pbest and gbest WHILE the terminal condition has not been reached For each particle DO Update velocity Update location Evaluate particle constraint violation using Eq. (7) Simulate objective functions Start simulation Evaluate Cholesky matrix C of each correlation matrix For each iteration DO For each objective DO Generate normal distribution R Calculate Z = C · R Compute U i = Φ( Zi ) –1 Compute xi = Fi ( ui) Compute objective function End of simulation Obtain objective values from the simulated distribution Update pbest Update archive Update gbest Increase the loop counter Return the archive as a non-dominant solution
s
s
s
s
s
s
s
s
s
s
s
(9)
X ( n + 1 ) = X min + r ⋅ (X ( n ) – X min ) if X ( n + 1 ) < X min (10) s
s
where X min and X max are the lower bound and upper bound of dimension s, respectively, and r is a random number uniformly distributed between 0 and 1. Update pbest: The personal best of each particle is updated by replacing the current pbest by the current location when the current location dominates the current pbest. Update archive: The archive is updated via two steps: (1) Insert all feasible solutions into the archive to form a temporary archive, (2) Eliminate the dominated archive in the template. Update gbest: The global best is selected from a member of the archive that dominates the fewest feasible particles in the current iteration.
5. Case Study: Roadway Pavement Construction
Initialize the first swarm randomly: The location of each particle is generated with real numbers within the lower and upper bounds. Initialize particle velocity: The initial velocity of particles is randomly generated between a minimum and maximum value. Simulate objective functions: The objective functions are simulated according to the algorithm in Section 3.1. After the stochastic process, each objective is retained. Obtain objective values from the simulated distribution: The value of each objective function is obtained from its distribution based on a desired level of reliability. In this work, the 95% confidence level is used. Update velocity: The velocity of particles is updated using Eq. s (8). To avoid vicious oscillation, velocity ( V r ) is constrained within a specified bound.
5.1 Background of Flexible Pavement Structural Design This work uses a roadway paving project as an illustrative case as roadway paving is a very common construction activity worldwide. The target structure is designed in accordance with Vietnamese specifications for flexible pavement structures (TCN274-01). After determining the materials and number of layers based on natural and regional conditions via a feasibility study, project engineers must determine the thickness of each layer to satisfy all technical requirements under the following constraint (V.M.O.T 2001): n
SN =
(11)
where SN and SNrq are the number of structures and required number of structures, respectively, n is the number of layers, and Xi , ai , and mi are the thickness, structural coefficient, and drainage coefficient of layer i, respectively. Coefficients ai and mi are determined based on characteristics of materials and the natural conditions where the project is located. According to specification TCN274-01, the required number of structures (SNrq) of the designed pavement structure is obtained from the following equation (V.M.O.T, 2001): Log10 ( W 18 ) = Z R ⋅ S0 ⋅ 9.36 ⋅ Log10 ( SN + 1 ) –0.2
(8)
∆PSI Log10 ⎛ -------------------⎞ ⎝ 4.2 – 1.5⎠ + -------------------------------------------- + 2.32 ⋅ Log10 ( MR ) – 0.87 1094 ⎞ ⎛ 0.4 + ------------------------5.19 ⎝ ( SN + 1 ) ⎠
max
where velocity bound v is generally lower than the domain of the search space. Update location: The location of each particle is calculated using Eq. (6). If a particle moves beyond the search space, it will be automatically dispatched to a feasible region. In addition to enhancing exploration capability, the new location for particles is randomly selected from the previous location to the boundary.
∑ ai ⋅ Xi ⋅ mi ≥ SNrq
i=1
s
V r ( n + 1 ) max s s max V r ( n + 1 ) = -----------------------v if V r ( n + 1 ) > v s V r(n + 1)
s
X ( n + 1 ) = X max – r ⋅ ( X max – X ( n )) if X ( n + 1 ) > X max
(12)
where W18 is the 18-kip Equivalent Single Axis Load (ESAL), ZR is the reliability coefficient, S0 is standard deviation, MR is the soil base coefficient, and ∆PSI is the performance index.
− 858 −
KSCE Journal of Civil Engineering
Probabilistic Multiobjective Optimization of Sustainable Engineering Design
Table 3. Design Inputs Parameter 18-kip Equivalent Single Axis Load Reliability Reliability coefficient Standard deviation Soil base coefficient Initial performance index Terminal performance index
Unit ESAL % KPa -
Value 7.208×10⁶ 90 -1.037 0.45 50,000 4.5 2.0
to the jobsite using dump trucks, level material using a grader, and compact material using a roller. (2) Base course construction: transport material to the jobsite using a dump truck, spread material using a grader, and compact material using a roller. (3) Spread prime coat. (4) Pave the surface: transport asphalt to the jobsite, spread asphalt using a spreader, and compact it using a roller. Each segment is applied using all four activities concurrently to reduce construction duration. Fig. 5 shows the relationships between work activities. To assess the range of probable construction time, a panel of experienced engineers is interviewed to estimate the time required for each activity. The required time to accomplish a unit of work is assessed using the following three values: minimum (a), most likely (m), and maximum (b). Conventionally, a beta distribution is employed to model time distributions; however, in this work, a triangular distribution is employed due to some drawbacks associated with the beta distribution (e.g., a beta distribution does not generate a clear-cut meaning on the lower and upper bounds and has a complex formation (Johnson, 1997). Table 4 lists activities and the three-point estimates. The empirical relationships among activities can be subjectively assessed (Touran, 1993) via quantitative evaluation (Table 5) .
Fig. 4. Plan and Section Profile of a Real Project
Fig. 5. Precedence Network for the Studied Pavement Project
5.2 Design Specification A cross section of the case project is 7 m wide with a three-layer pavement structure (Fig. 5). Table 2 describes the numerical structure characteristics and Table 3 summarizes design inputs for this case study. 5.3 Project Duration Estimation The case project is 3.7-km-long stretch of roadway from Sta. 18+600 to Sta. 22+300 and is planned to be constructed in three segments (Fig. 4) based on location of the balance point of earth moving (cut and fill). The overall project can be divided into four principal activities. (1) Subbase construction: transport material
5.4 CO2 and Cost Estimation Parameters Historical data from 23 projects are analyzed to generate input parameters for cost and CEs during construction. PALISADE BestFit software (Palisade, 2008) is utilized to determine distribution types. Table 6 describes the resulting distributions of unit cost and unit CEs for each activity. Table 7 shows the empirical correlation coefficients for project cost and CEs. 5.5 Probabilistic Optimization Results The following parameters of the PMOPSO algorithm are set after trials and a pilot study. (1) The number of particles in a
Table 2. Characteristics of Layers Layer
Material
Subbase course Crushed stone type B Base course Crushed stone type A Surface course Asphalt concrete a Obtained from TCN274-01 b Obtained from experienced engineers Vol. 18, No. 4 / May 2014
Resilient modulus (Ei, kPa) 97.0 172.5 2070.0
Structural coefficient (ai) 0.370 0.102 0.102
− 859 −
Drainage coefficient (mi) 1.0 1.0
Lower limita (cm) 15 15 6
Upper limitb (cm) 40 35 25
Jui-Sheng Chou and Thanh-Son Le
Table 4. Activities and Unit Time Estimates ID 1 2 3 4 5 6 7 8 9 10 11 12
Construction activity Subbase course of segment 1 Base course of segment 1 Prime coat of segment 1 Surface course of segment 1 Subbase course of segment 2 Base course of segment 2 Prime coat of segment 2 Surface course of segment 2 Subbase course of segment 3 Base course of segment 3 Prime coat of segment 3 Surface course of segment 3
Notation SUB1 BAS1 PRI1 SUF1 SUB2 BAS2 PRI2 SUF2 SUB3 BAS3 PRI3 SUF3
Unit m3/hr m3/hr m2/hr m3/hr m3/hr m3/hr m2/hr m3/hr m3/hr m3/hr m2/hr m3/hr
a 400 250 1500 80 400 250 1500 80 400 250 1500 80
m 500 350 2000 140 500 350 2000 140 500 350 2000 140
b 600 450 3000 200 600 450 3000 200 600 450 3000 200
Table 5. Unit Time Correlation Matrix Variables BAS1 PRI1 SUF1 SUB2 BAS2 PRI2 SUF2 SUB3 BAS3 PRI3 SUF3
SUB1 0.80 0.80 0.80 0.45 0.45 0.45 0.45 0.45 0.45 0.45 0.45
BAS1 1.00 0.80 0.80 0.45 0.45 0.45 0.45 0.45 0.45 0.45 0.45
PRI1 1.00 0.80 0.45 0.45 0.45 0.45 0.45 0.45 0.45 0.45
SUF1 1.00 0.45 0.45 0.45 0.45 0.45 0.45 0.45 0.45
SUB2 1.00 0.80 0.80 0.80 0.45 0.45 0.45 0.45
BAS2 1.00 0.80 0.80 0.45 0.45 0.45 0.45
PRI2 1.00 0.80 0.45 0.45 0.45 0.45
SUF2 1.00 0.45 0.45 0.45 0.45
SUB3 1.00 0.80 0.80 0.80
BAS3 1.00 0.80 0.80
PRI3 1.00 0.80
Table 6. Distributions of Unit Cost and CO2 Emissions Activity Unit cost Subbase course Base course Prime coat Surface course CO2 emission Subbase course Base course Prime coat Surface course
Notation
Unit
Distribution
µ
σ
COST1 COST2 COST3 COST4
USD/m3 USD/m3 USD/m2 USD/m3
Log-normal Log-normal Log-normal Log-normal
10.302 10.786 0.658 38.293
0.998 0.978 0.013 9.955
FC1 FC2 FC3 FC4
kg/m3 kg/m3 kg/m2 kg/m3
Normal Normal Normal Normal
3.915 4.685 0.352 16.694
0.402 1.359 0.133 8.065
swarm is 40. (2) The number of simulation iterations is 1000. (3) As Kennedy and Eberhart (1995) suggested, an initial weight (w) should be between 0 and 1 (Kennedy and Eberhart, 1995); thus, this work chooses 0.5 as the initial weight (w). (4) The acceleration rates are c1 = 2 and c2 = 2. (5) The velocity boundary max ( v ) is set to 5 based on the size of the search space. The proposed algorithm was coded in Matlab R2008 and tested with 1000, 2000, and 5000 iterations on a Pentium Core 2 dual E7400-computer with 2GB RAM running Windows 7. Due to the stochastic nature of the proposed algorithm, each generation is independently repeated five times. Based on the experimental finding, the best archive reaches convergence in 5000 iterations.
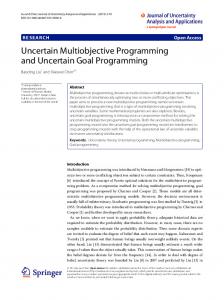
The resulting archive contains 36 NDSs. Fig. 6 visually represents these solutions. From analytical PMOPSO results, cost varies at US$341.034357.44 (a 4.81% difference) and CEs fluctuate at 167.82-173.67 tons (a 4.71% difference). The duration variation is in a smaller range than that of cost and CEs at 20.78-21.27 days (a 2.38% difference). For this case study, if the largest cost solution is chosen instead of the smallest cost solution, an additional US$ 164,000 (4.81%) needs be invested when project duration and CEs are reduced to 0.24 day (2.38%) and 1.78 tons (4.71%), respectively. Multi-objective optimization results offer additional alternatives for decision-makers by locating a set of NDSs and a
− 860 −
KSCE Journal of Civil Engineering
Probabilistic Multiobjective Optimization of Sustainable Engineering Design
Table 7. Empirical Correlation Matrices of Unit Cost and CO2 Emissions Unit cost COST1 COST2 0.80 1.00 0.15 0.15 0.45 0.45 CO2 emission FC2 FC1 0.80 1.00 0.15 0.15 0.45 0.45
Variable COST2 COST3 COST4 Variable FC2 FC3 FC4
COST3 1.00 0.15 FC3 1.00 0.80
three columns list the corresponding objectives of cost, duration, and CEs. All solutions were obtained optimally under probabilistic multi-constraints of cost, duration, and CEs. Each design solution of multi-objective problems (Table 8) is selected from the smallest cost assuming a cost-sensitive stakeholder is concerned with lowest cost while not compromising environment impact and project duration. Insignificant differences exist between the smallest cost of triple-objective optimization and bi-objectives and single-objective. On the condition that stakeholders seek the shortest project duration, a minimizing project duration problem is generally implemented. The minimal duration is 20.78 days (Table 8). However, when using PMOPSO for two or three objectives, the stakeholder also can obtain similar results by choosing the solution with the shortest duration (e.g., 20.78, 20.89, and 21.06 days for the Cost-Duration-CEs, Cost-Duration, and DurationCEs problems, respectively). Similarly, when CEs are the only concern, the minimum CEs (166.23 tons) can also be found from the single-objective function, while cost and duration are not considered in the decision-making process to satisfy typical requirements in the construction industry.
6. Conclusions
Fig. 6. Optimization Results
set of design parameters, thereby facilitating subsequent decision making for tradeoffs between project duration, cost and CEs. To compare the results of PMOPSO, and bi-objective and single-objective optimization algorithms, Table 8 lists the details of seven scenarios; each row in the table represents a solution, and the first two columns represent computing time needed to implement the algorithms and the number of solutions (for multiobjective optimization). The following three columns list the pavement thickness for each optimized solution, and the last
This work presents a novel method, the PMOPSO algorithm, which integrates multi-objective PSO and MCS, a risk analysis tool, to facilitate sustainable design decisions for cleaner construction activities. The PMOPSO algorithm uses the dominance concept to handle constraints, while employing an archive to store NDSs. The personal best of each particle is selected based on the dominance concept, which facilitates particle diversification. Further, the probabilistic estimations for construction cost, project duration, and CEs are developed to manage the uncertainty in construction. A construction project containing multiple decision variables is used to illustrate the application of the proposed PMOPSO algorithm, showing that design improvements can be achieved by reducing CEs with optimized cost-duration tradeoffs. Analytical results offer useful information for decision-makers to determine an optimal design under the consideration of cleaner production without compromising project duration and cost. This paper contributes to the domain knowledge by considering multiple project objectives optimization with a stochastic process
Table 8. The Compromise Solutions Scenario
*Computing time (hr)
No. of NDS
X1 (cm)
X2 (cm)
X3 (cm)
Lowes cost (1,000USD)
Optimized time (day)
Optimized CO2 (ton)
Cost-Duration-CEs
21.63
36
37.32
24.92
10.10
341.03
21.02
171.89
Cost-Duration 5.67 8 31.09 29.17 Cost-CEs 6.16 8 33.70 28.23 5.67 5 32.45 29.36 Duration-CO2 Cost 4.73 1 38.23 25.11 Duration 4.65 1 42.42 20.68 CEs 4.25 1 36.98 25.03 *Pentium core 2 dual E7300-computer with 2GB of RAM running Windows 7.
10.41 10.00 10.01 10.03 10.17 10.18
343.16 336.59 342.05 -
21.24 21.06 20.78 -
170.45 170.16 166.23
Vol. 18, No. 4 / May 2014
− 861 −
Jui-Sheng Chou and Thanh-Son Le
under an uncertain environment. Future work can apply this procedure to other conventional engineering design problems to ensure that construction progresses toward SD. Developing advanced parallel or grid computing techniques in comparison with other convention methods is another valuable research direction to reduce algorithm running time with an adequate technological cost for the complex multi-objective optimization problems.
Notations ai = C= c1, c2 = COSTi = Di = E= ESfin = Fcost = FCO = FCi = F−1 = FXi = 2
gi(X) = hi(X) = Xi = mi = M= MR = Nreqd = p= R= S0 = SN = SNrq = TIMEi = U= U(0,1) = Vi = w= W18 = Wi = Xi = Z= ZR = Φ(x) = ∆PSI = ε=
Structural coefficient of layer i Cholesky lower triangular matrix Acceleration coefficient Unit cost of activity i Duration of activity i Percentage error of probability Early start of the finish activity Project cost Total CO2 emission CO2 emission for activity i per unit area or volume Inverse of the function F Cumulative distribution function of random variable Xi Inequality constraints Equality constraints Thickness of layer i Drainage coefficient of layer i Correlation matrix Soil base coefficient Number of required iteration Confident interval Independent standard normal multivariate Standard deviation Structural number The required structural number Unit time of activity i Uniform distributed random variable Uniform distributed random variable between 0 and 1 Velocity of particle i Inertial weight 18-kip Equivalent Single Axis Load (ESAL) Amount of work of activity i Location of particle i Correlated standard normal random vector The reliability coefficient Constraints violation Performance index An arbitrary value to handle equality constraints
References Al-Anzi, F. S. and Allahverdi, A. (2007). “A self-adaptive differential evolution heuristic for two-stage assembly scheduling problem to
minimize maximum lateness with setup times.” European Journal of Operational Research, Vol. 182, No. 1, pp. 80-94. Ben-Arieh, D. and Qian, L. (2003). “Activity-based cost management for design and development stage.” International Journal of Production Economics, Vol. 83, No. 2, pp. 169-183. Cario, M. C. and Nelson, B. L. (1997). “Modeling and generating random vectors with arbitrary marginal distributions and correlation matrix.” Department of Industrial Engineering and Management Science, Northwestern University, Evanston, Illinois. Chatterjee, A., Chatterjee, R., Matsuno, F., and Endo, T. (2007). “Neurofuzzy state modeling of flexible robotic arm employing dynamically varying cognitive and social component based PSO.” Measurement: Journal of the International Measurement Confederation, Vol. 40, No. 6, pp. 628-643. Chau, C. K., Yik, F. W. H., Hui, W. K., Liu, H. C., and Yu, H. K. (2007). “Environmental impacts of building materials and building services components for commercial buildings in Hong Kong.” Journal of Cleaner Production, Vol. 15, No. 18, pp. 1840-1851. Chengalur-Smith, I. N., Ballou, D. P., and Pazer, H. L. (1997). “Modeling the costs of bridge rehabilitation.” Transportation Research Part A: Policy and Practice, Vol. 31, No. 4, pp. 281-293. Chou, J.-S. (2009a). “Generalized linear model-based expert system for estimating the cost of transportation projects.” Expert Systems with Applications, Vol. 36, No. 3, Part 1, pp. 4253-4267. Chou, J.-S. (2009b). “Web-based CBR system applied to early cost budgeting for pavement maintenance project.” Expert Systems with Applications, Vol. 36, No. 2 PART 2, pp. 2947-2960. Chou, J.-S. and Le, T.-S. (2011). “Probabilistic sustainable design using multiobjective optimization model.” Proc., 2011 IEEE International Conference on Industrial Engineering and Engineering Management (IEEM), pp. 625-629. Chou, J.-S., Yang, I. T., and Chong, W. K. (2009). “Probabilistic simulation for developing likelihood distribution of engineering project cost.” Automation in Construction, Vol. 18, pp. 570-577. Cole, R. J. (1998). “Energy and greenhouse gas emissions associated with the construction of alternative structural systems.” Building and Environment, Vol. 34, No. 3, pp. 335-348. Corner, J. L. and Kirkwood, C. W. (1996). “The magnitude of errors in proximal multiattribute decision analysis with probabilistically dependent attributes.” Manage. Sci., Vol. 42, No. 7, pp. 1033-1042. Demeulemeester, E. L. and Herroelen, W. S. (2002). Project scheduling a research handbook, Kluwer Academic Publishers. El-Rayes, K. and Kandil, A. (2005). “Time-cost-quality trade-off analysis for highway construction.” Journal of Construction Engineering and Management, Vol. 131, No. 4, pp. 477-486. Emsley, M. W., Lowe, D. J., Duff, A. R., Harding, A., and Hickson, A. (2002). “Data modelling and the application of a neural network approach to the prediction of total construction costs.” Construction Management and Economics, Vol. 20, No. 6, pp. 465-472. Gabel, K. and Tillman, A.-M. (2005). “Simulating operational alternatives for future cement production.” Journal of Cleaner Production, Vol. 13, Nos. 13-14, pp. 1246-1257. Godfried, A. and Annie, R. P. (1999). Sustainable construction in US-A perspective to the year 2010. Gonzalez, M. J. and Garcia Navarro, J. (2006). “Assessment of the decrease of CO2 emissions in the construction field through the selection of materials: Practical case study of three houses of low environmental impact.” Building and Environment, Vol. 41, No. 7, pp. 902-909. Guggemos, A. A. and Horvath, A. (2005). “Comparison of environmental
− 862 −
KSCE Journal of Civil Engineering
Probabilistic Multiobjective Optimization of Sustainable Engineering Design
effects of steel- and concrete-framed buildings.” Journal of Infrastructure Systems, Vol. 11, No. 2, pp. 93-101. Hong, T., Han, S., and Lee, S. (2006). “Simulation-based determination of optimal life-cycle cost for FRP bridge deck panels.” Automation in Construction, Vol. 16, pp. 140-152. Huang, Y.-S., Deng, J.-J., and Zhang, Y.-Y. (2008). “TI time-cost-quality tradeoff optimization in construction project based on modified ant colony algorithm.” Proc., 7th International Conference on Machine Learning and Cybernetics, ICMLC, July 12, 2008-July 15, 2008, Inst. of Elec. and Elec. Eng. Computer Society, pp. 1031-1035. Huawang, S. and Wanqing, L. (2008). “The integrated methodology of rough set theory and artificial neural-network for construction project cost prediction.” Proc., 2008 2nd International Symposium on Intelligent Information Technology Application, IITA 2008, December 21, 2008-December 22, 2008, Inst. of Elec. and Elec. Eng. Computer Society, pp. 60-64. Hwang, B.-G. and Ng, W. J. (2013). “Project management knowledge and skills for green construction: Overcoming challenges.” International Journal of Project Management, Vol. 31, No. 2, pp. 272-284. Hwang, B.-G. and Tan, J. S. (2012). “Green building project management: Obstacles and solutions for sustainable development.” Sustainable Development, Vol. 20, No. 5, pp. 335-349. IIGCC (2004). IIGCC briefing note climate change on and the construction sector, . IPCC (2006). Guidelines for international greenhouse gas inventories, IPCC WGI Technical Support Unit, Hadley Centre, Meteorological Office, United Kingdom. IPCC (2007). Climate change 2007: Impacts, adaptation, and vulnerability, M. L. Parry, O. F. Canziani, J. P. Palutikof, v. d. L. P. J., and C. E. Hanson, Eds., Cambridge University, Cambridge. Jia, Z. and Gong, L. (2008). “Multi-criteria human resource allocation for optimization problems using multi-objective Particle Swarm Optimization algorithm.” Inst. of Elec. and Elec. Eng. Computer Society, pp. 1187-1190. Johnson, D. (1997). “The triangular distribution as a proxy for the beta distribution in risk analysis.” Journal of the Royal Statistical Society. Series D (The Statistician), Vol. 46, No. 3, pp. 387-398. Jones, R. M. and Miller, K. S. (1966). “On the multivariate lognormal distribution.” Journal of Industrial Mathematics, Vol. 16, pp. 63-76. Kandil, A., El-Rayes, K., and El-Anwar, O. (2010). “Optimization research: Enhancing the robustness of large-scale multiobjective optimization in construction.” Journal of Construction Engineering and Management, Vol. 136, No. Compendex, pp. 17-25. Kennedy, J. and Eberhart, R. (1995). “Particle swarm optimization.” IEEE, pp. 1942-1948. Khedr, M. K. (2006). “Project risk management using monte carlo simulation.” pp. RISK.02.01-RISK.02.10. Li, B.-B., Wang, L., and Liu, B. (2008). “An effective PSO-based hybrid algorithm for multiobjective permutation flow shop scheduling.” IEEE Transactions on Systems, Man, and Cybernetics Part A: Systems and Humans, Vol. 38, No. 4, pp. 818-831. Li, L. D., Yu, X., Li, X., and Guo, W. (2009). “A modified PSO algorithm for constrained multi-objective optimization.” Proc., 2009 3rd International Conference on Network and System Security, NSS 2009, October 19, 2009-October 21, 2009, IEEE Computer Society, pp. 462-467. Lin, Y.-L., Chang, W.-D., and Hsieh, J.-G. (2008). “A particle swarm optimization approach to nonlinear rational filter modeling.” Expert Systems with Applications, Vol. 34, No. 2, pp. 1194-1199.
Vol. 18, No. 4 / May 2014
Liu, H., Cai, Z., and Wang, Y. (2010). “Hybridizing particle swarm optimization with differential evolution for constrained numerical and engineering optimization.” Applied Soft Computing, Vol. 10, No. 2, pp. 629-640. Loeffler, D., Jones, G., Vonessen, N., Healey, S., and Chung, W. (2008). “Estimating diesel fuel consumption and carbon dioxide emissions from forest road construction.” 2008 Forest Inventory and Analysis (FIA) SymposiumUSA. Mohemmed, A. W., Sahoo, N. C., and Geok, T. K. (2008). “Solving shortest path problem using particle swarm optimization.” Applied Soft Computing, Vol. 8, No. 4, pp. 1643-1653. Moussourakis, J. and Haksever, C. (2004). “Flexible model for time/cost tradeoff problem.” Journal of Construction Engineering and Management, Vol. 130, No. 3, pp. 307-314. Mussetta, M., Pirinoli, P., Selleri, S., and Zich, R. E. (2009). “Multiobjective meta-PSO techniques for optimization of antenna arrays.” IEEE Computer Society, pp. 503-505. Niazi, A., Dai, J. S., Balabani, S., and Seneviratne, L. (2006). “Product cost estimation: Technique classification and methodology review.” Journal of Manufacturing Science and Engineering, Transactions of the ASME, Vol. 128, No. 2, pp. 563-575. Oka, T., Suzuki, M., and Konnya, T. (1993). “Estimation of energy consumption and amount of pollutants due to the construction of buildings.” Energy and Buildings, Vol. 19, No. 4, pp. 303-311. Palisade (2008). Guide to using @RISK risk analysis and simulation Add-In for Microsoft Excel, New York, USA. Park, K., Hwang, Y., Seo, S., and Seo, H. (2003). “Quantitative assessment of environmental impacts on life cycle of highways.” Journal of Construction Engineering and Management, Vol. 129, No. 1, pp. 25-31. Quental, N., Lourenço, J. M., and Silva, F. N. D. (2009). “Sustainable development policy: Goals, targets and political cycles.” Sustainable Development, in press. Redclift, M. (2005). “Sustainable development (1987-2005): An oxymoron comes of age.” Sustainable Development, Vol. 13, No. 4, pp. 212227. Scheuer, E. M. and Stoller, D. S. (1962). “On the generation of normal random vectors.” Technometrics, Vol. 4, No. 2, pp. 278-281. Seo, S. and Hwang, Y. (2001). “Estimation of CO[sub 2] emissions in life cycle of residential buildings.” Journal of Construction Engineering and Management, Vol. 127, No. 5, pp. 414-418. Son, H., Kim, C., Chong, W. K., and Chou, J.-S. (2011). “Implementing sustainable development in the construction industry: Constructors' perspectives in the US and Korea.” Sustainable Development, Vol. 19, No. 5, pp. 337-347. Sonnemann, G. W., Schuhmacher, M., and Castells, F. (2003). “Uncertainty assessment by a Monte Carlo simulation in a life cycle inventory of electricity produced by a waste incinerator.” Journal of Cleaner Production, Vol. 11, No. 3, pp. 279-292. Staub-French, S., Fischer, M., Kunz, J., and Paulson, B. (2003). “A generic feature-driven activity-based cost estimation process.” Advanced Engineering Informatics, Vol. 17, No. Compendex, pp. 23-39. Suzuki, M. and Oka, T. (1998). “Estimation of life cycle energy consumption and CO2 emission of office buildings in Japan.” Energy and Buildings, Vol. 28, No. 1, pp. 33-41. Tan, R. R. (2007). “Hybrid evolutionary computation for the development of pollution prevention and control strategies.” Journal of Cleaner Production, Vol. 15, No. 10, pp. 902-906. Tan, R. R., Col-long, K. J., Foo, D. C. Y., Hul, S., and Ng, D. K. S. (2008).
− 863 −
Jui-Sheng Chou and Thanh-Son Le
“A methodology for the design of efficient resource conservation networks using adaptive swarm intelligence.” Journal of Cleaner Production, Vol. 16, No. 7, pp. 822-832. Taplin, D. M. R., Spedding, T. A., and Khoo, H. H. (2006). “Use of simulation and modelling to develop a sustainable production system.” Sustainable Development, Vol. 14, No. 3, pp. 149-161. Thibault, A., Siadat, A., and Martin, P. (2006). “A framework for using a case based reasoning system applied to cost estimation.” Proc., 2006 IEEE Conference on Cybernetics and Intelligent Systems, June 7, 2006-June 9, 2006, Inst. of Elec. and Elec. Eng. Computer Society. Touran, A. (1993). “Probabilistic cost estimating with subjective correlations.” Journal of Construction Engineering and Management, Vol. 119, No. 1, pp. 58-71. Upton, B., Miner, R., Spinney, M., and Heath, L. S. (2008). “The greenhouse gas and energy impacts of using wood instead of alternatives in residential construction in the United States.” Biomass and Bioenergy, Vol. 32, No. 1, pp. 1-10. V. M. O. T (2001). “Vietnam specification for flexible pavement design (TCN274-01).” Tranportation Publisher, Hanoi, Vietnam. Wang, W.-C., Dzeng, R.-J., and Lu, Y.-H. (2007). “Integration of simulation-based cost model and multi-criteria evaluation model for bid price decisions.” Computer-Aided Civil and Infrastructure Engineering, Vol. 22, No. 3, pp. 223-235. Williams, K. and Dair, C. (2007). “What is stopping sustainable building in
England? Barriers experienced by stakeholders in delivering sustainable developments.” Sustainable Development, Vol. 15, No. 3, pp. 135147. Wu, Y. and Huang, Z. (2008). “Application of a case-based reasoning method in estimating the power grid project cost.” Proc., 2008 International Conference on Wireless Communications, Networking and Mobile Computing, WiCOM 2008, October 12, 2008 - October 14, 2008, Inst. of Elec. and Elec. Eng. Computer Society, Wuhan University, China; Dalian University of Technology, China; IEEE Antennas and Propagation Society; Scientific Research Publishing, USA; IEEE Communications Society. Yang, I. T. (2005). “Impact of budget uncertainty on project time-cost tradeoff.” IEEE Transactions on Engineering Management, Vol. 52, No. 2, pp. 167-174. Yang, Q. (2009). “Application of time-cost-quality tradeoff optimization model based on improved PSO algorithm to construction project.” Proc., 2009 Asia-Pacific Conference on Information Processing, APCIP 2009, July 18, 2009-July 19, 2009, IEEE Computer Society, 298-301. Yasantha Abeysundara, U. G., Babel, S., and Piantanakulchai, M. (2009). “A matrix for selecting sustainable floor coverings for buildings in Sri Lanka.” Journal of Cleaner Production, Vol. 17, No. 2, pp. 231238.
− 864 −
KSCE Journal of Civil Engineering