PROBABILISTIC SIZING OF WIND AND HYDROGEN POWER SYSTEMS FOR REMOTE AREAS Lars Nesje Grimsmo
NTNU Trondheim, Norway
[email protected]
Magnus Korpaas NTNU Trondheim, Norway
[email protected]
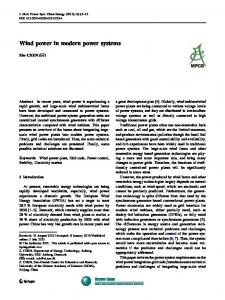
Abstract – A new probabilistic method to size all components in a wind and hydrogen stand-alone power system has been proposed. The method applies the Weibull distribution and the wind turbine power curve to analytically design the power plant. When the wind power exceeds the load, an electrolyzer produces hydrogen from the excess power. When the wind power is insufficient to supply the load, the hydrogen is utilized in a fuel cell. Power smoothing with a battery is added to comply with the operation requirements of the electrolyzer. In addition to supplying electricity to a stationary load, hydrogen can be accessed in refueling stations for mobile applications.
Keywords: wind power, hydrogen, stand-alone power systems, probabilistic models, component sizing, energy storage 1 INTRODUCTION Renewable energy sources are facing increasing attention due to environmental concern. Researchers all over the world recognizes global warming caused by human activity and the irreversible effects this may have on nature and its habitants. For remote sites renewable energy may be a costeffective alternative to high fuel prices [1]. Due to the intermittent nature of renewable energy, e.g. the diurnal variations of solar power and the stochastic behavior of wind energy, efficient and low-cost energy storage is essential to the supply security [2],[3]. Wind power is stochastically distributed. Predicting the future wind power generation is difficult, this yields both for diurnal and seasonal energy storage design. Anyhow, by probabilistic measures one can assume, within an acceptable likelihood, certain wind speed distribution patterns. The Weibull distribution is widely used for analyzing the annual wind energy potential of a site. For analyzing the diurnal wind speed patterns, mean hourly time series is sufficient [4]. Several studies have been conducted for sizing of wind and hydrogen power systems. Chronological and probabilistic methodologies are recognized as two different ways on how to size the power plants and minimize their capital cost. Chronological sizing uses a large amount of data and simulates the dynamic systems in time series to study the results. Probabilistic sizing uses statistical distributions and probability data to assume the characteristics of a site’s wind resources.
15th PSCC, Liege, 22-26 August 2005
Terje Gjengedal Statkraft Oslo, Norway
[email protected]
Traditionally utilization curves has been used to analyze the power demand [5][6][7][8][9]. This paper introduces a new methodology based on the probabilistic sizing principles. The methodology was thoroughly investigated in [5], where the methodology was used to perform a case study for the arctic city Longyearbyen on Svalbard, an island close to the North Pole. An active-stall regulated wind turbine provides the power system with renewable energy. An alkaline electrolyzer produces hydrogen for seasonal energy storage. The hydrogen is stored in a high-pressure tank. During periods of low wind and high load, a PEM fuel cell generates the required electricity. A battery provides power smoothing and diurnal energy storage. In addition to the stationary electric load, hydrogen is accessed for mobile applications. An analytical relation between the wind and the load is found by time series regression. In northern countries there is a clear relation between the wind speed and the electric energy consumption, since the wind speed is highest at winter time, correlated with the higher energy consumption for lights and heating. 2
POWER SYSTEM MODELING
2.1 Power plant configuration
Figure 1: Illustration of a stand-alone wind and hydrogen power plant with a local electric load. In addition, hydrogen is accessed from the hydrogen storage tank.
Figure 1 illustrates a stand-alone wind and hydrogen power system that feeds a local electric load. Wind energy is transformed to AC power in the wind farm. The electric load is supplied instantly from the wind farm when there is sufficient generation. If the wind power exceeds the load, the excess power is converted to DC power for operating the electrolyzer. The battery is used to smooth the turbulent wind power to protect
Session 27, Paper 1, Page 1
the electrolyzer from wear due to rapid and large wind power variations. The electrolyzer produces hydrogen and oxygen from water, and stores the hydrogen in a high-pressure storage tank. If the site uses hydrogen for other purposes than to store energy, for example as fuel for mobile applications, hydrogen is accessed from the storage tank. When wind power is insufficient to feed the load, the fuel cell is operated to supply the required electricity. 2.2 Wind speed modeling The wind is modeled with the Weibull distribution. From a large time series of wind data the shape factor c and the scale parameter k of the Weibull distribution can be calculated with equations (1) and (2). The Weibull probability distribution is then given by equation (3) [4]. v (1 1/ k )
c
plotted together with the belonging Weibull probability distribution [5]. This figure illustrates that the Weibull distribtion is a good representation of the wind resources at a site. However, it should be noted that the imperfectness of the Weibull distribution compared to the histogram may be a significant source of error. The imperfectness is shown with the area between the Weibull distribution and the histogram 2.3 Load modeling Historical data is used for load modeling. For the electric power and distributed heat, 24-hour averages are used. For the hydrogen load, one-month averages are used. 2.4 Wind and load regression
(1)
1.086
k
w(v)
(2)
v
k c
v c
k 1
exp(
v c
k
)
(3)
The gamma function in equation (1) is described by the following equation [4]: ( x)
0
exp( u ) u x 1du
(4)
When using equations (1) through (4), the Weibull distribution can be plotted together with a histogram of the time series wind data [6].
Figure 2: The blue line illustrates the Weibull probability distribution. The histogram is plotted for the same time series of wind data that was used to produce the Weibull distribution.
In Figure 2, a histogram representing 10 years of hourly mean wind data from Ny Ålesund on Svalbard is
15th PSCC, Liege, 22-26 August 2005
Figure 3: The lower line shows the monthly mean wind speed for Ny Ålesund on Svalbard. 10 years of hourly measured wind data were used. The upper line is the monthly generation of the coal fired power plant in Longyearbyen on Svalbard. The left y-axis refers to coal power generation and the right y-axis refers to wind speed. The reader might notice the low wind speed for Ny Ålesund, which is lower than 5 m/s for all months. Data from this site is used due to access to good measurement data. The data is correlated to the higher Longyearbyen wind speed before it is used in any calculations.
The correlation between the seasonal variations of the wind speed and the seasonal variations of the enduser load is illustrated in Figure 3 [5]. The figure indicates that one can find an analytical relation between wind speed and load by statistical methods. Figure 4 illustrates load regression to wind speed, the same data as was used for Figure 3 is used here. The red line is the load plotted versus the wind speed. The blue dotted lines are the load and wind regression lines with various order. The regression is generated with the MatLab-function polyfit. With time series analysis, a relation between wind speed and end-user load is found. For the wind and load data that was used in the work of [5], an order of three was the best suited, however; the regression order should be chosen with care for each site. The MatLab function polyfit is a good function to perform regression on wind and load [11]
Session 27, Paper 1, Page 2
Figure 4: Results of wind and end-user load regression, using the time series data used in Figure 3. The red line is the load plotted versus wind speed. The blue dotted lines are different regressions of load to wind speed with various regression order.
3
OPTIMAL SIZING OF THE POWER PLANT
3.1 Optimizing parameters The main objective of optimizing the power plant is to reduce the cost to the minimum. This is achieved by searching the least expensive combination of the component sizing that complies with the optimization parameters. One of the optimization parameters is the supply security. A stand-alone power system must always provide the energy demanded by the users. One can not accept to run short of hydrogen. This yields specially for arctic environments, where a power system shut down of more than 24 hours calls for total evacuation of the place. Efficiency is an important optimization parameter. Due to the high cost of hydrogen related components, e.g. the electrolyzer, the hydrogen storage tank and the fuel cell, it is usually economically profitable to oversize the wind farm [8]. To prevent a solution with too many wind turbines for a limited site, one could determine minimum system efficiency. If not, the cost optimization will call for an exaggerated large wind farm. 3.2 Operational strategies To ensure the highest realizable efficiency and the best possible supply security, the operational strategies have to be stated with care. Literature provides extensive experience in the operation of hybrid energy systems; among them will [2], [8], [9] and [10] provide a good understanding of the operational strategies required for a stand-alone wind and hydrogen power system. This article presents the operational strategies of [5], which are summarized below. - Available wind power should be supplied instantly to the load when requested. This ensures high effi-
15th PSCC, Liege, 22-26 August 2005
ciency since the greatest losses is in the hydrogen energy storage chain. - When the wind power is insufficient to supply the load, the fuel cell is operated to supply the required power. - To protect the electrolyzer from frequently being shut on and off, a battery is used to smooth the wind power fed to the electrolyzer. The second priority is to power the electrolyzer when it is already operational, and otherwise fully charge the battery before the electrolyzer is turned on. - The third priority, if the electrolyzer is shut off, is to charge the battery when the excess wind power is larger than the nominal electrolyzer power, and to start operating the electrolyzer when the battery is fully charged. - As a fourth possibility the system dumps the excess wind power. When the load is supplied, the battery is fully charged or operated at the maximum power and the electrolyzer is operated at maximum power or the hydrogen storage tank is full, exceeding wind power is dumped either by heating water in an electrical boiler or by downregulating the wind power output.
4
METHODOLOGY
4.1 Power curves The wind turbine power curve links the wind power generation to the wind speed. Further, by using the operational strategies, one can assume power curves for the electrolyzer, the fuel cell and the battery, that links the operation power of the components to the wind speed. To determine static power curves for the battery, the electrolyzer and the fuel cell, based on the wind turbine power curve and the operational strategies, one need to know the relation between the load and the wind speed. The regression of wind and load was presented in chapter 2.4. It is purely statistical, but one can link the power curves to the simultaneous load, which provide a powerful tool for modeling and optimization of the system sizing. Since the power curves share the same xaxis as the Weibull distribution, the power generation due to wind speed is linked to the annual energy generation. These factors are used to size all the components relative to each other. By exploiting the integral in equation (5), the power production and consumption between certain wind speeds can be obtained. In the equation below, the wind speed integral limits are given as zero and 25 meters per second. Usually wind turbines are shut down at 25 m/s to prevent wear. With the wind speeds where the different power curves intercept as integral limits, one can calculate the hydrogen energy required to fuel cell backup powering and hydrogen refueling to mobile applications. The annual hydrogen demand, both for refueling to mobile applications and fuel cell powering,
Session 27, Paper 1, Page 3
and the operative periods of the electrolyzer is used to determine the electrolyzer’s nominal power. This is explained in the next sections. In equation (5) Eannual is the total energy generation from the wind farm for one statistical year. PWF is the summarized power curve for the wind farm, and w(v) is the Weibull distribution.
Eannual
8760
25 0
w(v) PWF (v)dv
(5)
4.2 The wind farm The methodology is based on considering a specific wind turbine and a specified wind farm nominal power. The wind farm power curve is collected from the multiplication of the single turbine power curve and the number of wind turbines in the wind farm. Regarding expected annual energy generation from equation (5) and the predicted energy demand, one calculates the least possible number of wind turbines. The algorithm described below is performed one time for each wind turbine added to the wind farm. For each specific nominal wind farm power, it exist one unique and optimal sizing solution for all the other components. Adding one by one wind turbine to the wind farm, the algorithm is ended when the capital cost is continuously increasing, or if the minimum system efficiency due to dumped wind power is reached. The user is left with a series of solutions. If cost is the sole optimization parameter the solution with the lowest capital cost is chosen. If other parameters, like efficiency or supply security, another solution which complies better with the sizing targets is chosen. 4.3 The hydrogen storage tank The second step of the algorithm is to design the hydrogen storage tank. The hydrogen storage tank is a seasonal storage; hence it should withhold the amount of hydrogen required by the fuel cell in the low wind period. The sizing of the storage tank equals the annual demand of hydrogen in volumetric units. The area in Figure 5 with the diagonal lines represents the annual energy required to be stored in the hydrogen energy storage. In the example shown in this figure, the electric load is modelled as a constant, and no hydrogen is accessed for refuelling to mobile applications. The integral of the product of the Weibull distribution and the difference between the load curve and the wind turbine power curve gives the utilization factor for the fuel cell. The energy required from the fuel cell throughout the year is calculated by multiplying this number with 8760 hours. The lower integral limit is zero wind speed. The upper integral limit is the wind speed for which the wind farm power curve and the electric load equals. This is where the black horisontal load line and the blue power curve line intercepts in Figure 5.
15th PSCC, Liege, 22-26 August 2005
The annual demand for energy from the fuel cell is estimated with equation (9) fuel cell efficiency and the conversion factor between kWh´s and Nm3’s, the hydrogen storage tank volume is calculated.
Figure 5: The Weibull distribution is used to determine the annual hydrogen demand. The blue line is the wind turbine power curve, the black line marked w(v) is the Weibull distribution and the horisontal black line is the load. In this figure the load is modelled as a constant.
4.4 Sizing the electrolyzer The next step is to determine the minimum nominal electrolyzer power. The electrolyzer should produce enough hydrogen for backup power in the low wind periods. Since the electrolyzer cost is based on the nominal power, it is designed as small as possible.
Figure 6: The area marked with diagonal lines represents the operative area for the electrolyzer.
Figure 6 illustrates the fundamentals of determining the nominal power of the electrolyzer. The electrolyzer is sensitive to rapid power variations and low power operation. Thus the electrolyzer should not be operated below a certain factor of the nominal power. This is represented by Pely,f in the figure. The electrolyzer’s power curve is limited by the upper nominal power, the lower factor of the nominal power, and the wind turbine power curve in between. With this methodology the smallest possible nominal power of the electrolyzer is determined by iteration. The smallest possible electrolyzer satisfies the annual hydrogen demand according to the wind turbine power
Session 27, Paper 1, Page 4
curve, the Weibull distribution, the losses in the electrolysis process and the conversion of the hydrogen in the fuel cell. Equation (10) gives the annual production of hydrogen with the electrolyzer power curve in Figure 6. The iterative process suggests a nominal electrolyzer power which is lower than the maximum excess power. If the hydrogen production is larger than what is required from equation (6), the next iteration step continues with a smaller nominal electrolyzer power. If the hydrogen production is insufficient to supply the requirements stated in equation (6), the next iteration step continues with a larger nominal electrolyzer power. In equation (6), LoadH2 is the electric energy that should be provided from the fuel cell. EH2 is the hydrogen energy produced by the electrolyser, and FC is the fuel cell efficiency. Load H 2
EH 2
1
(6)
FC
the wind farm, so that the electrolyzer can be powered for a few hours and prepare to shut down . The energy capacity is found by multiplying the mean discharge power by the minimum number of hours the battery is expected to operate the electrolyzer. Equation (11) states how to calculate the mean discharge power for the battery. 4.6 Sizing the fuel cell The fuel cell should be sized according to the maximum expected load, as it might happen that maximum load and zero wind power may occur at the same time. 4.7 Sizing the hydrogen storage Hydrogen may be requested for refueling to mobile applications as well as for energy storage to backup the stochastic wind power. In general it is not more complicated to use the same methodology for this purpose. However, one should carefully watch whether the electric equivalent of the hydrogen load exceed the minimum operational power of the electrolyzer. The reason is illustrated by the difference in Figure 8 and Figure 9.
When the annual hydrogen electrolysis fulfills the requirement of equation (7), the iteration is ended. For this case the upper hydrogen production limit is set to ten percent excess hydrogen production. The user can define reasonable limits. In equation (7), LoadELY is the annual electric energy fed to the electrolyzer.
Load ELY
[1 1,1] Load H 2
1
(7)
(8)
ELY
4.5 Sizing the battery The purpose of the battery is to smooth the power supplied to the electrolyzer. The electrolyzer is sensitive to large power variations, frequent on/off switching and low power operation. The battery is designed to power the electrolyzer at the minimum power for a certain number of hours.
Figure 7: Illustration on how to determine the battery energy capacity and the necessary battery power.
The power of the battery should equal the minimum electrolyzer power, in case of an urgent shut down of
15th PSCC, Liege, 22-26 August 2005
Figure 8: Hydrogen storage tank sizing with the electric equivalent of the hydrogen load larger than the minimum operational electrolyzer power.
Figure 9: Hydrogen storage tank sizing with the electric equivalent of the hydrogen load less than the minimum operational electrolyzer power.
Equation (12) gives the hydrogen storage tank relation in Figure 8, when minimum operational electrolyzer power is less than the electric equivalent of the
Session 27, Paper 1, Page 5
hydrogen load. Equation (13) gives the hydrogen storage tank relation when minimum operating electrolyzer power exceeds the electric equivalent of the hydrogen load.
5
RESULTS
5.1 Battery sizing Studies have shown that using a battery to smooth the wind power output, when only hydrogen is produced, is successfully implemented and optimal design is provided [6] and [7]. However, studies resulting in this article [5] [6] [7] show that the battery may be omitted. The energy value of the energy stored by the battery is less than the cost of the battery. Also, for the cost of the battery sized according to this methodology, one could double the electrolyzer power and significantly reduce the dumped wind power. Further work would gain from studying better regulation of the wind power and smoothing of the wind power on a smaller scale than the diurnal used in this work.
only needs to produce and store hydrogen between two upper halves of the sine curves. 5.3 Electrolyzer sizing The electrolyzer was sized rather well, for some exceptions the annual hydrogen production missed by ten percent of the demand, but for most of the cases the hydrogen matched the consumption perfectly. In Figure 10 one can see a simulation where the hydrogen production and consumption matches each other perfectly, but the hydrogen storage tank is sized too large.
6 CONCLUSION A new probabilistic method designed to size all components in a wind and hydrogen stand-alone power system has been proposed. The method applies the Weibull distribution and the wind turbine power curve to analytically design the power plant. The Weibull method designs the systems well. The hydrogen production meets the demand with less than a 10 % error. It is noted that the battery may not be necessary due to low utilization and high cost compared to value. Moreover, the hydrogen storage tank is sized too large, It is therefore suggested that frequency analysis of the wind data time series could ensure a proper design of the tanks. NOMENCLATURE
Figure 10: Relative hydrogen pressure in the hydrogen storage tank throughout one year, the hydrogen production and the consumption match eachother perfectly. This figure is collected from a simulation with wind data from the site Slettnes in Norway.
5.2 Hydrogen storage sizing The hydrogen storage tank sizing was generally too large. One reason for this is the insufficient time series analysis of the wind resources. Recalling equations (1) through (3), the Weibull parameters were calculated from the mean wind speed and the standard deviation. However, imagining two sine curves, one with twice the frequency of the other; both have the same mean value and standard deviation. Those two sine curves can represent two different time series of wind data. Designing a stand-alone wind and hydrogen power plant for a mean load equal to the mean of those sine curves, both would have the have the same optimal hydrogen storage sizing. Thus, with the time series with twice the frequency of the other, one would only need half the hydrogen storage tank volume, since one
15th PSCC, Liege, 22-26 August 2005
Main symbols: E: Energy unit. Load: Energy unit. P: Fixed power unit. P(v): Power curve. vP: Wind speed according to a power “P” in the wind turbine power curve. w(v): Weibull probability function. : Efficiency.
ADDITIONAL EQUATIONS EH 2 Load ELY 8760
vload
8760
vcut v ELY
0
8760 out
vELY vELY , f
w(v) ( PWF (v) Pload (v ))dv
(9)
(10)
w(v) PELY dv vely
Pdch
w(v ) ( Pload (v) PWF (v))dv
vload
w(v) ( PELY , f vely vload
PWF (v))dv
w(v )dv
(11)
Session 27, Paper 1, Page 6
EH 2
1
8760
vload , EL 0
FC
8760 8760
vELY , f
vload , H 2 vELY , f
(12)
w(v ) ( PH 2, refueling (v) PEL (v) PWF (v))dv
8760
1
vload , EL
FC
8760
PWF (v))dv
w(v ) PH 2, refueling (v )dv
0
EH 2
w(v ) ( PEL
vELY , f 0
0
w(v) ( PEL (v ) PWF (v ))dv
[10]A. G. Dutton et al, “Experience in the design, sizing, economics, and implementation of autonomous wind-powered hydrogen production systems”, International Journal of Hydrogen Energy 25, pp 705722, 2000. [11]www.mathworks.com
(13)
w(v ) PH 2, refueling (v)dv
REFERENCES [1] Ø. Ulleberg and T. L. Pryor, ”Optimization of integrated renewable energy hydrogen systems in diesel engine mini-grids”, Proceedings of the 14th World Hydrogen Energy Conference in Montreal, June 2002 [2] S. Kélouwni, K. Agbossou, R. Chahine, “Model for energy conversion in renewable energy system with hydrogen storage”, Journal of Power Sources, når??, 2004 [3] S.R Vosen and J. O. Keller, ”Hybrid energy storage systems for stand-alone electric power systems: optimization of system performance and cost through control strategies”, International Journal of Hydrogen Energy 24, pp 1139-1156, 1999 [4] D. Weisser, “A wind energy analysis of Grenada: an estimation using the ‘Weibull’ density function”, Renewable Energy 28, pp1803-1812, 2003 [5] L. N. Grimsmo, “Wind and hydrogen stand-alone power systems”, Master thesis, NTNU, Trondheim, 2004 [6] L. N. Grimsmo, “Systemstudie av vind og hydrogen i autonome system (in Norwegian)”, Preproject thesis, NTNU, Trondheim, 2003 [7] L. N. Grimsmo, M. Korpaas, T. Gjengedal and S. Møller-Holst, ”A Study of a Stand-alone Wind and Hydrogen System”, Proceedings of the Nordic Wind Power Conference, March, 2004 [8] M. Korpås, Distributed Energy Systems with Wind Power and Energy Storage, Doctoral Thesis at NTNU, Trondheim, 2004. [9] M. Korpås, A. T. Holen and R. Hildrum, “Operation and Sizing of Energy Storage for Wind Power Plants in a Market System”, International Journal of Electrical Power and Energy Systems 25, pp 599606, 2003
15th PSCC, Liege, 22-26 August 2005
Session 27, Paper 1, Page 7