Available online at www.sciencedirect.com
ScienceDirect Procedia Computer Science 00 (2018) 000–000 www.elsevier.com/locate/procedia
International Conference on Intelligent Computing In Data Sciences
Building a fast Intrusion Detection System for High-SpeedNetworks: Probe and DoS attacks detection Taha AIT TCHAKOUCHT*, Mostafa EZZIYYANI University of Abdelmalek Essaadi, Faculty of Sciences and Techniques, Old Road of Airport, Km10, PB.416, 90000,Tangier, Morocco
Abstract
Using computers and other intelligent devices associated with internet has become vital in the modern life. Banking transactions, education, trade marketing, social networking, etc. are all examples of those daily and important operations that rely on such technologies, which have generated a large amount of data transiting with high velocity in the last decade. This was accompanied by an extraordinary growth in number and sophistication of cyber threats, going from opportunistic and unstructured to targeted and highly structured. Thus, detecting intrusions in such circumstances requires high levels of accuracy and efficiency, so that heavy losses are prevented. Many intrusion detection models in the literature do not propose real-time solutions to deal with the aforementioned obstacles. This motivates us to propose a lightweight intrusion detection system, for probe and DoS attacks detection. We select the most important set of features using Information Gain (IG), and Correlation-based Feature (CFS) selection filters, applied on a resampled version of KDD’99. Furthermore, we employ four machine learning methods, namely C4.5, Naïve Bayes (NB), Random Forest (RF) and REPTree, as wrappers. Results show good detection and false positive rates, of around 99.6%, and 0.3% for DoS attacks, and 90% and 0.5% for Probe attacks. Processing time is also optimized when evaluated using the best selected feature subset. © 2018 The Authors. Published by Elsevier B.V. This is an open access article under the CC BY-NC-ND license (http://creativecommons.org/licenses/by-nc-nd/3.0/). Selection and peer-review under responsibility of International Neural Network Society Morocco Regional Chapter. Keywords: Intrusion detection; Filters; Wrappers ; Feature Selection;High-Speed-Network;
* Taha AIT TCHAKOUCHT. E-mail address:
[email protected] 1877-0509© 2018 The Authors. Published by Elsevier B.V.
This is an open access article under the CC BY-NC-ND license (http://creativecommons.org/licenses/by-nc-nd/3.0/). Selection and peer-review under responsibility of International Neural Network Society Morocco Regional Chapter.
Taha AIT TCHAKOUCHT/ Procedia Computer Science 00 (2018) 000–000
1. Introduction
Since 80s and 90s, Internet has revolutionized the whole world. With the launch of WWW, sectors like Education, Politics, Commerce, Press, Tourism, Mail Services, and Banking are now connected, and related services are reachable through Internet. In recent years, the use of such services along with social networking and multimedia streaming has been generating, daily, a large amount of data over the internet, with a very high speed. However, this couldn’t be without risks; Valuable data that should be kept out of the procuration and the visibility of unauthorized users are exposed to destruction or/and disclosure, due to the increasing rate of cyber-threats that have evolved as well both in number and complexity. Indeed, exploits are omnipresent and can happen anytime. Internet web servers are exposed to attacks using automated tools and exploit scripts that capitalize on well-known vulnerabilities. There are several sources for these kinds of automated tools maintained by the hacking community. Since 2016, the targeted attacks landscape has changed considerably, as new motives such as subversion and sabotage are emerging [1]. 2016 and 2017 were marked by a myriad of highly structured attacks including the Mirai botnet of infected Internet of Things (IoT) devices, that was responsible for the biggest storm of DDOS attacks ever recorded, the destructive malware Shamoon targeting organizations in Saudi Arabia, A disk-wiping malware causing power outages in Ukraine, as well as the claimed subversive activities attempting to disrupt US elections and targeting other governments [2]. Intrusion Detection systems (IDS) have emerged as one of the most important security solutions to consider. They have several advantages compared to other security tools. Apart from detection, they can archive event data, allow reports, and encounter novel and complex attacks. All these features make IDSs to offer an additional service that helps in protecting the organizations. Since the works of Anderson [3], Denning [4] and Staniford-Chen [5], that inspired researchers, many IDS models have been proposed to extend research works around IDS technology. An intrusion can be defined as any illegal activity that aims at wiping network resources or getting access to the core system data. Based on the mechanisms used to compromise the information system, intrusions can be classified into four categories [6]. Probe attacks are aimed at gathering information about the target network from a source that is often external to the network. Denial-of-Service (DoS) attacks results in an interruption of the service by flooding the target system with illegitimate requests. Remote-to-Local (R2L) is the attempt to gain illegal access to a system’s account by exploiting its vulnerabilities, while User-to-Root (U2R) occurs when a user tries to gain super user privileges. Two families of intrusion detection methods are to mention; Signature-based and Anomaly-based. To recognize attacks, Signature-based approaches such as USTAT [7] and IDIOT [8] require a library of signatures of all known attacks and their variants, while Anomaly-based approaches like W&S [9], consist of establishing a user/network ’s normal behaviour, and tracking any deviation that results from an intrusive activity. Some IDSs like NIDES [10] and EMERALD [11] combine the two methods. Although anomaly-based methods are not widely commercialized due to the high rate of false alarms generated, they are of a crucial importance as they can detect zero-day attacks, and thus more related research works are conducted. One of the main techniques used in network anomaly-based systems, is to monitor and capture network traffic, and analyze different features of a TCP/IP connection to look for anomalous patterns that indicate the presence of an eventual attack. KDD’99 [12] use 41 features as described in MADAM ID Framework [6], participating in the DARPA Intrusion Detection Evaluation Program [13]. The 41 features are classified into intrinsic features that are used for general analysis, and traffic and content features, each designed to detect a specific type of intrusions when combined with intrinsic features. Using the 41 features in model building is likely to impact both accuracy and efficiency as some features can be redundant or irrelevant. This can be problematic in high speed networks where any delays can make the system to be compromised for some period of time before raising any alarms. Our main contributions in this work are the following: • Using filters IG and CFS, as well as wrappers NB, C4.5, RF and REPTree for feature subset selection. • Using classification methods NB, C4.5, RF and REPTree to select the best 19 features for Probe detection, and the most important 9 features for DoS detection. • Improving detection and False alarm rates. Results show competitive performances w.r.t the literature. • Optimizing system’s processing time as to represent a real-time solution
Taha AIT TCHAKOUCHT/ Procedia Computer Science 00 (2018) 000–000
The remainder of this paper is organized as follows: Section 2 presents some related work. Section 3 describes pre-processing including the process of feature selection. In Section 4 experimental results and performance comparison are discussed. Finally, Section 5 describes conclusion and opens to new perspectives.
2. Related work Intrusions detection systems (IDS) have been proposed to provide an additional layer of defence to security systems. More interest is accorded to this field as security incidents are continuously growing in number and complexity. Basically, IDSs can be classified based on detection method and audit data source [14-15]. Detection method include anomaly-based and misuse-based approaches. Data analysed emanates either from network traffic or log files. Network anomaly detection (NAD) is an important task for identifying network attacks, especially zero-day ones. An anomaly or outlier, is referred to as a pattern that does not conform with a previously established normal profile, in such a way that it was eventually generated from a different mechanism [16]. Anomalies differ in nature and complexity [17]. Point anomaly is an observation that behaves abnormally w.r.t the rest of data. Collective anomaly occurs when a set of data instances indicate the existence of an anomaly, though each individual instance is not necessarily anomalous. Finally, context anomaly happens when a data instance is anomalous in some specific context. Network attacks can be identified, when mapping them with the types of anomalies. DoS is considered as a collective anomaly, as it requires sending multiple requests to a web server [18]. Probes are mapped to contextual anomaly since they depend on the intention of the user, while R2L and U2R are considered point anomalies [19]. Axelsson [15], classifies IDSs into Self-learning and Programmed techniques. Self-learning includes rule modelling, statistical methods, Neural network-based and Immune systems, while programmed methods include simple statistics and simple rule-based. In [20] authors implemented a statistical time series model, taking into consideration order and inter-arrival times of the observations as well as their values. A new instance is flagged as abnormal if its probability of occurrence is too low. Mahoney and Chan [21] present a rule-based technique for intrusion detection. It consists of analyzing packets payloads and identifying rare events in time-series data. The method requires an attack-free dataset used to learn patterns and build rules for network normal profile modelling. In [22], Zhang et al. propose a model that combines statistical model with neural networks, in which the statistical preprocessor converts network traffic data to a probability density function (PDF), which is compared to a preestablished PDF of the normal traffic, to calculate a similarity vector. This deriving vector will finally be classified using Neural network. In [23], authors combine SVM and clustering using ant colony network for intrusion detection. Wang et al. used various techniques to detect anomalous pattern of data, such as HMM [24] and k-nearest neighbor [25]. In [26], the Dempster-Shafer belief theory is used to detect injection attacks in wireless networks. To evaluate Intrusion detection techniques, KDD’99 [12] is the most widely used, since there is no much publicly available for assessing network anomaly detectors. Feature selection is an important preprocessing task, as some features can impact the accuracy and efficiency of the classification process. Several works use all the 41 features of KDD’99 in building and evaluating their techniques. This can be problematic in high speed networks. Other studies have considered using only relevant features, thus reducing processing time while achieving good performances. Kayacik et al. [27] and Araujo et al. [28] have reduced the number of features to 15 and 14 respectively, while Aljarrah et al. [29] select the most 16 important features. Rathore et al. [30] used both forward selection ranking (FSR) and backward elimination ranking (BER) to select the 4 best features, while Wang et. al [31] considered using only 10 features to detect network attacks, using information gain (IG), C4.5 [32] and Naïve Bayes (NB) [33] classification techniques. In this work, we employ both Correlation-based feature selection (CFS) [34] and IG filter techniques, along with NB, C4.5, Random Forest (RF) [35], and REPTree [36] as wrappers to select and evaluate the feature subsets. Selecting a feature is decided after consideration of all employed methods. We also inspect whether including a feature would impact accuracy and efficiency.
Taha AIT TCHAKOUCHT/ Procedia Computer Science 00 (2018) 000–000
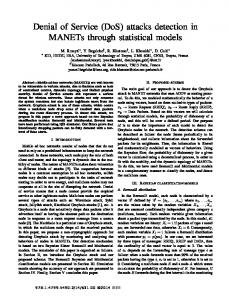
Fig. 1. General scheme of the preprocessing stage
3. Proposed Model
3.1. Pre-processing Some preprocessing operations are performed on KDD’99 to prepare appropriate sets of data to be used in feature selection and model building. Fig.1 represents the general scheme of the preprocessing stage. Each step will be described in more details. • Data tranferring: KDD’99 feature subset contains both numeric and symbolic features for an overall of 41 features as shown in Table.1. Symbolic features such as protocol_type (e.g. tcp), Service (e.g. ftp, http, telnet) and Flag (e.g. OTH, REJ) are converted to numeric values. Protocol_type counts 3 values, Service regroups 70 values and Flag is precisely an 11 values feature. • Data balancing: KDD’99 contains highly skewed distribution of the class labels, with a high rate of DoS attacks (79% of the instances) comparing to the other classes. To avoid the effects of imbalanced data, especially the bias towards the majority class, data is resampled and split into 4 subsets of data for both training and testing purposes, based on 10% of KDD’99. Each subset contains normal/specific attack instances. Further details are provided in section 4.
3.2. Feature Selection One problematic task that comes after Data collection and feature construction, is extracting the most effective set of network features, to efficiently detect the various network anomalous patterns. This is referred to as feature selection. Such operation can be performed using either Filter techniques, that focus only on the general characteristics of the data, or Wrapper techniques that utilize a learning algorithm to evaluate the merit of a feature subset, and thus require more processing time. Multiple classification algorithms such as Random Forest, C4.5, Naïve Bayes and REPTree as well as filter methods are used to select subsets of features and detect intrusions.
Taha AIT TCHAKOUCHT/ Procedia Computer Science 00 (2018) 000–000 Table 1. KDD’99 features Id
Name
Id
Name
Id
Name
1
Duration
11
Num_failed_logins
22
Is_guest_login
2
Protocol_type
12
Logged_in
23
Count
3
Service
Num_compromised Root_shell
Srv_count
Flag
13 14
24
4
25
Serror_rate
5
src_bytes
15 16
Su_attempted Num_root
26
Srv_serror_rate
6
dst_bytes
Rerror_rate
7
Land
17 Num_file_creations 18 Num_shells
27 28
Srv_rerror_rate
8
Wrong_fragment
19 Num_access_files
29
Same_srv_rate
9
Urgent
20 Num_outbound_cmds
30
Diff_srv_rate
10
hot
21 Is_hot_login
31
Srv_diff_host_rate
Id 32 33 34 35 36 37 38 39 40 41
Name Dst_host_count Dst_host_srv_count Dst_host_same_srv_rate Dst_host_diff_srv_rate Dst_host_same_src_port_rate Dst_host_srv_diff_host_rate Dst_host_serror_rate Dst_host_srv_serror_rate Dst_host_rerror_rate Dst_host_srv_rerror_rate
4. Experiments and Discussion KDD’99 is the most popular and widely used IDS evaluation dataset. As there are few public datasets for this purpose, the majority of IDS models are evaluated on KDD’99. The data regroups a total of approximatively 4GB of data, containing network traffic provided by DARPA [13] in tcpdump format, and processed by lee et al. [6] into five million training instances and 2 million test instances. Data instances can be represented as vectors of 41 features, each labeled as being normal or a specific attack. Data used in experiments are taken from both ‘kddcup.data_10_percent_corrected’ and ‘corrected’ files as training and test sets respectively. There are 494021 instances in training set, with 97278 normal instances, and 22 types of attacks for an overall of 396744. Additional 14 types of attacks are present in the test set. All attacks are regrouped in four categories, namely, Probe, Dos R2L and U2R. As mentioned in section 3, data is preprocessed. Since this research work focuses only in detecting probe and DoS attacks as the first part of the whole system, only normal/DoS and normal/Probe subsets are used, as described in Table.2 (Underlined attacks are novel types of attacks, i.e. appearing only in Test set). Table 2. Data used in the experiments Class
Training Set instances
Test Set instances
Training Set rates
Test Set rates
DoS
Normal: 60553 | Smurf: 15000 |
Normal: 60591 | Smurf: 15000 |
Normal: 69.87 %
Normal: 69.89 %
Neptune: 10000 | Back: 1000 |
Neptune: 10000 | Back: 1000 | Mailbomb: 100 | Apache2: 30 |
Attack: 30.12 %
Attack: 30.21 %
Pod: 80 | Teardrop: 20 | Land: 10
Udpstorm: 2 | Pod: 80 | Teardrop: 12 | Land: 9 Probe
Normal: 60553 | Ipsweep: 316 |
Normal: 60591 | Saint: 36 |
Normal: 96.17 %
Normal: 96.07 %
Portsweep: 360 | nmap: 90 |
Ipsweep: 306 | Portsweep: 354 |
Attack: 3.82 %
Attack: 3.92 %
Satan: 1640
nmap: 84 | Satan: 1644 | mscan: 53
Taha AIT TCHAKOUCHT/ Procedia Computer Science 00 (2018) 000–000 Table 3. Results of feature selection Method
DoS (Selected features)
Probe (Selected features)
IG
5,6,23,3,12,36,24,2,32,37,41,40,29,28,30,27,34,4,33,35 (Top 20)
5,3,6,34,35,12,33,40,20,27,4,30,41,28,23,38,25,37,36,24 (Top 20)
CFS
5, 6, 12, 37
5, 6, 30, 39
C4.5
2, 3, 4, 5, 30, 32
2, 3, 5, 34, 40
NB
2, 3, 5, 23, 32, 33, 36, 39
2, 5, 24, 32
RF
4, 5, 35
3, 5, 35
REPTree
2, 3, 5, 35
5, 35, 41, 3
Table 4. The most important subsets of features Attack Class
Feature subset
DoS
2, 5, 6, 8, 12, 23, 27, 36, 39:
Probe
1, 3, 4, 5, 6, 25, 26, 27, 28, 30, 31, 34, 35, 36, 37, 38, 39, 40, 41:
9 19
4.1. Selecting the most important features Filter methods IG and CFS and RF, C4.5, NB and REPTree classifiers from the Weka [37] collection are used to select the most important features for each method as shown in Table. 3. The feature selectors are used as guidelines to help selecting the final subset for every type of attack. The importance of a feature is evaluated taking into account all the feature selection methods and the contribution of the feature in the improvement of accuracy and efficiency. For example, feature 5 is selected with all methods for both types of attacks. It is then a very important feature. Feature 6 is important as well. With respect to DoS attack, Feature 2 is selected with 3 methods, and is well ranked with IG. Feature 12 and 23 are also important, as they are well ranked. Furthermore, we use the wrapper methods with all 41 features as classifiers for performance evaluation. One feature at a time is removed from the feature subset according the IG raking. Once the classification accuracy decreases (information loss), the removed feature is reincluded and the following iteration is executed. The process will continue until finding the best performances. For example, although feature 2 is selected with two methods w.r.t probe attacks, it is not well ranked with IG, and thus further investigations are done. Evaluation with classification methods shows that feature 2 is irrelevant, as it caused performance drops, and thus will be excluded. Same goes for features 12, 23, 24, and 33. For DoS attacks, feature 35 is selected with 2 methods, but it is not well ranked with IG. When included in the subset, performance decreases considerably. Therefore, feature 35 is marked as very irrelevant. Feature selection have resulted in only 9 features for DoS attack and 19 features for Probe, as shown in Table. 4.
4.2. Probe and DoS detection, Performance analysis Performance evaluation is based on detection rate (DR), False positives rate (FPR), FScore, ROC Area, CPU time, and the capacity to detect novel types of attacks. Usually, the accuracy of classifiers on the original KDD99’is relatively high given that this test set contains skewed data. The accuracy results of classifiers on KDD99’ cannot reflect the ability of the classifier. Several researches [27, 38, 39, 40] achieve good performances, with around 90% in DR and 2% in FPR. However, those results are biased by the performance of DoS attack detection, as authors are assessing their systems with 10% of KDD’99. Works such as [29, 30] evaluate their method using NSL-KDD [41], which is a reformed version of KDD’99 that resolves most of
Taha AIT TCHAKOUCHT/ Procedia Computer Science 00 (2018) 000–000
its inherent problems. Wang et al. [31] resample KDD’99 data in such a way that bias is reduced. We are also motivated by the fact that some methods ([31]) use different feature subsets for different types of attacks detection, Table 5. Accuracy comparison Attack Method type
Probe
DoS
All features
The most important features
DR (%)
FPR (%)
FScore
ROC Area (%)
NB
99.8
3.8
0.682
98.5
C4.5
87.3
0.5
0.873
RF
95.9
0.4
0.931
REPTree
89.3
1.1
0.828
NB
99.5
8.0
0.913
C4.5
99.6
2.6
RF
99.6
0.4
REPTree
99.6
2.6
DR (%)
FPR (%)
FScore
ROC Area (%)
99.8
2.7
0.748
98.9
94.3
87.3
0.5
0.873
94.3
99.8
90.0
0.4
0.896
99.7
94.2
87.5
0.5
0.872
94.3
96.1
99.6
5.1
0.942
98.2
0.969
98.5
99.64
0.3
0.995
99.6
0.993
99.8
99.5
0.4
0.993
99.6
0.969
98.6
99.6
2.5
0.970
0.986
Table 6. Novel attacks detection rate Attack type
# novel attack
Method
All features
The most important features
instances # detected instances
Probe
89
NB
83
DoS
132
C4.5
-
DR 93 % -
# detected instances
DR
83
93%
38
28.78 %
which will make the comparison consistent. Weka collection 3.8 is used as a classification environment [37]. Table.5 summarizes detection results w.r.t to Probe and DoS attacks. Table.6 show accuracy w.r.t to novel attack detection. The experiments are conducted in a PC with 8GB RAM and 2.67GHz i5 intel(R) processor. Table.7 show comparison in term of processing time with all features and with the most important features. Comparison with [31] is shown in Table.8. It is observed in Table. 5 that almost all classification methods achieve good results w.r.t to all performance metrics, with 99.6%, 0.3% and 99.5% in terms of DR, FPR and FScore respectively for DoS attack, and around 90%, 0.5% and 90% for Probe attack. CPU time is optimized as well, using 9 features and 19 features instead of 41 features, as shown in Table.7. An average of 10s can be saved for DoS detection. In terms of novel attacks, we included 132 instances and 89 instances of new types of both DoS and Probe attacks respectively. Results show high probe detection rate with NB. For DoS attack, the best DR is performed with C4.5. Wang et al. [31] achieved good performances in term of DR and FPR for DoS attack, especially when using NB. However, they didn’t include instances of novel types of attacks in the test set, which will impact performance favorably. For Probe detection, our method outperformed Wang et al using NB classifier, while being outperformed in term of FPR using C4.5. It is concluded from this work, that NB represents the best trade-off between accuracy and efficiency for probe attacks. Same goes for C4.5 w.r.t DoS attack detection. This coincides with many other models in related work, as they focus on those two algorithms.
Taha AIT TCHAKOUCHT/ Procedia Computer Science 00 (2018) 000–000 Table 7. Processing Time in seconds Attack type
Method
Probe
NB
All features (in s) Model building
1.40
C4.5
2.90
RF
18.16 0.67
REPTree
DoS
Testing
0.19
The most important features (in s) Model building
Testing
0.17
1.37
0.90
0.83
0.75
1.65
12.77
1.16
0.50
0.28
0.50
NB
0.50
3.30
0.14
1.24
C4.5
10.14
1.00
2.61
0.86
RF
31.08
2.68
0.36
0.80
2.72
1.20
0.70
0.69
REPTree
Table 8. Comparison with Wang et al. [31] Attack type
Method DR (%)
FPR (%)
FScore
DR (%)
FPR (%)
Probe
NB
99.8
2.7
0.748
82.93
3.06
0.687
C4.5
87.3
0.5
0.873
82.88
0.05
0.90
NB
99.6
5.1
0.942
99.88
0
0.999
C4.5
99.64
0.3
0.995
99.87
0.14
0.997
DoS
Our Work
Wang et al. [31] FScore
5. Conclusion and perspectives In this paper, we proposed a lightweight solution for Probe and DoS attacks detection in high speed networks. The model consists of selecting the most important features among the 41 features used in KDD’99, while improving accuracy and efficiency. Six feature selection methods are used, including two filters (IG and CFS) and four wrappers (NB, C4.5, RF and REPTree). The system is assessed using a resampled version of KDD’99. Results show good detection and false positive rates, of around 99.6%, and 0.3% for DoS attacks using C4.5, and 90% and 0.5% for Probe attacks using NB. Processing time is also saved when evaluated using the best selected feature subset. The proposed feature subset is thus recommended for use in high speed networks, with 19 features for probe detection and only 9 features for DoS detection. As promising results are shown, this work motivates us to conduct an experiment for Probe and DoS attacks detection in a real environment in a future work. The system will consist of four main stages: 1) Building model based on this work. 2) Initiating Probe and Distributed DoS attacks in a real network using available tools. 3) Collecting data from the victim host. 4) Applying the built model on the collected data to effectively detect Probe and DoS attacks. The architecture of 2) and 3) stages is shown in Fig.2. Furthermore, we will extend this work by including R2L and U2R attacks as a second part of the whole system.
Taha AIT TCHAKOUCHT/ Procedia Computer Science 00 (2018) 000–000
Fig. 2. Probe and Distributed DoS detection in a real networking environment.
Acknowledgment This study is supported by the Database Engineering and Knowledge Processing (DEKP) laboratory at the Faculty of Sciences and techniques, Tangier (FSTT). References Symantec, (2017), “Internet Security Threat Report, ISTR.” 22: 17. Symantec, (2017), “Internet Security Threat Report, ISTR.” 22: 14 and 16-18. J.P. Anderson. (1980) “Computer security threat monitoring and surveillance.” Technical Report, Fort Washington, Pennsylvania D. E.Denning. (1986) “An intrusion detection model.” IEEE S. Staniford-Chen, B. Tung, P. Porrar, C. Kahn, D. Schnackenberg, R. Feiertag, et al. (1998) “The common intrusion detection frameworkdata Formats.” Internet draft ‘draft-staniford-data-cidf-formats-00.txt’ [6] W. Lee and W. Stolfo. (2000), “A framework for constructing features and models for intrusion detection systems.” ACM Trans. Inf. Syst. Sec. 3 (4): 227–261. [7] K. Ilgun. (1993) “USTAT: A real-time intrusion detection system for Unix.” In: Proceedings of the 1993 IEEE Symposiumon Security and Privacy, Oakland. IEEE Computer Society Press : 16–28. [8] M. Crosbie, B. Dole, T. Ellis, I. Krsul, and E. Spafford. (1996) “IDIOT users guide.” Technical Report TR-96-050, The COAST Project, Dept of Computer Science, Purdue University, West Lafayette [9] H.S. Vaccaro and G.E. Liepins. (1989), Detection of annomolous computer session activity, In: Proceedings of the 1989 IEEE Symposium on Security and Privacy, Oakland, IEEE Computer Society Press, Los Alamitos: 280–289. [10] R. Jagannathan, T.F. Lunt, D. Anderson, C. Dodd, F. Gilham, C. Jalali et al. (1993) “System Design Document: Next-generation intrusiondetection expert system (NIDES).” Technical report, Computer Science Laboratory, SRI International, Menlo Park [11] P.A. Porras and P.G. Neumann. (1997) “Emerald: Event monitoring enabling responses to anomalous live disturbances.” In: Proceedings of the 20th National Information Systems Security Conference: 353–365. [12] KDDcup99 Knowledge discovery in databases DARPA archive. 1999 available on http://www.kdd.ics.uci.edu/databases/kddcup99/task.html (retrieved in September 2017) [13] R. P. Lippmann, D.Fried, I. Graf, J. Haines, K. Kendall, Mcclung, et al. (2000) “Evaluating intrusion detection systems: The 1998 DARPA off-line intrusion detection evaluation.” In: Proceedings of the DARPA Information Survivability Conference and Exposition DISCEX’00, Hilton Head, South Carolina. IEEE Computer Society Press, Los Alamitos, Capp: 12-26. [14] H. Debar, M. Dacier, A. Wespi. (1999) “Towards a taxonomy of intrusion-detection systems.”, Comput. Netw. 31 (9): 805–822. [15] S. Axelsson. (1998) “Research in intrusion detection systems:A survey.”, Technical report, no. 98–17, SE–41296, Göteborg, Sweden [1] [2] [3] [4] [5]
Taha AIT TCHAKOUCHT/ Procedia Computer Science 00 (2018) 000–000
[16] D. Hawkins. (1980) “Identification of Outliers.”, Chapman and Hall, [17] V Chandola, A. Banerjee, and V . Kumar. (2009) “Anomaly detection: A survey.” ACM Comput. Surv. 41 (3): Article 15, 58 pages [18] Ahmed M., Anwar A., Mahmood AN., Shah Z., Maher Mj. (2015) “An investigation of performance analysis of anomaly detection techniques for big data in scada systems.” EAI Endorsed Trans. Ind. Netw. Intell. Sys. 15 (3): 1-16. [19] Ahmed M., Anwar A., Mahmood AN., Hu J. (2016) “A survey of network anomaly detection techniques.” , J. Netw. Comput. Appl. 60 (C): 19-31. [20] K. Surrey,P. Randall and al. “Detecting hackers (Analyzing Network Traffic) by Poisson Model Measure”, http://www2.ensc.sfu.ca/people/grad/pwangf/IPSW_report.pdf [21] M. V. Mahoney and P. K. Chan. (2003) “Learning rules for anomaly detection of hostile network traffic.”, In: Proceedings of the 3rd IEEE Int'l Conf. on Data Mining: 601. [22] Z. Zhang, J. Li, C.N. Manikopoulous, J. Jorgenson, J. Ucles. (2001) “Hide : A Hierarchical network intrusion detection systems using statistical preprocessing and neural network classification.” In: Proceedings of IEEE Workshop on information assurance and security: 85-90. [23] W. Feng, Q. Zhang, G. Hu, J. Huang. (2014) “Mining network data for intrusion detection through combining SVMs with ant colony Networks.” Future Gener. J.Comput. Syst. 37: 127–140. [24] W. Wang, X. Guan, X. Zhang, L.Yang. (2006) “Profiling program behavior for anomaly intrusion detection based on the transition and frequency property of computer audit data.” Comput. Sec. 25 (7): 539–550. [25] W. Wang, X. Zhang, S. Gombault. (2009) “Constructing attribute weights from computer audit data for effective intrusion detection.” J. Syst. Softw. 82 (12): 1974–1981. [26] K. Kyriakopoulos, F. Aparicio-Navarro, D. Parish. (2014) “Manual and automatic assigned thresholds in multi-layer data fusion intrusion detection system for 802.11 attacks.” IET Inf. Sec. 8 (1): 42–50. [27] H. G. Kayacik, A. N. Zincir-Heywood, and M. I. Heywood. (2005) “Selecting features for intrusion detection: a feature relevance analysis on KDD99 intrusion detection datasets.” 3rd annual conference on privacy, security and trust., Citeseer [28] N. Araujo, R. de Oliveira, E.-W. Ferreira, A. Shinoda, and B.Bhargava. (2010) “Identifying important characteristics in the kdd99 intrusion detection dataset by feature selection using a hybrid approach.” In: Proceedings of IEEE 17th International Conference on Telecommunications (ICT): 552–558. [29] O. Y. Al-Jarrah, A. Siddiqui, M. Elsalamouny, M.D. Yoo, S. Muhaidat and K. Kim. (2014) “Machine-Learning-Based Feature Selection Techniques for Large-Scale Network Intrusion Detection.” In: Proceedings of IEEE 34th International Conference on Distributed Computing Systems Workshops (ICDCSW): 177–181. [30] M. M. Rathore, A. Ahmed, A. Paul. (2016) “Real time intrusion detection system for ultra-high-speed big data environments.” J. Supercomput. 72 (9): 3489-3510. [31] W. Wang, Y. He, J. Liu, S. Gombault. (2014) “Constructing important features from massive network traffic for lightweight intrusion detection.” IET Information Security 9 (6): 374-379. [32] R. Quinlan. (1993) “C4.5: Programs for Machine Learning” Morgan Kaufmann publishers, San Mateo, CA [33] G.H John, P.Langley. (1995) “Estimating Continuous Distributions in Bayesian Classifiers.” In the 11th Conference on uncertainty in Artificial Intelligence, San Mateo: 338-345. [34] M. A . Hall. (1998) “Correlation-based feature selection for machine learning.” Phd thesis, Department of Computer Science, University of Waikato, Hamilton, New Zealand http://www.cs.waikato.ac.nz/~mhall/thesis. [35] L. Breiman. (2001) “Random Forest.” J. Machine Learning 45 (1): 5-32. [36] T. Elomaa and M. Kaariainen. (2001) “An Analysis of Reduced Error Pruning.” Journal of Artificial Intelligence Research 15: 163-187. [37] Waikato environment for Knowledge analysis (Weka), available on https://www.cs.waikato.ac.nz/ml/weka [38] B. Pfahringer. (2000) “Winning the KDD99 Classification Cup: Bagged Boosting.” SIGKDD Explorations 1 (2) : 65–66. [39] I. Levin. (2000) “KDD-99 Classifier Learning Contest: LLSoft’s Results Overview.” SIGKDD Explorations 1 (2) :67–75. [40] E. Eskin, A. Arnold, M. Prerau, L. Portnoy, S. Stolfo. (2002) “A geometric framework for unsupervised anomaly detection: Detecting intrusions in unlabeled data.”, D. Barbara and S. Jajodia (eds) Applications of Data Mining in Comput. Sec., Chapter 4 [41] M. Tavallaee, E. Bagheri, W. Lu, Ali-A Ghorbani. (2009) “A detailed Analysis of the KDD CUP 99 Data Set.” In: Proceedings of the 2nd IEEE Symposium of Computational Intelligence for Security and Defense Applications NSL-KDD : available on http://www.unb.ca/research/iscx/dataset/iscx-NSL-KDD-dataset.html