lies like outages, flash crowds, misconfigurations, and attacks. Accurate ...... tion Systemâ, Journal of Computer Security, 7(1), IOS Press, 1999. [15] R. Sekar, A.
Wavelet-based Detection of DoS Attacks Alberto Dainotti, Antonio Pescap´e, and Giorgio Ventre University of Napoli “Federico II” (Italy), {alberto,pescape,giorgio}@unina.it
Abstract— Automated detection of anomalies in network traffic is an important and challenging task. In this work we propose an automated system to detect volume-based anomalies in network traffic caused by Denial of Service (DoS) attacks. The system has a two-stage architecture that combines more traditional approaches (Adaptive Threshold and Cumulative Sum) with a novel one based on the Continuous Wavelet Transform. Thanks to the proposed architecture, we obtain good results in terms of tradeoff between correct detections and false alarms, estimation of anomaly duration, and ability to distinguish between subsequent anomalies. We test our system using a set of publicly available traffic traces to which we superimpose anomalies related to real DoS attacks tools. Extensive test results show how the proposed system accurately detects a wide range of anomalies and how the performance indicators are affected by anomalies characteristics (i.e. amplitude and duration).
I. I NTRODUCTION Efficient operation and management of current large networks depend also on the correct analysis of network anomalies like outages, flash crowds, misconfigurations, and attacks. Accurate detection and classification of anomalies in IP networks is still an open issue due to the intrinsic complex nature of network traffic. Also, isolating anomalous events within traffic is an inherently difficult task. Several anomaly detection systems (ADS) based on very different approaches and techniques have been proposed in literature. Typical performance aspects involve the range of different anomalies that can be detected and the trade-off between the percentages of correct detections (hits) and of false alarms. As regards works in literature, a number of statistical techniques have been employed for anomaly detection: exponential smoothing and Holt-Winters forecasting [1], adaptive thresholding, cumulative sum [2] [3], maximum entropy estimation [4], and principal component analysis [5]. Some of these works analyze the volume of aggregate traffic on a link, others identify different flows carried on several links of an ISP, finally others look at the time series of specific kinds of packets inside aggregate traffic (e.g. SYN packets) restricting their focus to few kinds of attacks. In [6], the use of spectral analysis is proposed to identify legitimate TCP flows, which should exhibit strong periodicity. This is proposed as a complementary approach to existing DoS detection and defense mechanisms that identify attacks. Finally, several works based on the wavelet transform have been proposed in the last years. Time- and scale-localization abilities of the wavelets, indeed, make them ideally suited to detect irregular traffic patterns in traffic traces. In [7] Barford 0 This work has been partially supported by PRIN 2004 Quasar Project, by CONTENT NoE, Onelab and NETQOS EU projects, and by Regione Campania in the framework of the SCI-Trade project.
et al. apply wavelet analysis and synthesis techniques to evaluate the traffic signal filtered only at certain scales, and a thresholding technique is used to detect changes caused by flashcrowds, outages, attacks etc. In [8] the authors show that network problems affecting dominant Round Trip Times can be detected from the analysis of the energy function of the wavelet coefficients at the corresponding scales. In [10] the authors exploit a property of some network misconfigurations that is reflected by the energy function calculated at a specific set of scales; while, in [9], spikes in the coefficient energy function are connected to DoS attacks. In this work we propose an approach to anomaly detection, based on the wavelet transform, which we tested against several types of DoS attacks. Such approach presents several differences with past works. First, we make use of the Continuous Wavelet Transform (CWT), exploiting its interpretation as the cross-correlation function between the input signal and wavelets and its redundancy in terms of available scales and coefficients. All the cited works, instead, are based on the use of the Discrete Wavelet Transform (DWT), which is more oriented to the decomposition of the signal over a finite set of scales, each one with a reduced number of coefficients, in order to make the original signal reconstructable from them. This is typically done in a way that avoids redundancy. Second, our detection approach takes explicitly into account - beside hits and false alarms - accuracy of the estimation of the time interval during which the anomalous event happens and the resolution (in terms of ability to distinguish between subsequent anomalies). In the context of security incidents, these aspects can be crucially important, for example to trace back the source of an attack, or during forensics analysis, etc. Third, we propose a cascade architecture made of two different systems - the first one based on classical ADS techniques for time series, the second one based on the analysis of wavelet coefficients - which allows more flexibility and performance improvements as regards the hits/false alarms trade-off. Finally, as fourth point, we present an experimental analysis of the performance of the system under an extensive set of attack - traffic trace combinations (≈ 15000). The rest of the paper is organized as follows. In Section II we provide some background analytical information that justifies the techniques adopted. In Section III details on the system architecture and algorithms implemented are given. In Sections IV and V respectively, we describe the traffic traces and anomalies that have been used for the experimental tests, and we show and discuss the results obtained in terms of performance. Finally, in Section VI we draw conclusions and foresee future works.
1-4244-0357-X/06/$20.00 ©2006 IEEE
This full text paper was peer reviewed at the direction of IEEE Communications Society subject matter experts for publication in the IEEE GLOBECOM 2006 proceedings.
ROUGH DETECTION
II. A N A NALYTICAL BASIS The Continuous Wavelet Transform (CWT) is defined as: �
fCW T (a, b) =
where:
+∞ −∞
∗ f (t)ψab (t)dt
1 ψab (t) = √ ψ a
�
= �f (t)|ψab (t)� ,
t−b a
dθ(t) dt
and
(1)
Normal Behavior Model Construction
� ,
ψ 2 (t) =
d2 θ(t) , dt2
(3)
and
where:
dθa (t) 1 1 ψ (t/a) = a a dt
(5)
d2 θa (t) 1 2 . ψ (t/a) = a2 a dt2
(6)
ψa1 (t) = ψa2 (t) =
2 2 fCW T (a, t) = f ∗ψa (t) , (4)
Substituting in 4, we obtain:
� � dθa d 1 fCW (a, t) = f ∗ a (t) = a (f ∗ θa ) (t) T dt dt
(7)
Detection-F
Rough Detection Signal
Network Data
Detection Signal
CWT Coefficients
CWT Computing Threshold
Signal Analysis
(2)
the corresponding CWTs are: 1 1 fCW T (a, t) = f ∗ψa (t)
Normal Behavior Model
Input Signal
f (.) is the signal under analysis, ψ(.) is a function of finite energy whose integral over R is 0, called mother wavelet, and a and b are the scaling and translation factors respectively. Each (a, b) pair furnishes a wavelet coefficient, which can also be seen as the cross-correlation at lag b between f (t) and the mother wavelet function dilated to scaling factor a. An important difference between the CWT and the DWT is that the former calculates such correlation for each lag at every possible scale, whereas the DWT calculates a number of coefficients that decreases with the scaling factor. The scale of the coefficients global maximum, is where the input signal is most similar to the mother wavelet. This function is chosen to be oscillating but with a fast decay from the center to its sides, in order to have good scale (frequency) and time localization properties. This makes the CWT a good tool for analyzing transient signals as network traffic time series. When the CWT is implemented as a numeric algorithm, b can assume a number of values equal to the number of samples N of the input signal and the scaling factor a is expressed by a = 2(−j+m/M ) where j is the octave, m is the voice index (0 < m < M ), and M is the number of voices per octave. The number of octaves is given by J = [log2 N ] − 1 where the operator [·] returns the nearest integer of its argument. In the context of the study of wavelets and image processing, it has been proved that the local maxima of a wavelet transform can detect the location of irregular structures in the input signal [11]. Let us consider a smoothing function θ(t), that is the impulsive response of a low-pass filter, such that θ(t) = O(1/(1 + t2 )) and whose integral is not zero (e.g. the gaussian function). Given θa (t) = (1/a)θ(t/a), let f (t) be a real square-summable (over R) function. The edges of f (t) at scale a can be defined as the points of rapid local changes of f (t) filtered by θa (t). Given two mother wavelets defined as: ψ 1 (t) =
Detection-R
FINE DETECTION
Signal Statistics
Threshold Calculation
Library of the Anomalies
Fig. 1.
Anomaly Detection System: Proposed Architecture.
� � 2 d2 2 2 d θa fCW (a, t) = f ∗ a (t) = a2 2 (f ∗ θa ) (t) T 2 dt dt
(8)
1 2 Thus, fCW T (a, t) and fCW T (a, t) are proportional to the firstorder and second-order f (t) derivative respectively, filtered by θa (t). Such properties are obviously maintained by derivatives of greater order. It follows that, for a fixed scale a, 1 the local extrema of fCW T (a, t) along t correspond to the 2 zero-crossings of fCW T (a, t) and to the inflection points of f ∗θa (t). Thus, using the derivative of a smoothing function as a mother wavelet (e.g. derivatives of the gaussian function), the zero-crossings or the local extrema of the wavelet transform applied to a signal indicate the locations of its sharp variation points and singularities. The CWT coefficient redundancy, allows to identify these points at every scale with the same time-resolution of the input signal.
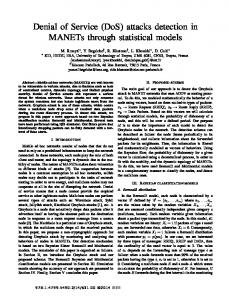
III. A RCHITECTURE In Fig. 1 a block diagram representing the two-stage architecture of the proposed ADS is shown. The ADS takes as input a time series of samples representing the packet rate and outputs an ON-OFF signal reporting the presence of an anomaly for each sample. The first stage, which we called Rough Detection, can be implemented using statistical anomaly detection techniques previously presented in literature and it is just responsible to detect any suspicious change in the traffic trend and to report an alarm to the second stage. Its output is equal to 0 or 1 for each input sample. Here we impose a high sensitivity aiming at catching as much anomalies as possible, whereas the second stage, which we called Fine Detection, is designed to reduce the number of false alarms. For each detected anomaly, this stage also estimates the time interval during which it is present. A. Rough Detection As for the Rough Detection module, we adopted the two techniques proposed in [2] to detect SYN flooding attacks (an adaptive threshold algorithm and the CUSUM algorithm) and we applied them to generic traffic traces. A similar implementation of the CUSUM algorithm has also been proposed in [3] to detect different DoS attacks. The adaptive threshold (AT) algorithm generates an alarm when the value of a sample is greater than a threshold that adaptively changes with the traffic trend. Let xn be the number of packets during the n-th time interval and let µ ¯n−1 be the
1-4244-0357-X/06/$20.00 ©2006 IEEE
This full text paper was peer reviewed at the direction of IEEE Communications Society subject matter experts for publication in the IEEE GLOBECOM 2006 proceedings.
mean rate estimated from measurements prior to n, an alarm at time n is signaled if: n �
1[xi ≥(α+1)µ¯n−1 ] ≥ k
(9)
i=n−k+1
where α determines the threshold sensitivity, and 1[x≥y] is equal to 1 if x ≥ y, to 0 otherwise. The average value µ ¯n is calculated using the Exponentially Weighted Moving Average (EWMA) on the previous estimates: µ ¯n = β µ ¯n−1 + (1 − β) xn
(10)
where β is the EWMA factor. The configurable parameters of the algorithm are: α, β, and k. The CUSUM algorithm is based on the change-point detection theory, and uses the log-likelihood ratio: Sn = p
(y )
n �
Fig. 2.
si
•
•
(11)
i=1
where si = ln pθθ1 (yii ) and {yi } are random variables. The 0 θ0 and θ1 hypotheses represent the statistical distributions prior and after a change respectively. The log-likelihood ratio guarantees a negative drift before a change and a positive drift after the change. Therefore, let mn = min1≤j≤n Sj , an alarm is signaled when gn = Sn − mn ≥ h, where h represents the threshold. After some calculations [2], an expression of gn based on the mean and variance of θ0 and θ1 can be derived. However {yi } are assumed as independent Gaussian variables. Because this is generally not true for network traffic, algorithms to remove trends and time correlations should be applied to the input signal. A common and simpler approach is to subtract to the considered time series its EWMA. We therefore apply the CUSUM algorithm to x ˜n = xn − µ ¯n−1 where xn is the number of packets in the n-th time interval and µ ¯n is an estimate of the mean rate at time n (calculated using the same EWMA as in the adaptive threshold algorithm). Taking into account that the mean value of x ˜n prior to a change is 0, and approximating the mean traffic rate after the change with α¯ µn , gn can be expressed as � α¯ µn−1 � α¯ µn−1 ��+ gn = gn−1 + + x − µ ¯ − n n−1 σ2 2
(12)
The algorithm configurable parameters are: α, β, and h. B. Fine Detection The CWT computing block (Fig. 1) computes the continuous wavelet transform of the whole input signal. We used the Wavelab [12] set of routines under the Matlab environment. The block output is a matrix W of M rows and N columns, where N is the number of samples of the input trace. Each row reports the wavelet coefficient at a different scale. The number of available scales M is given by the number of octaves, J = [log2 N ] − 1 times the number of voices per octave. The CWT function implemented under Wavelab allowed us to work with 12 voices per octave. This matrix is fed as an input to the Detection-F block, which receives as inputs also a threshold level (that will be explained in the following) and the Rough Detection Signal. For each alert reported in the Rough Detection Signal, the Detection-F block operates as follows: • in the column of W that corresponds to the instant of the alert, the maximum value is found. The row index j1 of
•
•
Threshold Calculation Block.
this value represents a first estimate of the scale at which the anomaly is present. looking at all the coefficients at the scale j1 , the zerocrossings (starting from the left and right of the maximum value) are determined. Their distance represents a first estimation of the anomaly interval. a sub-matrix of W , obtained by considering only the columns related to this interval, is used for a new search. In all the elements of this sub-matrix, a new maximum coefficient is found. The index j2 of its row represents the final estimated scale. an anomaly is found if the maximum coefficient results greater than the threshold level. Otherwise the rough detection alarm is ignored and no other operations need to be performed. the final estimation of the anomaly interval is made by looking at the coefficients at the scale j2 . Again, the interval boundaries are identified by searching for the zero-crossings at the left and right of the maximum value.
Basically, starting from the alert of the rough detection stage, we look for the scale at which the coefficients reach the maximum variation. The use of the CWT guarantees that we have a coefficient for each input sample at every scale - differently from the DWT, where typically the number of coefficients decreases as the scale grows. This way, if an anomaly is recognized, we can identify with good precision the zero-crossing points of the wavelet coefficients at the scale where the anomaly is present. The choice of the threshold level for the wavelet coefficients (Threshold Calculation block) is based on the mean and standard deviation of the traffic trace, computed in the Signal Analysis block, and on the Library of Anomalies, which is a collection of signals representing some traffic anomalies (see Section IV-B). Inside the Threshold Calculation block (Fig. 2), in the sub-block named Library Scaling, all the anomaly signals are scaled to a maximum peak value of pmax . This value is given by the standard deviation of the input trace multiplied by a factor, for which we have chosen three possible values corresponding to different ranges of the mean / standard deviation ratio of the input trace. This is because we want to make the threshold calculation adaptive with respect to the trace characteristics. After that all the anomalies have been scaled, for each anomaly k in the library the CWT of the scaled anomaly signal k is computed, and the maximum mk among all the coefficients is found. Finally, the threshold is obtained as min(mk ), that is the smallest of the maximum coefficients of each anomaly.
1-4244-0357-X/06/$20.00 ©2006 IEEE
This full text paper was peer reviewed at the direction of IEEE Communications Society subject matter experts for publication in the IEEE GLOBECOM 2006 proceedings.
TABLE I T RAFFIC T RACES .
IV. T RAFFIC T RACES AND A NOMALIES To study and develop our ADS, we made several experiments under a broad range of situations. Our approach was to generate traffic signals superimposing anomaly profiles to real traffic traces in which no anomalies were present. This choice is partly due to the scarce availability of traffic traces containing classified anomalies along with all the necessary details. For example, the lack of information on the exact beginning and end of each anomaly would not allow us to evaluate the temporal precision of the detection system. On the other hand, being able to generate different traces containing anomalies allowed us to dispose of much more test cases than those that were practically possible to obtain by capturing real traffic traces with real anomalies. In the following subsections we give some details on the used data. A. Traces We considered real traffic traces that were known not to contain any anomalies, obtaining a large and heterogeneous set of traces. In Table I the data sets we used are summarized. The first three groups of traces in Table I were derived from the DARPA/MIT Lincoln Laboratory off-line intrusion detection evaluation data set [13], which has been widely used for testing intrusion detection systems and has been referred in many papers (e.g. [14] [15]). We used only traces from the weeks in which no attacks were present. The dataset marked in Table I as UCLA refers to packet traces collected during August 2001 at the border router of Computer Science Department, University of California Los Angeles [16]. They have been collected in the context of the D-WARD project [17]. Finally, the UNINA data set refers to traffic traces we captured by passively monitoring ingoing traffic at the WAN access router at University of Napoli “Federico II”. We make the time series representing the sampled packet rate publicly available at [18]. Table I contains details about the data sets, as the number of traces for each group and the sampling period Ts used to calculate the packet rate time series. Also, indicative values of mean and standard deviation (std) for the traces of the same set are shown. All traces are composed of 3600 samples. B. Anomalies Anomalies in network traffic can be of different nature and can be originated by different kinds of events. It is possible to distinguish among network performance problems and failures (temporary or permanent problems on nodes or links), non malicious but unordinary events (e.g. flashcrowds), and malicious events (e.g. DoS attacks). These events tend to determine an abrupt change in the time series representing the traffic rate. In this work, several kinds of anomaly profiles related to DoS attacks have been synthetically generated. We assigned labels to each anomaly we used (see Table II). Some anomaly profiles were obtained by generating traffic with real DDoS attack tools, TFN2K [19] and Stacheldraht [20]. We launched such tools with several different options and we captured the traffic that was generated by them. The anomaly profiles obtained were stored and labeled depending on the
Data Set Darpa 1 Darpa 2 Darpa 3 UCLA UNINA
Year 1999 1999 1999 2001 2004
Ts 2s 5s 5s 2s 2s
# Traces 5 5 5 4 3
Mean 80 pkt 20 pkt 12 pkt 20 pkt 8 10E3 pkt
Std 90 pkt 40 pkt 30 pkt 15 pkt 1.3 10E3 pkt
adopted attacking technique. Another group of anomalies have been obtained by synthetically generating the corresponding time series with Matlab, according to known profiles that have been considered in [21]. We considered ‘Constant Rate’, ‘Increasing Rate’, and ‘Decreasing Rate’ anomalies. V. E XPERIMENTAL R ESULTS The experimental results shown have been obtained by performing a large set of automated tests. The results have been summarized and the following performance metrics have been of test hits × 100; calculated: (i) the Hit Rate, HR = number number tests number of f alse alarms (ii) the False Alarms Ratio, F AR = total number of alarms × 100; (iii) the estimation errors in the identification of the beginning and the end of the anomaly; (iv) the number of fragments when a single anomaly is recognized as several ones. Our scripts generated traces containing anomalies with various combinations of parameters and ran the ADS on each of them. In order to test the ADS under more complicated situations (i.e. obfuscating the anomalies in the traces), when a trace and an anomaly profile are selected, the amplitude and the duration of the signal representing the anomaly are modified. Then the signal is superimposed to the traffic trace at a randomly selected point - at 1/4, 1/2, or 3/4 of the trace - and the detection system is executed. For a specific trace, the amplitude of an anomaly was scaled in order to make its maximum peak proportional to the root mean square of the original traffic trace. The choice of the proportionality factor varies from 0.5 to 2.00 with a step of 0.25. Anomaly durations range from 50 to 300 samples with a step of 50. Sampling and interpolation of the anomaly profiles were performed for expansion and shortening respectively. Thus we performed a number of tests given by the product (traces × anomalies × intensities × durations). With 22 traces and 16 anomalies, we performed about 15000 tests, each time we tested a system configuration (i.e. with CUSUM, with AT, etc.). A. Choice of the Mother Wavelet In our tests we computed the CWT using the Morlet mother wavelet, which has the following expression: 2 1 ψ(t) = √ e−jw0 t e−t /2 . 2π
(13)
The Morlet mother wavelet is one of the most used in signal processing because of its good properties as symmetry and a narrow and rapidly decreasing central lobe. Usually w0 = 5 is chosen, to have the second lobe half of the first one. Such properties translate into good time and scale localization capabilities. We found a strong similarity with even-order gaussian derivatives, which have a strong analytical basis for their use in the field of singularity detection (see Section II). We verified such similarities also by calculating
1-4244-0357-X/06/$20.00 ©2006 IEEE
This full text paper was peer reviewed at the direction of IEEE Communications Society subject matter experts for publication in the IEEE GLOBECOM 2006 proceedings.
TABLE II T ESTED A NOMALIES . Tools Anomalies
Matlab Constant rate, Increasing rate, Decreasing rate
TFN2K ICMP Ping flood, TCP SYN flood, UDP flood, Mix flood, Targa3 flood
the cross-correlation function between the coefficients of the wavelet transform of tested anomalies using even-order gaussian derivatives and Morlet mother wavelets. We found a crosscorrelation value of 0.96 between coefficients obtained with the 24-th order gaussian derivative and the Morlet mother wavelet with w0 = 5. Experimental tests with even-order derivatives of the gaussian function of smaller orders - e.g. the Mexican Hat mother wavelet which is the 2-nd order derivative - showed a remarkable loss of accuracy in finding the start and the end of each anomaly. As regards odd-order derivatives, we did not take them into account because singularity detection using odd-order derivatives of a smoothing function is based on the identification of local maxima (see Section II). A search for local maxima is more difficult to implement into an algorithm rather than a search for zero-crossing points, which is the case for even-order derivatives.
Stacheldraht TCP ACK flood, TCP ACK NUL flood, TCP random header attach, Mstream (TCP DUP ACK), DOS flood, mass ICMP bombing, IP header attack, SYN flood, UDP food
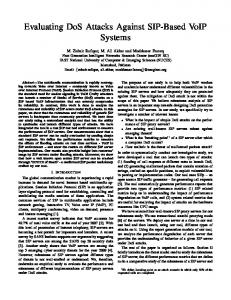
can be observed that the increasing rate and decreasing rate anomalies (red and green lines respectively) are more difficult to be detected, compared to the other anomalies. However, it is interesting to note that the curves related to all the anomaly profiles follow approximately the same trends. The relative amplitude has more influence on HR and F AR than the anomaly duration. But, when the anomaly amplitude is tuned for peak values greater than the RMS of the trace (relative amplitude ≥ 1) HR does not increase anymore. A similar behavior happens for F AR in the AT case, while as for the CUSUM implementation F AR tends to slowly decrease even after the relative amplitude is higher than 1. As regards the anomaly duration, while F AR always decreases when the anomaly lasts longer, HR inverts this trend after a certain duration. This behavior is accentuated in the CUSUM case. Rough Detection: Adaptive Threshold
70
Rough Detection: Adaptive Threshold 60
60
FP
B. Hit Rate (HR) and False Alarm Ratio (FAR)
FAR
50 50 40
20 0.5
1
Relative Amplitude
1.5
20 50
2
80
80
TH
100
HR
100
60
40
1
1.5 Relative Amplitude Rough Detection: Cumulative SUM
70
150
Duration
200
250
300
250
300
60
20 50
2
100
150 Duration 200 Rough Detection: Cumulative SUM
60
60
50
FAR
50
FAR
100
40
20 0.5
40
40 30
30 20 20 10 0.5
1
Relative Amplitude
1.5
10 50
2
100
150
Duration
200
250
300
100
150
Duration
200
250
300
100
100
90 80
80
HR
HR
In Table III we show the system performance, in terms of HR and F AR, when the rough detection block is implemented with AT and CUSUM algorithms. We report results obtained separately for each of the 5 trace data sets, and in the last row, we show global results obtained working with all the traces. The columns labeled F D(AT ) and F D(CU SU M ) report performance indicators derived from the output of the fine detection stage when the rough detection stage are AT and CU SU M respectively. Instead, the performance results related just to the output of the rough detection stages are reported in columns labeled with RD(AT ) and RD(CU SU M ). This is to show how we tuned the rough detection stage with a very high sensitivity in order to catch as much anomalies as possible at the expense of a high F AR. Indeed, passing from the rough detection output to the fine detection output, while HR remains almost the same, F AR decreases dramatically. This happens for all the sets of traces, and for both AT and CUSUM, and it represents one of the most important features of the proposed ADS. In order to sketch a comparison between the proposed twostage ADS and AT or CUSUM used as standalone algorithms, in the columns labeled as AT-sa and CUSUM-sa we show how they perform in terms of HR when tuned with approximately the same F AR of the proposed ADS. We see that, in the case of AT, the introduction of the second stage, improves HR of about 10% for 3 out of 5 trace sets, as for AT, while for CUSUM the improvements range from about 12%, for the fifth trace set, to almost 50%, for the first one. In Fig. 3 we show how HR and F AR are influenced by the relative amplitude (left figures) and the duration (right) of the anomalies. Top and bottom figures refer to the system with AT and CUSUM rough detection respectively. We evaluated performance separately for each anomaly profile. It
40
30
30
60
70 60
40
50
20 0.5
1
Relative Amplitude
1.5
40 50
2
Fig. 3. HR and FAR as functions of attacks’ relative amplitude and duration.
C. Accuracy in the detection of the anomaly time interval The diagrams in Fig. 4 show the percentage of correct estimates of the start and the end time of the anomalies, when the width of the confidence interval (expressed in number of samples) increases. We consider the estimate to be correct when the start/end time falls into the confidence interval. For Rough Detection: Adaptive Threshold
Rough Detection: Cumulative SUM
100
100
90
90
80
80
70
70
60
60
50
50
40
40
30
30
20
20
10 0 0
Start accuracy End accuracy 10
20
30
40
50 60 Confidence
70
80
90
Fig. 4.
100
Start Accuracy End accuracy
10 0 0
10
20
30
40
50 60 Confidence
70
80
90
100
ADS accuracy.
a confidence interval of 30 samples, 70% of the start and end times are correctly identified. In general, we note a slightly better performance in the estimation of the start time compared to the end time. We also evaluated when the system did not
1-4244-0357-X/06/$20.00 ©2006 IEEE
This full text paper was peer reviewed at the direction of IEEE Communications Society subject matter experts for publication in the IEEE GLOBECOM 2006 proceedings.
TABLE III HR/FAR T RADE -O FF RESULTS . Dataset
RD(AT) HR FAR 95.9 72.8 93.7 68.2 92.1 81.1 90.9 17.7 99.6 69.7 94.2 70.9
Darpa 1 Darpa 2 Darpa 3 UCLA UNINA All
FD(AT) HR FAR 89.5 34.9 84.9 38.0 83.8 50.1 86.0 14.0 98.0 7.4 87.7 34.1
RD(CUSUM) HR FAR 84.0 68.6 85.7 83.6 88.3 77.9 91.5 89.6 99.6 77.3 83.7 86.2
correctly estimate the anomaly duration because the anomaly was recognized as several different anomalous events. This occurred rarely: for only 4.62% of the detections with the AT rough detection block, and 1.62% with CUSUM. D. Resolution With the term resolution we mean the minimum distance at which two anomalous events can be placed for the system to detect them as distinct anomalies. We made several tests by superimposing two anomalies to the same trace. We varied their distance, duration, and amplitude. The system seems to perform very well, detecting two separate anomalies even at small distances. In Fig. 5 we show two examples. In the left diagrams, we used a trace from the DARPA 2 set, to which we superimposed an UDP flood and an IP header attack at the distance of 5 samples. The rough detection block here is implemented using the AT algorithm. In the right diagrams a constant rate anomaly and a stacheldracht TCP ACK flood at the distance of 1 sample have been correctly detected (with a CUSUM rough detection) when they were superimposed to a trace from the DARPA 1 set. In both cases it can be seen how the system correctly identifies two distinct anomalies, whereas the rough detection stage fails to make this distinction: in the first test, the AT block reports several alerts all at the same distance, while in the second test the CUSUM block reports a series of alerts from the start of the first attack to the end of the second one (plus a false alert nearby). These results, Input Signal
2000 0 0
500
1
1000
1500 2000 2500 samples Rough Detection − Adaptive Threshold
3000
3500
500
1000
1
0 0
500
1000
500
1000
1500
500
1000
1500
1
1500
2000 samples Fine Detection
2500
1500 2000 samples
2500
3000
3500
1500 2000 2500 samples Rough Detection − Cumulative SUM
0 0 1
3000
3500
2000 samples Fine Detection
2500
3000
3500
2500
3000
3500
0.5
0.5 0 0
1000
0.5
0.5 0 0
Input Signal
2000 packets
packets
4000
500
1000
Fig. 5.
3000
3500
0 0
2000 samples
ADS resolution: two examples.
along with those related to fragmentation and accuracy in the previous sub-section, show that the proposed ADS is reliable also in the identification of anomalies intervals. Such feature is even not considered by most of the other ADSs, which just report an alarm for each input sample that is recognized as anomalous (e.g. see the fragmented alerts from the AT rough detection stage in left Fig. 5). VI. C ONCLUSION AND ISSUES FOR FUTURE RESEARCH This paper proposed a cascade architecture based on the Continuous Wavelet Transform to detect volume-based network anomalies caused by DoS attacks. We showed how the proposed schema is able to improve the trade-off existing between HR and F AR and at the same time to provide
FD(CUSUM) HR FAR 82.4 1.56 84.8 38.9 84.7 28.1 86.2 39.8 98.0 12.1 86.3 27.2
AT-sa HR FAR 79.0 35.3 74.1 36.4 71.6 51.0 85.7 15.8 86.4 7.0 79.4 33.1
CUSUM-sa HR FAR 35.1 6.7 49.4 32.6 62.7 25.0 56.3 44.4 78.6 13.1 49.2 33.9
insights on anomaly duration (defining starting and ending time intervals) and on the identification of subsequent close anomalies. Our current work is focused on testing other algorithms in the rough detection stage as well as to test the system behavior with other anomaly classes. Finally, we are currently working on a new block performing anomaly classification. The whole chain will be also adopted to build an ADS working in a real time (or on line) fashion, taking into account the performance impact due to the use of the CWT algorithm instead of the DWT. R EFERENCES [1] J. Brutlag, “Aberrant behavior detection in time series for network monitoring, USENIX Fourteenth System Administration Conference LISA XIV, Dec. 2000. [2] V. A. Siris, F. Papagalou, “Application of Anomaly Detection Algorithms for Detecting SYN Flooding Attacks”, IEEE GLOBECOM 2004, Nov. 2004, pp. 2050-2054. [3] R. B. Blazek, H. Kim, B. Rozovskii, A. Tartakovsky, “A Novel Approach to Detection of Denial-of-Service Attacks via Adaptive Sequential and Batch-Sequential Change-Point Detection Methods”, IEEE Workshop Information Assurance and Security, 2001, pp. 220-226. [4] Y. Gu, A. McCallum, D. Towsley, “Detecting Anomalies in Network Traffic Using Maximum Entropy Estimation”, IMC 2005. [5] A. Lakhina, M. Crovella, C. Diot, “Diagnosing Network-Wide Traffic Anomalies”, ACM SIGCOMM 2004. [6] C.-M. Cheng, H.T.Kung, K.-S. Tan, “Use of spectral analysis in defense against DoS attacks”, IEEE GLOBECOM 2002, pp. 2143-2148 [7] P. Barford, J. Kline, D. Plonka, A. Ron, “A signal analysis of network traffic anomalies”,ACM SIGCOMM InternetMeasurement Workshop 2002. [8] P. Huang, A. Feldmann, W. Willinger, “A non-intrusive, wavelet-based approach to detecting network performance problems”, ACM SIGCOMM Internet Measurement Workshop, Nov. 2001. [9] L. Li, G. Lee, “DDos attack detection and wavelets”, IEEE ICCCN’03, Oct. 2003, pp. 421-427. [10] A. Magnaghi, T. Hamada, T. Katsuyama, “A Wavelet-Based Framework for Proactive Detection of Network Misconfigurations”, ACM SIGCOMM’04 Workshops, 2004. [11] S. Mallat, W. L. Hwang, “Singularity Detection and Processing with Wavelets”, IEEE Trans. on information theory, vol. 38, No.2, Mar. 1992. [12] http://www-stat.stanford.edu/ wavelab/ . [13] R. Lippmann, et al., “The 1999 DARPA Off-Line Intrusion Detection Evaluation”, Computer Networks 34(4) 579-595, 2000. Data is available at http://www.ll.mit.edu/IST/ideval/ [14] G. Vigna, R. Kemmerer, “NetSTAT: A Network-based Intrusion Detection System”, Journal of Computer Security, 7(1), IOS Press, 1999. [15] R. Sekar, A. Gupta, J. Frullo, T. Shanbhag, S. Zhou, A. Tiwari and H. Yang, “Specification Based Anomaly Detection: A New Approach for Detecting Network Intrusions”, ACM CCS, 2002. [16] http://lever.cs.ucla.edu/ddos/traces [17] J. Mirkovic, G. Prier, P. Reiher, “Attacking DDoS at the Source”, ICNP 2002, pp. 312-321, Nov. 2002. [18] http://www.grid.unina.it/Traffic [19] CERT Coordination Center. Denial-of-service tools - Advisory CA1999-17, http://www.cert.org/advisories/CA-1999-17.html , Dec. 1999. [20] CERT Coordination Center. DoS Developments - Advisory CA-2000-01, http://www.cert.org/advisories/CA-2000-01.html , Jan. 2000. [21] J. Yuan, K. Mills, “Monitoring the macroscopic effect of DDos flooding attacks”, IEEE Trans. on dependable and secure computing, vol.2, N.4, 2005.
1-4244-0357-X/06/$20.00 ©2006 IEEE
This full text paper was peer reviewed at the direction of IEEE Communications Society subject matter experts for publication in the IEEE GLOBECOM 2006 proceedings.