LETTERS PUBLISHED ONLINE: 6 MARCH 2011 | DOI: 10.1038/NPHYS1940
Probing collective multi-electron dynamics in xenon with high-harmonic spectroscopy A. D. Shiner1† , B. E. Schmidt1,2† , C. Trallero-Herrero1,3 , H. J. Wörner1,4 , S. Patchkovskii1 , P. B. Corkum1 , J-C. Kieffer2 , F. Légaré2 and D. M. Villeneuve1 * High-harmonic spectroscopy provides a unique insight into the electronic structure of atoms and molecules1–5 . Although attosecond science holds the promise of accessing the timescale of electron–electron interactions, until now, their signature has not been seen in high-harmonic spectroscopy. We have recorded high-harmonic spectra of atoms to beyond 160 eV, using a new, almost ideal laser source with a wavelength of 1.8 µm and a pulse duration of less than two optical cycles. We show that we can relate these spectra to differential photoionization cross-sections measured with synchrotron sources. In addition, we show that the highharmonic spectra contain features due to collective multielectron effects involving inner-shell electrons, in particular the giant resonance in xenon. We develop a new theoretical model based on the strong-field approximation and show that it is in agreement with the experimental observations. Measuring and understanding the electronic structure and correlated dynamics of matter on its natural timescale represents the main thrust of ultrafast laser science. Electron correlations affect essential properties of complex systems ranging from configuration interactions in molecules to cooperative phenomena in solids, such as superconductivity. Our knowledge of the electronic structure of matter originates from several decades of research on photoionization and photoelectron spectroscopy6–8 , mainly driven by the development of synchrotron-based sources. Recent advances in strong-field physics have opened an alternative approach to probing both the electronic structure1,9 and the dynamics10–12 of molecules using table-top laser sources. These new methods rely on the recollision of an electron, removed from the molecule by a strong laser field, with its parent ion13 , as illustrated in Fig. 1a. The electronic structure of the molecule is encoded in the emitted high-harmonic spectrum through the amplitude and phase of the photorecombination matrix elements4,11,14,15 . We use high-harmonic spectroscopy to investigate a new class of collective electronic dynamics—induced and probed by the recombining electron. The kinetic energy of the returning electron is usually much larger than the difference between electronic energy levels of the parent ion. Consequently, inelastic scattering followed by recombination is energetically possible, as illustrated in Fig. 1b. Using the xenon atom as an example, we demonstrate that such processes indeed occur and that they can locally enhance the efficiency of high-harmonic generation (HHG) by more than one order of magnitude. We show that such a seemingly complex pathway contributes significantly to the phase-matched process. This observation uncovers a new
unexpected facet of high-harmonic spectroscopy—it provides access to electron correlations that are otherwise very difficult to observe. Our results indicate that electron–electron excitations may be ubiquitous in high-harmonic spectroscopy experiments. Highharmonic spectroscopy gives access to multi-electron dynamics through their spectral signature, much as in photoionization studies, but it offers the additional potential of attosecond temporal resolution. Until recently, HHG was interpreted within the single-active-electron approximation. HHG experiments in preformed, transition-metal plasmas16 demonstrated significant enhancements of a single harmonic order. These enhancements were recently interpreted17 to be caused by Fano autoionizing resonances and 3d–3p transitions, underlining the importance of multi-electron effects in HHG. We used a new laser source that is almost ideal for spectroscopic studies18 , having a wavelength of 1.8 µm and a duration of less than 2 optical cycles. The source is described in the Methods section and in the Supplementary Information. With its long wavelength, it creates a recollision electron whose energy can exceed 100 eV, even for low-ionization-potential systems such as small organic molecules. HHG spectra were recorded for the noble gases, argon, krypton and xenon, using a thin phase-matched gas jet described in the Methods section. Results are shown in Figs 2 and 3 and demonstrate the smooth spectra that are possible with this laser source. The limit of 160 eV is imposed by the spectrometer. We now show how the photoionization cross-section (PICS) can be measured with these spectra. It has been shown that the three-step model for HHG (ref. 13) can be approximately factorized into three terms1,2,15,19 corresponding to ionization (I ), electron propagation (W ), and recombination (σ r ). Although the range of validity for this expression has not been fully explored, it is sufficiently accurate to allow us to compare the HHG spectra of Xe and Kr, both of which involve ionization from p orbitals. S(E ) = I (F ,ω)W (E)σ r (E) = W(E)σ r (E) Here S(E ) is the HHG power spectrum, E = E + Ip is the emitted photon energy, E is the electron kinetic energy, ω is the laser frequency, F is the laser field and Ip is the ionization potential. The photorecombination cross-section σ r is related to the photoionization cross-section σ i through the principle of detailed balance2,20 . To demonstrate that our laser source produces an almost flat recolliding electron wave packet, we plot the differential PICS for krypton21 together with our measured HHG spectrum in Fig. 2. The good agreement tells us that W(E) is virtually flat. The development
1 Joint
Attosecond Science Laboratory, National Research Council of Canada and University of Ottawa, 100 Sussex Drive, Ottawa, Ontario K1A 0R6, Canada, 2 Institut National de la Recherche Scientifique, 1650 boul. Lionel-Boulet, Varennes, Québec J3X 1S2, Canada, 3 J. R. Macdonald Lab, Physics Department, Kansas State University, Manhattan, Kansas 66506, USA, 4 Labortorium für Physikalische Chemie, ETH Zürich, Wolfgang-Pauli-Strasse 10, 8093 Zürich, Switzerland. † These authors contributed equally to this work. *e-mail:
[email protected]. 464
NATURE PHYSICS | VOL 7 | JUNE 2011 | www.nature.com/naturephysics © 2011 Macmillan Publishers Limited. All rights reserved.
NATURE PHYSICS DOI: 10.1038/NPHYS1940
LETTERS
a
b 88
0 ¬12
5p subshell
¬68
4d subshell
Legend:
Ionization
5pz
32
Energy (eV)
Energy (eV)
88
4dzz
0 ¬12
5p subshell
¬68
4d subshell
Inelastic scattering
Recombination
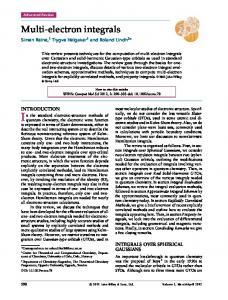
Figure 1 | Steps for harmonic generation. a, In the usual three-step model, an electron is tunnel ionized from the valance shell, accelerates in the continuum and then recombines to the state from which it came. b, With inelastic scattering, the returning electron can promote a lower-lying electron into the valance band and then recombine to the vacancy in the lower-lying state. In both cases, a 100 eV photon is emitted by recombination to a 5p vacancy (a) or a 4d vacancy (b).
Raw HHG Spectra Published PICS
106
PICS (arb. units)
of this new source allows us to see many features through HHG that were previously not accessible with traditional laser sources. For example in the krypton spectrum (Fig. 2), we observe a Cooper minimum at 80 eV. Cooper minima have been reported in HHG experiments for argon4,22 , but not for krypton. With our new 1.8 µm source, we are able to report the first observation of the Cooper minimum in krypton in HHG. We now use the measured Kr HHG spectrum and the PICS from the literature to accurately determine the recolliding electron wave-packet spectrum W(E) by setting W(E) = SKr (E )/σKr i (E ), using a similar approach to that used in ref. 1. We then divide the measured HHG spectrum for xenon with this term, to extract the photoionization cross-section for xenon: σXe i = SXe (E )/W(E). As this procedure divides one spectrum by another, experimental details such as grating reflectivity and detector response cancel out. In addition, the proportionality factor2,20 relating σ i and σ r approximately cancels out when the ionization potentials are similar. The experimentally derived σXe i is plotted as the blue line in Fig. 3, together with the PICS from synchrotron experiments. The excellent agreement shows that the HHG spectrum contains detailed information about the electronic structure of atoms, imprinted through the photorecombination cross-section. It is remarkable that the intense laser field can be neglected. We now study the xenon results, shown in Fig. 3. The most striking feature is the pronounced peak around 100 eV. This peak has been extensively studied in the context of photoionization, and led to the development of a theory that included electron–electron correlations during photoionization23 . The 100 eV peak is interpreted as being due to the influence of 4d electrons, which have a large photoionization cross-section in this region owing to a shape resonance. Energy-resolved measurements24 have shown that the photoionization cross-section of the 5p shell is strongly enhanced around 100 eV through electron–electron interactions with the 4d subshell. The first step in HHG is tunnel ionization from the most weakly bound electrons, the 5p electrons in the case of xenon. The probability of tunnel ionizing a 4d electron whose binding energy is 68 eV is vanishingly small (10−51 ). So how is it that the photorecombination process in HHG can manifest the influence of the 4d shell? Figure 1b illustrates the Coulomb interaction between the returning continuum electron and a bound 4d electron. An exchange of energy takes place, resulting in the promotion of a 4d electron to fill the 5p hole. This causes the continuum electron to lose 56 eV (the difference between binding energies of the two subshells), and hence to have the correct kinetic energy to experience the quasibound continuum state that enhances the 4d cross-section. The decelerated electron then recombines to the 4d
105
104
20
40
60
80 100 Photon energy (eV)
120
140
160
Figure 2 | Results for krypton. Top, raw HHG spectrum from krypton at 1.8 × 10¹⁴ W cm−2 in an image taken from a CCD (charge-coupled device) camera. The horizontal scale has been stretched to be linear in frequency rather than wavelength. Bottom, experimental spectrum (blue) from integrating the CCD image vertically, including the Jacobian of the transformation from wavelength to frequency; published photoionization cross-section21 (PICS; green).
hole and emits a photon whose energy is the same as that of the direct channel, owing to energy conservation. The smooth green curve in Fig. 3 is derived from a complete multi-electron calculation25 that includes contributions from all subshells. We now describe a simplified model in which electron correlations are included in the recombination step of HHG. In the Supplementary Information, we show how this is included in a strong-field approximation model. Briefly, we include the Coulomb interaction between the returning electron that was ionized from the 5p state and the other electrons of the ion. For clarity, we include only the 4d state, although by summation other states can be easily included. Following ref. 23, the recombination dipole moment can be written as D() = d5p + d4d Ac , where the single electron dipole moments are d5p = hφ5p |r|χ5p i and d4d = hφ4d |r|χ4d i. The Coulomb interaction term is Ac = hφ5p χ4d |(|r1 − r2 |−1 )|φ4d χ5p i/1Ip . Here the bound states (labelled by φ) are wavefunctions in a Hartree–Fock
NATURE PHYSICS | VOL 7 | JUNE 2011 | www.nature.com/naturephysics
© 2011 Macmillan Publishers Limited. All rights reserved.
465
NATURE PHYSICS DOI: 10.1038/NPHYS1940
LETTERS a Transition moments squared
PICS (arb. units)
Experimental PICS RRPA calculation
100
10¬1
Coulomb ¬>
40
60
80 100 Photon energy (eV)
120
140
Figure 3 | Results for xenon. Top, the raw HHG spectrum from xenon at an intensity of 1.9 × 10¹⁴ W cm−2 . The horizontal scale has been stretched to be linear in frequency rather than wavelength. Bottom, experimental HHG spectrum divided by the krypton wave packet (blue) and the relativistic random-phase approximation (RRPA) calculation of the xenon photoionization cross-section (PICS) from ref. 25 (green). The red and green symbols are PICS measurements from refs 31 and 24 respectively, each weighted using the anisotropy parameter calculated in ref. 25.
100 0.2 4d 0
466
50 100 Photon energy (eV)
0 150
b 101
100 Experiment Model
10¬1
model, and electron exchange is included through antisymmetrized products. The continuum states correlated with the hole states are labelled as χ5p and χ4d . Each continuum state contains a full range of angular momentum components, only two of which contribute to the recombination. Figure 4a shows the individual dipole moments for the 5p and 4d channels, as well as the Coulomb interaction term Ac . It can be seen that the direct 5p channel alone cannot explain the observed peak at 100 eV. The total calculated cross-section including the electron–electron correlations is shown in Fig. 4b, along with the experimentally recorded normalized HHG spectrum from Fig. 3. Our simplified model considers recombination with the 4d (m = 0) level, (Ac = 0 for the other m levels) and neglects further interactions between the other 4d electrons. The model in ref. 25, green curve in Fig. 3, includes second-order interactions between the other 4d electrons. We also note that the same calculation done for krypton 4p/3d or for xenon 5p/5s does not predict a giant resonance peak, in agreement with the experiment. It is the coincidence of two factors that gives rise to the 100 eV peak in xenon—the strong electron–electron coupling just above the threshold of the 4d level, and the strong transition dipole of the 4d state at the same energy. Although we have successfully predicted the observed HHG spectrum in xenon, it is not obvious that the 4d channel will be phase matched, a necessity for HHG. Does the electron–electron interaction cause a loss of the coherence that is necessary for HHG phase matching? The generalized HHG model described in the Supplementary Information shows that coherence is indeed maintained. In the strong-field approximation, the ion evolves with a phase given by its total energy; the continuum electron gains a phase given by the classical action. After the collisional excitation, both the ion and the continuum electron exchange energy, but the total energy remains the same, meaning that the excitation time does not affect the emission phase, and coherence is maintained. The observation of the 100 eV peak in xenon in the HHG spectrum is striking in several ways. It reinforces the observation that the HHG spectrum is largely determined by the photoionization cross-section2,4,15 . In fact it has been predicted15 that the xenon giant resonance will appear in HHG spectra. The agreement between our measured spectrum and the previously measured photoionization cross-section is remarkable because it represents a clear observation of electron–electron correlations and excitation of the ion in HHG. Indeed, it is quite likely that collisional excitation followed by recombination to an inner-shell orbital is a general phenomenon in HHG whose experimental evidence has been directly observed
0.6 0.4
160
Cross-section
20
5p
200
0
10¬2
0.8
Coulomb coupling
101
300
0
50 100 Photon energy (eV)
150
Figure 4 | Prediction of our theoretical model. a, The single-electron transition dipole moments (squared) for recombination to 5p holes and 4d holes in xenon. The electron–electron Coulomb interaction |Ac |2 responsible for excitation of a 4d electron to the 5p hole is shown as a red curve (plotted against the right axis). b, The red dashed curve shows the predicted photorecombination cross-section, including both the direct 5p channel and the indirect electron–electron interaction through the 4d channel. The blue solid curve shows the experimentally obtained HHG cross-section of xenon from Fig. 3.
for the first time as a result of the newly developed sub-two-cycle infrared laser source. Our results have three important implications. First, the high selectivity of tunnel ionization shows how photorecombination dynamics of the valence-shell orbital of molecules can be isolated and measured. In the photoionization of atoms, individual orbitals are easily identified through the kinetic energy of the photoelectrons. In molecules, however, photoelectron spectra of different orbitals overlap, inhibiting the selective observation of the PICSs over large energy intervals. Second, they show that the single-active-electron approximation can break down for HHG. Electron correlations beyond exchange interactions have been neglected until recently. We show that Coulomb correlations need to be included even at the qualitative level. Such interactions are ubiquitous in complex atoms and molecules. The giant resonance that we observe in high-harmonic spectroscopy for the first time is indeed known from photoionization experiments to persist from atoms into molecules and into the solid state. Third, owing to the factorization of HHG to explicitly include the field-free photorecombination cross-section, they demonstrate how the large body of spectroscopic data accumulated over the past decades will be useful in choosing optimal media for attosecond pulse generation in the quest to extend the photon energy26,27 . Our results also suggest new opportunities for future experiments. We have shown that HHG provides access to electronic structure information of inner shells through an unexpected mechanism. This opens the possibility to study electronic structure and correlations in inner shells of molecular systems where very little is known. Giant resonances as we have observed in xenon also offer interesting systems for attosecond time-resolved studies. Converting the 30 eV measured width of the resonance into a lifetime, we
NATURE PHYSICS | VOL 7 | JUNE 2011 | www.nature.com/naturephysics © 2011 Macmillan Publishers Limited. All rights reserved.
NATURE PHYSICS DOI: 10.1038/NPHYS1940
LETTERS
obtain 23 attoseconds. Using an attosecond pulse centred at 100 eV to photoionize xenon from the 4d shell into the region of the giant resonance and subsequently streaking the photoelectron, should reveal the signature of the multi-electron dynamics. Such a measurement carried out in neon has recently revealed an unexpected temporal shift between the emission from different subshells28 . Alternatively, the timescale of the electron correlations might be directly observable in high-harmonic experiments, if the electron is accelerated by the laser field after interaction, resulting in a phase shift of the emission; such an effect could be probed by varying the laser intensity or wavelength.
Methods Source. Harmonic generation was driven by a 1.8 µm, 11 fs laser pulse. Details of this source have been published elsewhere18 and are also given in the Supplementary Information. In short, the 800 nm radiation from a Ti:sapphire laser (Thales, 100 Hz, 30 fs) was downshifted by an optical parametric amplifier (Light Conversion TOPAS-HE) producing approximately 1 mJ of radiation at 1.8 µm with a nominal pulse duration of 52 fs. This pulse was directed into a hollow-core fibre filled with 1.2 bar of argon gas, where its spectrum was broadened through self-phase modulation and self-steepening, and then compressed through anomalous dispersion in 2.0 mm of fused silica and a transmissive polarizer. This resulted in a nearly transform-limited 11 fs pulse, which is only 1.9 optical cycles in duration. The spatial quality of the beam is excellent, owing to the spatial filtering properties of the fibre. The laser pulse is collimated after the hollow-core fibre, then focused into the vacuum chamber with a mirror with a focal length of 250 mm. The focus was positioned before the gas jet, and optimized to favour phase-matched short trajectories and to suppress long trajectory harmonics. Phase matching. Our intention is to apply high-harmonic spectroscopy to various rare-gas atoms. Unlike gas-source geometries that are designed to optimize production of extreme-ultraviolet emission, we employ a thin gas jet target in which collective effects are minimized. The gas sample is emitted from a pulsed valve with a 500 µm orifice and a backing pressure of 3 bar. We have previously verified that the extreme-ultraviolet emission scales quadratically with gas pressure29 , demonstrating that the target is operating in the phase-matched regime. The resulting high-harmonic spectrum is therefore a reflection of the single-atom response. Spectrometer. Harmonic radiation produced in the gas jet passed into an extreme-ultraviolet spectrometer where the beam was spectrally dispersed by a 1,200 line mm−1 spherical holographic grating (Shimadzu 30-002). This type of grating has significantly lower second-order dispersion when compared with typical mechanically ruled gratings. The dispersed spectrum was imaged with a microchannel plate backed by a phosphor screen. The resulting spectrum was recorded with a high-dynamic-range digital camera. Spectrometer calibration. The spectrometer was calibrated by putting oxygen into the pulsed jet and using several millijoules of circularly polarized 800 nm radiation while increasing the microchannel plate gain. We then recorded the plasma emission lines, using a method similar to that in ref. 30. By assigning the observed recombination lines to oxygen transitions known from the literature, we achieve a calibration of the spectrometer. Details of this procedure are given in the Supplementary Information. Intensity calibration. The absolute laser intensity in the jet was calibrated by measuring the ion yield as a function of laser pulse energy. The intensity dependence of the mode-integrated ion yield for the target gas was then calculated using the Yudin–Ivanov non-adiabatic ionization model parameterized by the measured laser wavelength and pulse duration. The proportionality factor relating the pulse energy measured outside the chamber to the peak intensity in the interaction volume was found by fitting the measured ion yield to the intensity-dependent yield calculated from the model. We have published this procedure as part of our previous work29 and show details in the Supplementary Information.
Received 9 November 2010; accepted 31 January 2011; published online 6 March 2011; corrected online 7 March 2011
References 1. Itatani, J. et al. Tomographic imaging of molecular orbitals. Nature 432, 867–871 (2004). 2. Le, A-T., Lucchese, R. R., Tonzani, S., Morishita, T. & Lin, C. D. Quantitative rescattering theory for high-order harmonic generation from molecules. Phys. Rev. A 80, 013401 (2009). 3. Mairesse, Y., Levesque, J., Dudovich, N., Corkum, P. B. & Villeneuve, D. M. High harmonic generation from aligned molecules—amplitude and polarization. J. Mod. Optics 55, 2591–2602 (2008). 4. Wörner, H. J., Niikura, H., Bertrand, J. B., Corkum, P. B. & Villeneuve, D. M. Observation of electronic structure minima in high-harmonic generation. Phys. Rev. Lett. 102, 103901 (2009).
5. Haessler, S. et al. Attosecond imaging of molecular electronic wavepackets. Nature Phys. 6, 200–206 (2010). 6. Berkowitz, J. Photoabsorption, Photoionization and Photoelectron Spectroscopy (Academic, 1979). 7. Kimura, K., Katsumata, S., Achiba, Y., Yamazaki, T. & Iwata, S. Handbook of HeI Photoelectron Spectra (Japan Scientific Societies Press, 1981). 8. Becker, U. & Shirley, D. A. (eds) VUV and Soft X-Ray Photoionization (Plenum Press, 1996). 9. Torres, R. et al. Probing orbital structure of polyatomic molecules by high-order harmonic generation. Phys. Rev. Lett. 98, 203007 (2007). 10. Baker, S. et al. Probing proton dynamics in molecules on an attosecond timescale. Science 312, 424–427 (2006). 11. Smirnova, O. et al. High harmonic interferometry of multi-electron dynamics in molecules. Nature 460, 972–977 (2009). 12. Wörner, H. J., Bertrand, J. B., Kartashov, D. V., Corkum, P. B. & Villeneuve, D. M. Following a chemical reaction using high-harmonic spectroscopy. Nature 466, 604–607 (2010). 13. Corkum, P. B. Plasma perspective on strong field multiphoton ionization. Phys. Rev. Lett. 71, 1994–1997 (1993). 14. Le, A-T., Lucchese, R. R., Lee, M. T. & Lin, C. D. Probing molecular frame photoionization via laser generated high-order harmonics from aligned molecules. Phys. Rev. Lett. 102, 203001 (2009). 15. Frolov, M. V. et al. Analytic description of the high-energy plateau in harmonic generation by atoms: Can the harmonic power increase with increasing laser wavelengths? Phys. Rev. Lett. 102, 243901 (2009). 16. Ganeev, R. A. High-order harmonic generation in a laser plasma: A review of recent achievements. J. Phys. B 40, R213–R253 (2007). 17. Frolov, M. V., Manakov, N. L. & Starace, A. F. Potential barrier effects in high-order harmonic generation by transition-metal ions. Phys. Rev. A 82, 023424 (2010). 18. Schmidt, B. E. et al. Compression of 1.8 µm laser pulses to sub two optical cycles with bulk material. Appl. Phys. Lett. 96, 121109 (2010). 19. Frolov, M. V., Manakov, N. L., Sarantseva, T. S. & Starace, A. F. Analytic formulae for high harmonic generation. J. Phys. B 42, 035601 (2009). 20. Landau, L. D. & Lifshitz, E. M. Quantum Mechanics Non-Relativistic Theory 3 edn (Course of Theoretical Physics, vol. 3, Pergamon Press, 1977). 21. Huang, K. N., Johnson, W. R. & Cheng, K. T. Theoretical photoionization parameters for the noble gases argon, krypton, and xenon. At. Nucl. Data Tables 26, 33–45 (1981). 22. Minemoto, S. et al. Retrieving photorecombination cross sections of atoms from high-order harmonic spectra. Phys. Rev. A 78, 061402(R) (2008). 23. Amusia, M. Y. & Connerade, J-P. The theory of collective motion probed by light. Rep. Prog. Phys. 63, 41–70 (2000). 24. Becker, U. et al. Subshell photoionization of Xe between 40 and 1,000 eV. Phys. Rev. A 39, 3902–3911 (1989). 25. Kutzner, M., Radojević, V. & Kelly, H. P. Extended photoionization calculations for xenon. Phys. Rev. A 40, 5052–5057 (1989). 26. Popmintchev, T. et al. Phase matching of high harmonic generation in the soft and hard X-ray regions of the spectrum. Proc. Natl Acad. Sci. USA 106, 10516–10521 (2009). 27. Vozzi, C. et al. High-order harmonics generated by 1.5 µm parametric source. J. Mod. Opt. 57, 1008–1013 (2010). 28. Schultze, M. et al. Delay in photoemission. Science 328, 1658–1662 (2010). 29. Shiner, A. D. et al. Wavelength scaling of high harmonic generation efficiency. Phys. Rev. Lett. 103, 073902 (2009). 30. Farrell, J. P., McFarland, B. K., Bucksbaum, P. H. & Gühr, M. Calibration of a high harmonic spectrometer by laser induced plasma emission. Opt. Express 17, 15134–15144 (2009). 31. Fahlman, A., Krause, M. O., Carlson, T. A. & Svensson, A. Xe 5s, 5p correlation satellites in the region of strong interchannel interactions, 28–75 eV. Phys. Rev. A 30, 812–819 (1984).
Acknowledgements The authors thank laser technicians F. Poitras and A. Laramée for their dedicated work on the laser system, and gratefully acknowledge financial support from NSERC, AFOSR, CIPI and FQRNT. We thank U. Becker, M. Spanner and T. Starace for illuminating discussions.
Author contributions A.D.S. and B.E.S. contributed equally to this work. B.E.S., F.L. and J-C.K. developed the laser source. A.D.S., B.E.S. and C.T.H. carried out the experiments. H.J.W. interpreted the xenon results. A.D.S. analysed the data. S.P. and D.M.V. provided the theoretical parts. A.D.S., H.J.W., P.B.C. and D.M.V. wrote the manuscript.
Additional information The authors declare no competing financial interests. Supplementary information accompanies this paper on www.nature.com/naturephysics. Reprints and permissions information is available online at http://npg.nature.com/reprintsandpermissions. Correspondence and requests for materials should be addressed to D.M.V.
NATURE PHYSICS | VOL 7 | JUNE 2011 | www.nature.com/naturephysics
© 2011 Macmillan Publishers Limited. All rights reserved.
467
SUPPLEMENTARY INFORMATION doi: 10.1038/nPHYS1940
Probing collective multi-electron dynamics in xenon with high harmonic spectroscopy (Supplementary Online Material) A. D. Shiner1∗ , B. E. Schmidt2∗ , C. Trallero-Herrero1,3 , H. J. W¨orner1,4 , S. Patchkovskii1 , P. B. Corkum1 , J.-C. Kieffer2 , F. L´egar´e2 and D. M. Villeneuve1 Joint Attosecond Science Laboratory, National Research Council of Canada and University of Ottawa, 100 Sussex Drive, Ottawa ON K1A 0R6 Canada 2 Institut National de la Recherche Scientifique, 1650 boul. Lionel-Boulet, Varennes, Qu´ebec J3X 1S2, Canada 3 J. R. Macdonald Lab, Physics Department, Kansas State University, Manhattan, KS 66506 USA 4 Labortorium f¨ur physikalische Chemie, ETH Z¨urich, Wolfgang-Pauli-Strasse 10, 8093 Z¨urich, Switzerland *These authors contributed equally to this work. 1
1
Calculating HHG Spectra
The Photo-Recombination Cross Section (PRCS) is related to the more common Photoionization Cross Section (PICS) by the relation 1, 2 d2 σ i d2 σ r = ω 2 dΩn dΩk c2 k 2 dΩn dΩk
(1)
Here, Ωk is the solid angle of the photoelectron direction, Ωn is the solid angle of the photon polarization direction, and k is the final momentum of the photoelectron. In photoionization experiments, the outgoing electron direction is measured relative to the photon polarization direction as angle θ, and its anisotropy is characterized by the asymmetry parameter β, where −1 < β < 2. In HHG from atoms, the xuv is polarized parallel to the recolliding electron direction, so n ˆ kˆ and θ = 0. The angle resolved photoionization cross section is related to the angle integrated cross section and the asymmetry parameter as follows 3 : σi dσ i = 1 + β i P2 (cos (θ)) dΩ 4π
(2)
Where P2 (cos(θ)) ≡ 32 cos2 (θ) − 12 . To compare our measured HHG spectra with previously published photoionization cross sections σ i (E) and asymmetry parameters β i (E), we use eq. (2) to determine the θ = 0 contribution, then use eq. (1) to convert to a PRCS.
1 nature physics | www.nature.com/naturephysics
1
supplementary information
doi: 10.1038/nphys1940
Kr Published Photoionization Cross Section Data: State resolved photoionization cross sections for Kr were calculated by Huang et al. 4 who used the Relativistic Random Phase Approximation (RRPA). After ionization of the Kr ground state the ion is left in a superposition of the 2 Pj states with j = { 12 , 32 }. The PI cross section for each state along the direction θ = 0 was calculated using Eq. (2) and the contributions from the two states were combined with the statistical weighting (2j+1). The resulting PI cross section is shown in Fig. 1. Huang et al. did not provide data for photon energies above ∼140 eV. In this region the PICS was extrapolated by fitting a second order polynomial to the published PICS from 100 eV to 140 eV. The results are shown as the red curve in Fig. 1. 1
10
PI Cross Section (arb. u.)
Published Cross section Extrapolated
0
10
−1
10
−2
10
20
40
60
80
100
120
140
160
Photon Energy (eV)
Figure 1: Photoionization cross section for Kr along the (θ = 0) direction combining the contributions from channels that leave the ion in the 2 P1/2 and 2 P3/2 states. Data was taken from 4 and extrapolated to 160 eV. 2
Strong Field Approximation
The Strong Field Approximation (SFA) is commonly used to calculate HHG emission 5 . The usual expression for the time-dependent dipole d(t) in a one-electron system is t d1 (t) = −i dk dt1 ψ0 |r|k + A(t)e−iS E(t1 ) · k + A(t1 )|r|ψ0 (3) 0
Here k is the canonical momentum, A is the vector potential of the laser field, and t S = t1 dt (k + A(t ))2 /2 + Ip (t − t1 ) is the classical action, with Ip being the ionization poten2
2
nature physics | www.nature.com/naturephysics
doi: 10.1038/nphys1940
supplementary information
tial. Following Patchkovskii et al.6 , we rewrite this expression in the multi-electron form to explicitly include the ion and the various phase terms. t iEN t −iE + (t−t1 ) −iSv (t,t1 ) + d2 (t) = −i dk dt1 ψN e re e k + A(t), ψ 0 (4) + ˆ −iEN t1 × k + A(t1 ), ψ VL (t1 )e ψN
Here, ψN (1...n) is the n-electron ground state of the neutral atom, EN is the total energy of the neutral, ψ + (1...n − 1) is the n − 1-electron wave function of the ion following ionization, E + is the total energy of the ion, VL = xEL (t1 ) is the interaction Hamiltonian due to the laser field, t and Sv (t, t1 ) = t1 (k + A(t ))2 dt /2 is the Volkov phase of the electron in the continuum. We explicitly show the energy of the neutral system, EN , rather than the more usual ionization potential Ip , because we will soon introduce an excited state of the ion. Now we include the Coulomb interaction between the returning electron and the n − 1 electrons in the ion. In the S-matrix description, this is an additional interaction at time t2 somewhere between ionization time t1 and emission time t. The time-ordering is (0 ≤ t1 ≤ t2 ≤ t). In the case of xenon, the ionic states correspond to the ion with a 5p hole (ψ1+ ) and a 4d hole (ψ2+ ). The expression can easily be extended to additional ionic states. The continuum electron wave functions associated with each ionic state are written as χ1 and χ2 to simplify the expression. Electron n is ionized (without showing the explicit antisymmetrization). t t d3 (t) = dk dt1 dt2 0 t1 iEN t −iSv (t,t2 ) × ψN e re χ2 (t2 ), ψ2+ (5) + n−1 −1 + × χ2 (t2 ), ψ2 Σi=1 |r i − r n | χ1 (t2 ), ψ1 � −1 −iSv (t2 ,t1 ) + ˆ −iEN t1 χ1 (t1 ), ψ1 VL (t1 )e E2+ − E1+ ×e ψN Here the classical action is split into two parts, before and after t2 : 1 t2 Sv = dτ (k + A(τ ))2 + E1+ (t2 − t1 ) 2 t1 1 t dτ K2 + E2+ (t − t2 ), Sv = 2 tc
(6) (7)
where K1 is the kinetic energy of continuum electron 1 before collision and K2 = K1 −(E2+ −E1+ ) is the kinetic energy of continuum electron 2 after collision, which we assume is not affected by 3
nature physics | www.nature.com/naturephysics
3
supplementary information Energy (eV)
doi: 10.1038/nphys1940
t2
88
32 0 5p −12
t
Ω =100 eV Time
t1
4d -68
Figure 2: Time evolution of the continuum electron in HHG. From time zero to t1 the electron waits to be ionized by the laser field. At t1 the electron is field ionized and accelerates in the continuum. At t2 the continuum electron re-encounters the parent ion causing the exchange of the 5p hole with a 4d electron losing 56 eV in the process. At time t the continuum electron fills the 4d hole and a 100 eV photon is emitted.
the laser field during its brief existence. A schematic diagram of this 4-step process is shown in Fig. 2. We calculate the effect of the extra 5p-4d coupling by considering only the recombination part of the three-step model (see main text, eq. 1). The recombination moment D(Ω) is the sum of the direct 5p channel, D5p and the indirect 4d channel, D4d . D 5p (Ω) = φ5p |r|χ5p −1 ˆ D 4d (Ω) = φ4d |r| χ4d χ4d , φ5p |r 1 − r 2 | A χ5p , φ4d (E2+ − E1+ )−1
(8) (9)
Here, Aˆ is the antisymmetrization operator. The continuum wave functions are taken as scattering wave solutions of the ionic potential which are asymptotically matched to hydrogenic Coulomb functions of asymptotic kinetic energy K such that Ω = K +Ip , where Ip is the ionization potential of the corresponding orbital vacancy (5p or 4d). This approach is described in more detail in W¨orner et al. 7 . The single-electron orbital wave functions φ5p and φ4d are taken from a quantum chemistry calculation using GAMESS 8 with small-core relativistic plus polarization correlation consistent triple zeta basis set (cc-pVTZ-PP and Stoll-Dolg effective core potentials) 9 . The 5p and 4d orbitals are taken in the frozen-core approximation, in which the other orbitals are assumed to be unchanged upon ionization. Such orbitals are very close to the corresponding Dyson orbitals, which include rearrangement of the other electrons. For noble gas atoms, this rearrangement is 4
4
nature physics | www.nature.com/naturephysics
doi: 10.1038/nphys1940
supplementary information
very small. In converting from transition dipole moment in the length form to photoionization cross section, as shown in Fig. 4 in the main paper, we use the following expression 3 : 2 2 e 4π 2 dσ 1/2 1/2 Ω (2(Ω − I = )) D + (2(Ω − I )) D (10) 5p 5p 4d 4d 2 dΩsr c m
where I5p and I4d are the ionization potentials for removal of a 5p and a 4d electron, and Ω is the emitted photon energy.
All of the integrals above are in general complex, meaning that the emission from each channel is not necessarily in phase. Nevertheless, the calculation predicts that the interference between channels is generally constructive, in agreement with the experiment. In HHG experiments, phase matching is essential to producing coherent collimated xuv emission. This condition is usually met because the attosecond emission is synchronized to the optical cycle. This condition requires that the atom coherently returns to the initial ground state, otherwise the emission is incoherent. It is less obvious that the channel which includes coupling between 5p and 4d electrons is phase-matched, since the electron-electron interaction could potentially randomize the phase. However the analysis above shows that, as long as the total energy of the system (continuum electron plus ion core) is conserved, the emission phase is deterministic. If the laser field accelerates the continuum electron after the electron-electron interaction and before recombination, an additional phase term will appear. Since the interaction occurs very close to the ion core, and just before recombination, we neglect this effect. This additional phase might be an experimental observable that will give access to the time of the electron-electron interaction on an attosecond time scale. 3
Source
The experimental layout comprising the optical setup for IR few-cycle pulse generation and the high-harmonic chamber is depicted in Fig. 3. The source is based on the frequency conversion from Ti:Sa wavelength of 800 nm to 1.8 µm with commercial OPA technology followed by subsequent pulse compression. The starting point is a Ti:Sa amplifier delivering 40 fs pulses with 6 mJ pulse energy at a repetition rate of 100 Hz. Frequency conversion to the IR spectral range is achieved by utilizing the idler out of a fluorescence seeded high energy OPA (HE TOPAS, Light Conversion). It provides 52 fs pulses with pulse energy of 950 µJ which are focused into the hollow-core fiber (HCF) by a f =1 m lens made of CaF2 . Pulse shortening is realized due to the combined action of nonlinear propagation in the HCF and linear propagation through bulk material in the anomalous dispersion regime 10 . Self-phase modulation (SPM) in the 1 m long fiber is the main driving source for spectral broadening of the initial OPA spectrum shown as shaded gray in Fig. 4a. After the fiber, the pulse duration roughly equals the input duration but its spectrum signif5
nature physics | www.nature.com/naturephysics
5
supplementary information
doi: 10.1038/nphys1940
icantly broadened (black line in Fig. 4a). Collimation of the continuum is carried out with a mirror of 1 m focal length. The broadened power spectrum given by the black line in Fig. 4a is slightly asymmetric towards the blue spectral side as a result of self-steepening 11 . More important for the subsequent compression, however, is that self-steepening also causes the spectral phase to become asymmetric, distinct from pure SPM which bears both, symmetric spectrum and phase. As expected, this symmetric part of the spectral phase is compensated afterwards by the negative group delay dispersion (GDD) introduced by the glass in the anomalous dispersion regime. The distinctiveness of the glass compression scheme, compared to other aproaches12–15 , lies in the cancelation of the spectral phase-asymmetry arising from self-steepening during nonlinear propagation. It is balanced by the positive third order dispersion (TOD) of the glass during linear propagation of the expanded, low intensity, beam. Thus, compression is not limited by the TOD of bulk material which is always positive. The flat spectral phase after compression is shown as red line in Fig. 4a with the corresponding temporal profile given in Fig. 4b. A more detailed discussion and full numerical simulations of the mutually compensating propagation effects can be found in Ref.16 . Several materials contribute to the pulse compression subsequent to the fiber. CaF2 windows (not shown in Fig. 3) on the HCF (1 mm thickness) and at the entrance of the high-harmonic chamber (3 mm thickness) have a minor effect because of very low dispersion. Compression mainly arises from the transmissive polarizer P (nanoparticle polarizer, Thorlabs) and fine tuning is achieved by small tilts of the Fused Silica FS plate (2.0 mm thickness). Intensity control is achieved by rotating the half-wave plate λ/2 in front of the HCF in combination with the polarizer located after the fiber. Pulse characterization is carried out with a home built second harmonic generation - frequency resolved optical gating (SHG-FROG) 17 setup designed for dispersion free few-cycle pulse measurement 10 . In this straight-forward manner 11 fs pulses, corresponding to 1.8 optical cycles at 1.8 µm wavelength (Fig. 4b), with ∼ 300 µJ pulse energy have been delivered to the target chamber. 4
XUV Spectrometer
A schematic diagram of the HHG spectrometer and source chamber is shown in Fig. 3. The laser enters the source chamber through a 3 mm thick CaF2 window and is focused below a thin pulsed gas jet by an f = 25 cm spherical mirror. The jet has a 500 µm aperture and backing pressure of 2-3 atm. It is mounted on a three-axis manipulator for adjustment relative to the laser focus. We estimate the number density under the jet to be 2 · 1017 cm−3 . The focusing optics are chosen such that the jet is much thinner than the Rayleigh range. An ion detector consisting of an electrically biased mesh was located directly below the jet. The resulting harmonics pass from the source to the detector chambers through a differential pumping tube. The harmonic beam enters the spectrometer through a ∼ 140µm slit and is dispersed by a 1200 l/mm spherical holographic grating (Shimadzu 30-002). This type of grating has been shown to have significantly lower second order dispersion compared to equivalent ruled gratings 18, 19 . The dispersed spectrum is imaged 6
6
nature physics | www.nature.com/naturephysics
doi: 10.1038/nphys1940
supplementary information
Figure 3: Experimental setup The IR spectral range is accessed by utilizing the idler of a high energy OPA, pumped at 800 nm. Confined propagation in a hollow-core fiber filled with Ar at atmospheric pressure broadens the spectrum which is subsequently compressed by bulk material (CaF2 vacuum windows, transmissive polarizer (P), 2 mm FS for fine tuning). A half-wave plate (λ/2) in front of the fiber is used to attenuate the beam in combination with the polarizer. High harmonics are generated by focusing this beam (f = 25 cm) into a thin gas jet and their spectral characterization is carried out by imaging the entrance slit onto a multichannel plate (MCP) with a concave grating.
onto a microchannel plate intensifier backed by a phosphor screen (Burle APD 3115 32/25/8 I EDR MgF2 P20). The resulting spectrum was recorded with a high dynamic range digital camera. Calibration In HHG spectroscopy it is common to calibrate the spectrometer by fitting the positions where harmonics are observed to their expected position based on odd multiples of the laser photon energy and the grating equation. This procedure works well for low harmonic orders but can introduce significant errors when a large number of harmonics are produced. The accuracy of calibrations using the observed HHG spectra is very sensitive to our knowledge of the laser wavelength and can be seriously degraded by the ‘blue shift’ 20 which causes the spectrum to shift in energy at high harmonic orders. The wavelength scale of the spectrometer was calibrated by recording oxygen recombination lines and comparing their positions to the wavelengths in the NIST database. To do this we put oxygen into the pulsed jet and focus several millijoules of circularly polarized 800 nm radiation to the same position where we normally focus the 1.8 µm laser when producing harmonics. We then observed the spectrum resulting from photo-recombination of free electrons with oxygen ions in the laser produced plasma. This procedure is similar to the one described by Farrell et al. 21 as well as 22 . The resulting spectrum is shown in Fig. 5 along with the positions of oxygen lines that we expect based on NIST data. 7
nature physics | www.nature.com/naturephysics
7
supplementary information
doi: 10.1038/nphys1940
Figure 4: Pulse characterization (a) spectral broadening (black) after the hollow-core fiber is compared to OPA input bandwidth (shaded gray) which corresponds to a 52 fs pulse. The retrieved flat spectral phase compressed by the bulk material used in the setup is shown as a red curve. (B) Temporal intensity of the compressed 1.8 cycle pulse.
Note that NIST gives the position and relative intensity for oxygen transitions, many of which are very close together. To generate the spectrum shown we assumed that each transition had a secant squared line shape with an amplitude given by the relative amplitudes from NIST. For a given wavelength we then sum the contribution from each transition. This procedure gives a reasonable approximation for the centre wavelength expected for each line in the observed spectrum.
8
8
nature physics | www.nature.com/naturephysics
supplementary information
doi: 10.1038/nphys1940
Measured NIST O−I NIST O−II NIST O−III NIST O−IV
Counts (arb. u.)
4000 3000 2000 1000 0 10
20
30
40
50
60
70
80
90
100
Wavelength (nm)
Figure 5: Image of measured spectrum of oxygen recombination lines (top). The lower panel shows the measured spectrum (blue) along with the absorption spectra of Oxygen-I through IV as tabulated by NIST. Note that the NIST data is largely based on photo-absorption measurements. In our experiment, the spectrum is produced by photo-recombination of electrons in the laser produced plasma. While the centre wavelengths for lines corresponding to the two processes will be nearly identical, their relative strengths are expected to differ.
9
nature physics | www.nature.com/naturephysics
9
supplementary information 5
doi: 10.1038/nphys1940
Intensity Calibration
We use an ion detector consisting of a wire mesh, biased at -500 V, located below the pulse jet to measure the number of ions produced during harmonic generation. In23 we showed that the ion signal is proportional to the number of ions produced in the interaction volume. To calibrate the laser intensity we measure the ion yield Ni as a function of pulse energy and fit this data to the intensity dependent ionization rate from theory. The measured ion yield is plotted as symbols in Fig. 6. The solid curves were calculated using the Yudin-Ivanov nonadiabatic ionization model 24 integrated over a Gaussian spatial intensity distribution. This model includes both quasi-static tunneling as well as the wavelength-dependent multiphoton contribution to the ionization probability. We minimize the square error between theory and experiment by scaling the horizontal (intensity) axis of the measured data and the vertical (ionization yield) axis of the theoretical curve. This fitting procedure determines the absolute intensity of the laser in the interaction volume for a given pulse energy 25 .
60
Ion Signal (arb. u.)
50 40 30 20 10 0 13
14
10
10
Intensity W/cm2
Figure 6: Points are the experimentally measured ion signal from Xenon when ionized by our 11fs 1.8µm pulse for a range of pulse energies. The solid lines show the Yudin-Ivanov ionization rate integrated over the focal volume.
10
10
nature physics | www.nature.com/naturephysics
doi: 10.1038/nphys1940
6
supplementary information
Phase Matching
We have tacitly assumed that the experimentally observed HHG spectrum reflects the single-atom response of xenon. HHG is a collective process in which the emission from each atom is added coherently. Phase mismatch occurs if the driving laser field has a different phase velocity than the xuv emission. If phase mismatch is present, the observed HHG spectrum contains both the single-atom response and a contribution from the collective response. Phase mismatch has been extensively studied 26 . Phase mismatch can become more significant with longer-wavelength driving lasers for two reasons. First, the lower frequency laser is more affected by the medium, particularly by the free electrons following ionization of the atoms. Second, the xuv frequencies are much higher, commensurate with the higher cutoff energy, and require less of a temporal shift of the driving field in order to become out of phase. Nevertheless, it has been shown that xuv emission from capillary gas targets can extend beyond 200 eV in a phase-matched process 26 . In the present experiment, we use an extremely thin gas jet target to minimize the possibility of phase mismatch. Additionally, the very short laser pulse reduces the effect of phase mismatch due to plasma formation. To test the supposition that the HHG spectrum corresponds to the single atom response, we performed several tests. We note that the HHG spectra of Kr and Xe are consistent with the PICS of the single atoms; Xe would be expected to be more sensitive to plasma since its ionization potential is lower than that of Kr, yet both spectra match the PICS. In Fig. 7 we show how the spectrum of xenon changes as the laser intensity is changed. As the intensity increases, the cutoff frequency also increases and goes through the giant resonance at 100 eV. Beyond this point, the spectrum only increases in total power, but does not change shape. If phase mismatch from plasma dispersion were present, we would expect that the higher intensity spectrum would change due to the presence of more plasma. We also tested the scaling of the HHG emission as a function of the gas pressure in the jet. If the process is perfectly phase matched, the HHG emission should scale quadratically with gas pressure. We previously demonstrated this behavior in the same gas jet 23 . We show the scaling of the HHG emission in the present experiment in Fig. 8. The scaling power is seen to be somewhat greater than quadratic; if phase mismatch were an issue, the scaling power would be less than 2. There was some indication that, at the lowest gas pressure, the giant resonance peak in xenon was at 120 eV rather than 100 eV; however the signal was barely above the noise level at this pressure. As the pressure was increased, the peak was clearly centered at 100 eV.
11
nature physics | www.nature.com/naturephysics
11
supplementary information
doi: 10.1038/nphys1940
5.39e+13 7.1e+13 8.91e+13 1.08e+14 1.27e+14 1.45e+14 1.62e+14 1.77e+14 1.9e+14 2.01e+14 2.09e+14 2.14e+14
6
Harmonic Yield
10
5
10
4
10
3
10
20
40
60
80
100
120
140
160
Photon Energy (eV)
Figure 7: HHG yield in xenon for a range of laser intensities (see legend in W/cm2 ). The pulsed jet backing pressure was ∼ 3 bar.
6
16
6
x 10
x 10
14
2.5
12 2
Yield
Yield
10 8 6
1.5 1
4 0.5
2 0
0
1000
2000
0
3000
Pressure (mbar)
0
1000
2000
3000
Pressure (mbar)
Figure 8: Integrated harmonic yield with respect to pressure. For each pressure the harmonics were integrated over a specified range of photon energies and the result was fit to the function a0 P b where P is pressure. The results are (left) 20eV-100eV, b = 2.46, (right) 90eV-110eV, b = 2.21.
12
12
nature physics | www.nature.com/naturephysics
supplementary information
doi: 10.1038/nphys1940
7
Argon PICS
As described in the main text of this paper we analyze the xenon HHG spectra by normalizing it to the returning electron wavepacket W(E) measured for a krypton reference atom. The xenon PICS is then determined by dividing its measured HHG spectrum by the W(E) from krypton. We used a similar procedure in an effort to extract the argon PICS from HHG measurements. Comparing our results, Fig. 9, to the published cross section, we find that the expected deep Cooper minimum in argon is barely present in our unfiltered measurements. The reason for this is that a fraction of the harmonics from the high energy side of the spectrum, at around 100 eV, are diffracted in to the second order by the spectrometer grating and overlap with the 50 eV harmonics which are observed in first order. As described in Sec. 4, the Shimadzu holographic grating was chosen for these experiments because it has significantly lower second order dispersion compared to similar ruled gratings, but interference from second order diffraction is still present in our measured spectrum. To show that this is the case, we placed a 200 nm thick aluminum filter in the xuv beam before the grating and recorded HHG spectra in both argon and krypton. Aluminum transmits xuv photons in the range of 17 eV to 73 eV and strongly attenuates higher energy harmonics.
0
No Filter Filtered
Harmonic Yield (arb. u.)
Harmonic Yield (arb. u.)
0
10
−1
10
−2
10
−3
10
20
No Filter Filtered
10
−1
10
−2
10
−3
40
60
80
100
120
140
160
Photon Energy (eV)
10
20
40
60
80
100
120
140
160
Photon Energy (eV)
Figure 9: HHG spectra for krypton (left) and argon (right) measured with and without an aluminum filter, green and blue curves respectively. The filtered and unfiltered spectra were scaled vertically in these plots. As expected, the filter blocks harmonics with energies > 74eV . The shape of the krypton spectrum in the transmission band of the filter is largely unaffected by the filter because the real krypton spectrum is much brighter at 50 eV compared to 100 eV, so any second order contribution to the measured spectrum is negligible. The situation is different for argon, where bright ∼100 eV 13
nature physics | www.nature.com/naturephysics
13
supplementary information
doi: 10.1038/nphys1940
harmonics fill in the Cooper minimum at 54 eV. Placing the filter in the beam blocks the ∼100 eV harmonics and a much deeper Cooper minimum is observed as shown in Fig. 9 (green). 1. Landau, L. D. & Lifshitz, E. M. Quantum Mechanics Non-Relativistic Theory, vol. 3 of Course of Theoretical Physics (Pergamon Press Ltd., New York, 1977), 3 edn. 2. Le, A.-T., Lucchese, R. R., Tonzani, S., Morishita, T. & Lin, C. D. Quantitative rescattering theory for high-order harmonic generation from molecules. Phys. Rev. A 80, 013401 (2009). 3. Starace, A. F. Theory of atomic photoionization. In Mehlhorn, W. (ed.) Handbuch Der Physik Vol. XXXI, 1–121 (Springer, Berlin, 1982). 4. Huang, K. N., Johnson, W. R. & Cheng, K. T. Theoretical photoionization parameters for the noble gases argon, krypton, and xenon. Atomic and Nuclear Data Tables 26, 33 – 45 (1981). 5. Lewenstein, M., Balcou, P., Ivanov, M. Y., L’huillier, A. & Corkum, P. B. Theory of highharmonic generation by low-frequency laser fields. Phys. Rev. A 49, 2117–2132 (1994). 6. Patchkovskii, S., Zhao, Z., Brabec, T. & Villeneuve, D. M. High harmonic generation and molecular orbital tomography in multielectron systems. J. Chem. Phys. 126, 114306 (2007). 7. W¨orner, H. J., Niikura, H., Bertrand, J. B., Corkum, P. B. & Villeneuve, D. M. Observation of electronic structure minima in high-harmonic generation. Physical Review Letters 102, 103901 (2009). 8. Schmidt, M. W. et al. General atomic and molecular electronic structure system. J. Comput. Chem. 14, 1347 (1993). 9. Peterson, K., Figgen, D., Goll, E., Stoll, H. & Dolg, M. Systematically convergent basis sets with relativistic pseudopotentials. ii. small-core pseudopotentials and correlation consistent basis sets for the post-d group 16 - 18 elements. J. Chem. Phys. 119, 11113 (2003). 10. Schmidt, B. E. et al. Compression of 1.8 µm laser pulses to sub two optical cycles with bulk material. Appl. Phys. Lett. 96, 121109 (2010). 11. Yang, G. & Shen, Y. R. Spectral broadening of ultrashort pulses in a nonlinear medium. Opt. Lett. 9, 510–512 (1984). 12. Hauri, C. P. et al. Intense self-compressed, self-phase-stabilized few-cycle pulses at 2 µm from an optical filament. Opt. Lett. 32, 868–870 (2007). 13. Vozzi, C. et al. Millijoule-level phase-stabilized few-optical-cycle infrared parametric source. Opt. Lett. 32, 2957–2959 (2007). 14. Gu, X. et al. Generation of carrier-envelope-phase-stable 2-cycle 740-µj pulses at 2.1-µm carrier wavelength. Opt. Express 17, 62–69 (2009).
14
14
nature physics | www.nature.com/naturephysics
doi: 10.1038/nphys1940
supplementary information
15. M¨ucke, O. D. et al. Self-compression of millijoule 1.5 µm pulses. Opt. Lett. 34, 2498–2500 (2009). 16. B´ejot, P., Schmidt, B. E., Kasparian, J., Wolf, J.-P. & Legar´e, F. Mechanism of hollowcore-fiber infrared-supercontinuum compression with bulk material. Phys. Rev. A 81, 063828 (2010). 17. Trebino, R. et al. Measuring ultrashort laser pulses in the time-frequency domain using frequency-resolved optical gating. Review of Scientific Instruments 68, 3277–3295 (1997). 18. Chowdhuri, M. B. et al. Spectroscopic comparison between 1200 grooves/mm ruled and holographic gratings of a flat-field spectrometer and its absolute sensitivity calibration using bremsstrahlung continuum. Review of Scientific Instruments 78, 023501 (2007). 19. Yamazaki, T. et al. Comparison of mechanically ruled versus holographically varied linespacing gratings for a soft-x-ray flat-field spectrograph. Appl. Opt. 38, 4001–4003 (1999). 20. Wahlstr¨om, C.-G. et al. High-order harmonic generation in rare gases with an intense shortpulse laser. Phys. Rev. A 48, 4709–4720 (1993). 21. Farrell, J. P., McFarland, B. K., Bucksbaum, P. H. & G¨uhr, M. Calibration of a high harmonicspectrometer by laser induced plasmaemission. Opt. Express 17, 15134–15144 (2009). 22. Fill, E. et al. xuv spectra of optical-field-ionized plasmas. Phys. Rev. E 51, 6016–6027 (1995). 23. Shiner, A. D. et al. Wavelength scaling of high harmonic generation efficiency. Phys. Rev. Lett. 103, 073902 (2009). 24. Yudin, G. L. & Ivanov, M. Y. Nonadiabatic tunnel ionization: Looking inside a laser cycle. Phys. Rev. A 64, 013409 (2001). 25. Hankin, S. M., Villeneuve, D. M., Corkum, P. B. & Rayner, D. M. Intense-field laser ionization rates in atoms and molecules. Phys. Rev. A 64, 013405 (2001). 26. Popmintchev, T. et al. Phase matching of high harmonic generation in the soft and hard x-ray regions of the spectrum. Proc. Nat. Acad. Sci. U. S. A. 106, 10516 (2009).
15
nature physics | www.nature.com/naturephysics
15