These example modules will use the computer to present tasks that cannot be ... To the degree possible, TRE should allow us to disentangle component skills.
RESEARCH MEMORANDUM August 2001 RM-01-02
Problem Solving in Technology-Rich Environments
Randy Elliot Bennett Hilary Persky
Statistics & Research Division Princeton, NJ 08541
Problem Solving in Technology-Rich Environments1
Randy Elliot Bennett and Hilary Persky Educational Testing Service, Princeton, NJ 08541
August 2001
Research Memoranda provide preliminary and limited dissemination of ETS research prior to publication. They are available without charge from: Research Publications Office Mail Stop 10-R Educational Testing Service Princeton, NJ 08541
Abstract This paper describes the Problem Solving in Technology-Rich Environments (TRE) study. The TRE study will produce a set of example modules to assess problem solving with technology, and use these to address research questions related to employing technology in the National Assessment of Educational Progress (NAEP). The TRE modules are built around electronic information search and simulation (the latter of which is the focus of this report). Among other things, the modules are designed to incorporate incidental learning as a goal of good assessment, capture the multidimensional nature of problem solving in technology environments, take advantage of the unique capabilities of the computer, and disentangle component skills to describe student characteristics more meaningfully. In operational NAEP assessments, many such modules might be randomly spiraled among groups of students to provide evidence of problem solving with technology generally. Alternatively, a few such modules might be combined with a traditional subject-matter survey as a means of adding depth to the picture of what students know and can do. Key Words: assessment, discovery environment, educational testing, problem solving, scientific inquiry, Technology-Rich Environments (TRE)
i
Problem Solving in Technology-Rich Environments2 The Problem Solving in Technology-Rich Environments (TRE) study is being conducted as one of several research studies designed to lay the groundwork for incorporating new technology in the National Assessment of Educational Progress (NAEP). NAEP is the only continuing, nationally representative survey of what U.S. students know and are able to do in school subjects. The TRE study has two main purposes. The first purpose is to demonstrate one innovative use of computers in NAEP by developing example modules to assess problem solving with technology. The second purpose is to answer research questions related to the measurement, equity, efficiency, and operational implications of using new technology in NAEP. These example modules will use the computer to present tasks that cannot be delivered through conventional paper-and-pencil means but that we believe tap important emerging skills. The subject-matter context for the modules will be physical science. However, it should be noted that similar measures could be built for other fields of science, for mathematics, and for social science domains. The example modules sample from a universe of content domains and technology environments. We would suggest that the construct, “Problem Solving in Technology-Rich Environments,” might conceivably span content domains like biology, ecology, physics, economics, and history. Similarly, we posit that various technology-rich environments could be used in these domains, including databases, text editors, simulation tools, dynamic visual displays of information, spreadsheets, and presentation tools. For our example modules, we chose to sample from that universe so that the same content—the science associated with gas balloons—carries through different technology environments. Table 1 represents this domain conception. In the table, the TRE measure is indicated within the substantive area of physics. The measure is depicted as incorporating several technology uses (marked by x’s) within the same problem context. Note that this path through the domain results in an assessment very different in character from what would have occurred had we taken a vertical path (i.e., focused on a single technology use across different content domains).
1
Table 1 A Domain Conception for Problem Solving in Technology-Rich Environments Technology-Rich Environments
Problem Area Biology Ecology Physics Balloon Economics History
Database
Text Editor
Simulation
Dynamic Visual Display of Information
xxxxxxx
xxxxx
xxxxxxx
xxxxxxxxx
Interactive SpreadFeedback sheet
xxxxxxx
Presentation and Communication Tools
Development of the TRE modules has been guided by several principles: •
TRE should be an assessment, not instruction, but students should be able to learn from it incidentally. Because the states are responsible for curriculum and because NAEP’s charge by law is assessment, NAEP must be careful not to stray from its mission into realms reserved for others. However, there is no reason why NAEP shouldn’t create outstanding assessments that are also educationally worthwhile. Such assessments may, in fact, provide one potential means for building greater participation in the program.
•
TRE should use the computer to do what can’t easily be done on paper. The TRE study will explore the measurement of skills that are becoming important because of the computer. In addition, we hope it will also suggest ways in which traditional content might be measured more effectively through technology.
•
TRE should represent the type of problem solving done with computers in educational and work environments. There are two propositions associated with this principle. The first proposition is that problem solving in technology-rich environments is multidimensional. That is, success requires both knowledge of the substantive domain in which the problem is set and skill in using technology tools. The second proposition is that problem solving in technology-rich environments is driven by the
2
substantive problem, not by the technology: Successful problem solvers in a domain tend to look for the tool that is best suited to their problem, not a problem suited to the tool that happens to be closest at hand. •
TRE should be positioned so it can inform the development of a future assessment of emerging skills or of more traditional subject matter. We are attempting to give our client, the National Center for Education Statistics, the option of taking tasks like these and employing them as part of an assessment of skill in problem solving with technology generally or as part of an existing content-based assessment like science.
•
To the degree possible, TRE should allow us to disentangle component skills. The fact that problem solving in technology-rich environments is multidimensional offers the opportunity to describe performance with something more than a single summary score. Lower levels of description may be important because what underlies an overall performance may be critical to understanding where our schools need to improve.
The target population for the TRE modules is composed of eighth-grade students attending public and private schools in the United States. We assume that these students have at least basic computer skills. We believe this assumption is tenable given that the ratio of students to computers in U.S. schools in 1999–2000 was about 5:1 (Market Data Retrieval, 2000). Because of the prevalence of experimental methodology and physics content in eighth-grade science curricula, we assume that members of the population have had some basic exposure to scientific inquiry and to basic concepts of mass and volume. We also assume that they can read scientifically oriented material at a sixth-grade level. Our measurement goal for the modules is to be able to judge, with some degree of certainty, level of proficiency in solving science problems presented in a technology-rich environment. We have defined that proficiency to include a combination of scientific inquiry and computer skills that might be best thought of as “electronic scientific-inquiry skill.” For this skill, we wish to make judgments for the target population, as well as for relevant subpopulations. How do we define the components of this electronic scientific-inquiry skill? By scientific inquiry skill, we mean being able to find information about a given topic, judge what information is relevant to a problem, plan and conduct experiments, monitor one’s efforts, organize and
3
interpret results, and communicate a coherent explanation. We should note that the essential features of classroom scientific inquiry are acknowledged to vary along several dimensions, with some implementations considered to be “full” and others “partial” inquiry (Olson & LoucksHorsley, 2000, p. 28–30). Our implementation is one of partial inquiry; full inquiry gives greater attention to question choice, explanation, and connections of those explanations with scientific knowledge than we are able to give in these modules. Our choice of partial inquiry is largely a practical one based on limited testing time, the need to impose constraints for assessment that would be unnecessary in an instructional context, and the need to provide an example that could be taken either in the direction of a content-based assessment or a more general “problemsolving with technology” assessment. For the second proficiency component, computer skill, we do not mean computer skill in the large, but rather something considerably more focused and lower level. We mean (1) being able to carry out the (mostly) mechanical operations of using a computer to find information, run simulated experiments, get information from dynamic visual displays, construct a table or graph, sort data, and enter text; and (2) being able to monitor one’s efforts. This conception is based on the belief that, in the extreme (i.e., separated from all substantive knowledge), computer skill is nothing more than automatized pointing, clicking, and keying. These actions become automatized through repeated practice with different software applications. We can take advantage of this fact for measurement purposes by building into our assessments the interface conventions found in common applications. Because computer-familiar students will have developed the appropriate schema, they should negotiate our assessment more quickly and effectively than their less computer-familiar counterparts. However, when we integrate this lower-level computer competency with scientific inquiry, we get a purposeful, content-driven, decidedly non-mechanical use of the computer for scientific problem solving. What will be reported? For the target population, as well as for relevant subpopulations, we will likely report levels of proficiency for overall skill in problem solving in technology-rich environments, for scientific inquiry skill, and for computer skill. In addition, we may segment scientific inquiry skill further into exploration (i.e., carrying out the activities related to answering a given question) and synthesis (i.e., answering the question itself). Finally, we will report a descriptive summary of key student behaviors (e.g., how often students made predictions, how often they created tables and graphs).
4
This design poses several measurement issues. First, there may be instances where a lack of one component skill interferes with measurement of the other. In one sense, this is not a serious difficulty: To solve problems successfully in a real-world technology environment, the component skills must come into play in an integrated manner. Arguably, it is this integration that is of ultimate interest. However, we have also stated as a development principle that the components are of interest, in part, because they may help in understanding the integrated performance and its implications for improving education. The issue for the TRE design is that some students might have scientific inquiry skills or conceptual knowledge that is not up to the level of our particular substantive problem and, therefore, these students might not be able to show their technology skill at all. Similarly, there may be students whose computer skills do not meet the demands of our TRE example and who, consequently, are unable to show their scientific inquiry skill. A second issue is generalizability. In this study, we will collect data on how a nonrepresentative sample of students applies a few technology tools to a small number of substantive problems.3 Thus, we obviously won’t be able to extrapolate TRE results to problem solving in technology-rich environments generally, nor to the nation’s eighth-graders as a whole. Finally, there is construct validity. Typically, in such a study we would collect data from measures that were both theoretically related to and distinct from our experimental one. We would do this collection in an effort to locate our experimental measure in some multidimensional space consistent with our theoretical expectations for the measure, thereby lending support to the meaning of scores. Part of that analysis involves ruling out plausible competing hypotheses for performance. Plausible competing hypotheses might include that the TRE modules are unduly influenced by reading comprehension, that they measure the same types of science skill assessed in paper and pencil, or that they are primarily a measure of general ability. For this project, we are greatly restricted in the additional measures we can administer by the limited time for which we can test students. For the study, we will administer five measures. The first measure is a test of prior knowledge related to the science and uses of gas balloon flight. This measure is intended to give a sense of which (and how many) students have enough prior knowledge that they may come to the assessment already knowing the relationships we are asking them to discover. The second measure is a computer background questionnaire that also includes a few items that measure
5
computer skills. This device will provide an independent indicator of computer familiarity. Third, we will administer a demographic questionnaire to describe the sample and allow for subgroup comparisons. Finally, we will administer two closely related TRE modules intended to measure different aspects of the complex construct we have described above. Both modules revolve around the science of gas balloon flight. The modules are Search and Simulation. The Search module asks the student to use a Web search tool to answer questions about the science and scientific uses of gas balloons. The Simulation module requires the student to use a “what-if” tool to uncover scientific relationships about gas balloon flight. The TRE Search and Simulation modules are being developed through a process of evidence-centered design (Mislevy, Steinberg, Breyer, Almond, & Johnson, 1999a, 1999b). Evidence-centered design focuses the developer on identifying the claims to be made on the basis of assessment results, the evidence needed to support those claims, the behaviors that will provide that evidence, and the tasks required to elicit those behaviors. This structured process is particularly suited to the creation of complex assessments, which typically have high development costs. The process is intended to increase the likelihood that assessment components will be reusable and to allow for clear linkages from each test item to the claim(s) that item was intended to support. The remainder of this paper will focus on the Simulation module, as its development is further along.
The TRE Simulation Module The TRE Simulation module asks the student to use scientific inquiry and computer skills to solve problems related to the physics of gas balloon flight. The module presents a simulation tool that students can use to answer what-if questions about balloon behavior. The module draws on the research of Glaser and associates, (Raghavan, Sartoris, & Glaser, 1998; Schauble, Glaser, Raghavan, & Reiner, 1991; Shute & Glaser, 1990, 1991), as well as that of White (White & Frederiksen, 1998). The common theme running through this work is the “discovery environment.” A discovery environment is a microworld where a student can experiment to construct an understanding of some underlying phenomenon. Although these environments have primarily been used for instructional purposes, they also hold promise for assessment.
6
A second basis for our work are standards for students’ science and technology skills (e.g., International Society for Technology in Education, 1998; National Committee on Science Education Standards and Assessment, 1995). These standards typically cite scientific inquiry, problem solving with technology, and the use of simulation as key proficiencies. Evidence for standing on the overall “problem-solving in technology-rich environments” construct measured by the module will be drawn from what students do with the simulation tool and how effectively they answer questions about the science of gas balloon flight. Thus, we are attempting to use both product and process information to make inferences about student skill. In the context of the Simulation module, we define computer skill as a subset of the definition given above, which applies to the Search and Simulation modules in combination. For the Simulation module alone, computer skill means (1) being able to carry out the mechanical operations of using a computer to run simulated experiments, get information from dynamic visual displays, construct a table or graph, sort data, and enter text; and (2) being able to monitor one’s efforts. We hypothesize that students with high skill levels will behave in certain ways. Our initial belief is that students who have a high level of computer skill will provide the following types of evidence of their proficiency. The more positive instances that are provided, the stronger should be our belief in a high level of computer skill for that student. Students with high computer skill should tend to: • Regardless of substantive correctness, use the simulation tool to carry out the mechanics of: o selecting values o making predictions o running experiments o creating tables and/or graphs o sorting data o drawing conclusions • Make observations about gas balloon behavior based on a dynamic visual display • Use the Computer Help function sparingly • Respond to the Computer Help function appropriately
7
For the Simulation module, scientific inquiry skill means being able to judge what information is relevant to a problem, plan and conduct experiments, monitor one’s efforts, organize and interpret results, and communicate a coherent explanation. Students who have a high level of scientific inquiry skill should tend to: •
Make accurate predictions about gas balloon behavior
•
Pose experiments that build on previous ones by systematically controlling variables (Schauble, Glaser, Raghavan, & Reiner, 1991; Shute & Glaser, 1990)
•
Run enough experiments (with appropriate data points) to support defensible conclusions (Schauble, Glaser, Raghavan, & Reiner, 1991; Shute & Glaser, 1990)
•
Organize data appropriate to the problem in a table or graph
•
Draw correct conclusions about the physics of gas balloon flight
•
Respond accurately to multiple-choice questions that synthesize knowledge about the physics of gas balloon flight
•
Use the Science Help function sparingly
•
Respond to the Science Help function appropriately
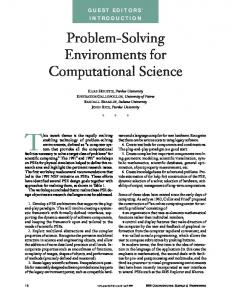
To be sure, the above behaviors represent a hypothesis about the features that distinguish novice from proficient performance in our problem-solving domain. To test this hypothesis, we will need to compare the performance of students whom we know by other measures to be novices in computer skill and in scientific inquiry skill with that of students we know to be proficient. Such a study will allow us to refine these initial claims. The simulation-tool interface is shown in Figure 1. The problem the student is to solve is displayed in the upper right-hand corner. It asks the student to determine the relationship between mass and altitude. The interface is organized to facilitate a structured inquiry process built around designing an experiment, running it, and interpreting results. To design an experiment, the student may choose values for the independent variable (e.g., mass) or make a prediction. Under Interpret Results, he or she may construct a table, display a graph, or draw conclusions. The student can attempt this process in any order (although some orders obviously will be more productive than others) and can conduct as many experiments as desired. Simulation results are presented in the flight box on the left of the screen and by the instrument panel below that 8
box. Values are displayed for the altitude reached by the balloon, the volume the balloon achieves, the time taken to reach that volume and altitude, the payload mass, and the amount of helium put into the balloon (which is held constant for this problem). Three forms of help are offered, as indicated by the buttons in the lower right-hand corner. These buttons bring up a glossary of science terms, science help, and computer help. Computer help describes the buttons and functions of the simulation-tool interface. Science help gives hints with the substance of the problem. A brief, animated tutorial demonstrates how to use the Simulation tool. After the tutorial, the student can begin working with the tool by choosing a value for mass, the independent variable. Figure 2 shows the resulting screen. Note immediately that we have imposed two constraints on the problem. First, we limit the student’s choice of the independent variable to mass. Second, we fix the values of mass that the student can select. We imposed these constraints because of time limitations and concern that the problem would otherwise be too difficult for significant numbers of eighth-graders. After choosing a value for the independent variable, the student might (or might not) choose to make a prediction. If the student chooses to make a prediction, he or she can do so by clicking on the Make Prediction button, which appears under Design Experiment. This action brings up a list of four possible outcomes (see Figure 3) intended to encourage the student to think about the impact on altitude of varying the payload mass. When the student is ready to run an experiment, clicking Try It causes the instrument display to activate and may cause the balloon in the flight box to rise (see Figure 4). The student may decide at this point (or at any other) to interpret the results by constructing a table or graph, or by drawing a conclusion. One can make a table by pressing the appropriate button, which brings up the dialogue box shown in Figure 5. Note that here we allow the student leeway to get into trouble. The student constructs a table by choosing from the variables tracked in the instrument display. The resulting table may, therefore, contain relevant information, some relevant and some irrelevant information, or only irrelevant information. If the student chooses to include all five variables, the table will appear as in Figure 6. For each subsequent experiment, a line of data is added to the table automatically. The student can sort the table according to any variable by clicking on the appropriate column heading.
9
A graph can be created in a similar manner. Clicking on the Make Graph button will open up a dialog box appears that asks the student to select a variable for the vertical axis (see Figure 7) and then, in a subsequent screen, for the horizontal axis. Again, the student is allowed to create information displays that may or may not be relevant to the problem. If the appropriate variables are selected, the graph should look like the one in Figure 8. Note that the relationship we want students to discover in this first problem is a simple negative, linear one: As mass increases, the altitude the balloon can achieve decreases. Note also that, in the absence of any knowledge of the form of the underlying mass-altitude relationship, we would expect the proficient student to choose carefully the number and spread of values for mass. Too few values or too narrow a range would fail to confirm that the underlying relationship is linear throughout. The last action the student may wish to take is to draw a conclusion. Clicking on the Draw Conclusions button brings up a text-entry box (see Figure 9). This box calls for an answer to the question about how payload mass affects altitude and asks that the answer be supported with experimental observations. Before finishing the conclusion, the student may choose to revisit an existing table or graph, construct new tables or graphs, or conduct more experiments. Following this screen, we may pose related questions that the student can answer by choosing from a key-list. These questions could conceivably provide a more accurate measure for students who are unable to express their understanding in free-form writing. This initial problem is followed by two additional ones. The first of these problems asks the student to discover a more complex, bivariate, nonlinear relationship. The second problem asks the student to discover how two independent variables work together to determine a third quantity.
Scoring As of this writing, our specifications for scoring are not complete, although the general outline is clear. We expect scoring to be a three-step process of feature extraction, feature evaluation, and evidence aggregation. Feature extraction will entail deciding what elements of a student response to isolate from the complete transaction record for scoring purposes. To identify those elements, we will work from the behaviors we expect proficient performers to display.
10
The second step, feature evaluation, will involve assigning a score to each extraction. Dichotomous scoring will be appropriate for some extractions, whereas others may be amenable to partial-credit schemes. For example, we might decide to award one point for every correct prediction that the student makes. Likewise, we might decide to score students’ written conclusions for each of the problems on a four-point scale. Feature evaluations will be done automatically where feasible. The final step, evidence aggregation, entails combining the feature scores in some principled manner that allows us to connect student behaviors to inferences about performance. Because we are interested in capturing the multidimensionality inherent in these modules, we are planning to do this aggregation using inference networks, which offer a formal statistical framework for reasoning about interdependent variables in the presence of uncertainty. (See Mislevy, Almond, Yan, & Steinberg, 1999, for technical details on using these networks in educational testing.) As part of this approach, we will depict our theory about what is being measured by TRE as a student model. This model organizes the components of proficiency in the domain of problem solving in technology-rich environments. That organization falls directly out of the discussion above, which posits that problem solving in technology-rich environments is composed of computer skill and scientific inquiry skill. These skills may, in turn, be comprised of further elements; for example, exploration and synthesis represent a possible decomposition of scientific inquiry, although more fine-grained decompositions may also be feasible. Standing on each student model variable is expressed in terms of a proficiency level with some degree of uncertainty. Any number of levels may be assigned, but for our purposes three levels might be sufficient. Those levels might be termed “proficient,” “intermediate,” and “novice,” or some similar set of descriptors. Our uncertainty regarding a student’s standing takes the form of the probability that he or she is at each level. Each of the observations we make is connected to one or more variables in the student model. The connections determine the likelihood of observing a particular feature evaluation (e.g., a written conclusion receiving four points) given a particular configuration of the student model (e.g., proficient on all skills). These probabilities may initially be set subjectively or on the basis of available information. As data are collected, the probabilities (and the model itself) can be refined.
11
When a student takes a module, the score for each feature is used to update our belief about the student’s standing on the skill component to which the feature is connected. Thus, observing a maximum score of 4 for one of the Simulation conclusions would increase our belief (i.e., probability) in that student being proficient in synthesis skill. This increase would then propagate to other skills linked to synthesis. So, the probability that the student was proficient in scientific inquiry would also increase, as would that for problem solving in technology-rich environments. This updating of the student model is carried out until all feature evaluations are incorporated. We can then generate a profile that gives the proficiency level for each model variable, and the uncertainty associated with that level, for individuals, subgroups, and the test population.
The Relationship Between Simulation and Search Whether the Simulation module should be employed in conjunction with the Search module is unresolved. On the one hand, it is widely recognized that successful problem solving requires content knowledge in addition to domain-dependent and domain-independent strategies (Baker & O’Neil, in press). Similarly, current conceptions of scientific inquiry stress the integration of content knowledge with scientific process (Olson & Loucks-Horsley, 2000). These conceptions would argue for presenting the Simulation and Search modules in combination, using one to help with the questions posed by the other. That is, one might imagine students using the Search module to develop their knowledge of mass, volume, and gas balloons as they are attempting to solve the problems presented in the Simulation module (e.g., the Search module might be useful in helping students interpret the complex nonlinear relations presented in Simulation or in helping them deal with the more sophisticated problems that would comprise a 12th-grade version of the module). Similarly, one could conceivably answer a question posed in the Search module with both information gained from the Web and experimental results generated through the Simulation module. While combined use is very attractive theoretically, it poses significant practical problems. Most critically, combined use might require more student time than participating schools would be willing to offer. Even if that time could be made available, it might have to be
12
distributed across more than one testing session, increasing administration costs and potentially allowing student performance to be influenced by other sources (e.g., peers, teachers, parents).
Potential Uses in NAEP How might assessments like TRE be used in NAEP? One potential use is as a survey measure of problem solving with technology. Following development of a framework for this domain, which would be created by the National Assessment Governing Board, one would generate several TRE modules, each with different substantive problems. These modules might be designed to cross substantive problems and technology use (i.e., several types of computer use in each of several problem contexts). Each of these modules would then be randomly assigned to a different group of students, with some students taking more than one module to allow for estimating the covariances among the modules. One would then estimate population performance on the full set of modules from the performance of the samples taking each one. Another use would be as part of a “multiple-methods” NAEP (Pellegrino, Jones, & Mitchell, 1999) conducted within an existing content framework (e.g., science, history, or mathematics). In this conception, conventional paper-and-pencil survey tests would be employed to sample the content domain broadly. In addition, extended computer-delivered tasks would be used with smaller examinee samples to provide a deeper, more qualitative understanding of what students can do in segments of the domain that cannot be probed as completely with standard methods.
Conclusion The TRE project is being conducted as one of several studies to lay the groundwork for incorporating new technology in NAEP. TRE is intended to demonstrate one innovative use of computers in NAEP by developing an example set of modules to assess problem solving with technology. This paper has described one of those modules, Simulation, in detail. We can perhaps best summarize the essence of the TRE study by reiterating its development principles and how the project has attempted to realize them.
13
•
TRE should be an assessment, not instruction, but students should be able to learn from it incidentally. We believe that the evidence-centered design approach used to create TRE has put us in good position to make targeted inferences from performance about student skills. We believe it is also the case that most students will find working with the assessment will provide more of a learning experience than the typical largescale test provides.
•
TRE should use the computer to do what can’t easily be done on paper. The TRE modules allow students to explore what-if questions, interpret a dynamic visual display, and use electronic information search. In addition, the modules allow us to track the processes students use in problem-solving activities. None of these capabilities could be easily achieved with conventional testing technology.
•
TRE should represent the type of problem solving done with computers in educational and work environments. TRE attempts to capture the multidimensionality characteristic of this problem solving by requiring students to demonstrate both basic facility with the computer and substantive skill. We have tried to emphasize technology as a means, rather than an end, by carrying the same problem context across different technology uses appropriate to that problem context.
•
TRE should be positioned so it can inform the development of a future assessment of emerging skills or of more traditional subject matter. It should be possible to incorporate meaningful exercises built around using a simulation tool or electronic information search into existing NAEP subject-matter assessments. It should also be possible to use the TRE modules as initial models for measures of problem solving with technology generally.
•
To the degree possible, TRE should allow us to disentangle component skills. To assist students with low science skills, we demonstrate inquiry in the Simulation tutorial, organize the interface to encourage good inquiry, include a glossary of science terms, progressively stage problem difficulty, and provide science help. For those students with low computer skills, we demonstrate how to use the interface in the tutorial, use familiar interface conventions (like the dialog boxes found in most Windows software), and provide computer help. Third, as part of the assessment, we collect evidence relevant to each of the specific component skills. Finally, we are
14
using a measurement model capable of handling the multidimensionality inherent in this type of assessment.
15
References Baker, E.L., & O’Neil, H.F. (in press). Technological fluency: Needed skills for the future. In H.F. O’Neil & R. Perez (Eds.), Technology applications in education: A learning view. Mahwah, NJ: Erlbaum. International Society for Technology in Education (ISTE). (1998). National educational technology standards for students. Eugene, OR: Author. Market Data Retrieval (MDR). (2000). Nation’s k-12 schools make major gains in technology (press release). Retrieved from http://www.schooldata.com/pr22.html. Mislevy, R.J., Almond, R.G., Yan, D., & Steinberg, L.S. (1999). Bayes’ nets in educational assessment: Where do the numbers come from? In K.B. Laskey & H. Prade (Eds.), Proceedings of the fifteenth conference on uncertainty in artificial intelligence (pp. 437–446). San Francisco: Morgan Kaufmann Publishers, Inc. Mislevy, R.J., Steinberg, L.S., Breyer, F.J., Almond, R.G., & Johnson, L. (1999a). A cognitive task analysis, with implications for designing a simulation-based assessment system. Computers and Human Behavior, 15, 335–374. Mislevy, R.J., Steinberg, L.S., Breyer, F.J., Almond, R.G., & Johnson, L. (1999b, September). Making sense of data from complex assessments. Paper presented at the 1999 CRESST Conference, Los Angeles, CA. National Committee on Science Education Standards and Assessment. (1995). National Science Education Standards. Washington, DC: National Academy Press. Olson, A., & Loucks-Horsley, S. (Eds.). (2000). Inquiry and the National Science Education Standards: A guide for teaching and learning. Washington, DC: National Academy Press. Pellegrino, J.W., Jones, L.R., & Mitchell, K.J. (1999). Grading the nation’s report card. Washington, DC: National Academy Press. Raghavan, K., Sartoris, M.L., & Glaser, R. (1998). Why does it go up? The impact of the MARS Curriculum as revealed through changes in student explanations of a helium balloon. Journal of Research in Science Teaching, 35, 547–567. Schauble, L., Glaser, R., Raghavan, K., & Reiner, M. (1991). Causal models and experimentation strategies in scientific reasoning. The Journal of the Learning Sciences, 1, 201–238. 16
Shute, V., & Glaser, R. (1990). A large-scale evaluation of an intelligent discovery world: Smithtown. Interactive Learning Environments, 1, 55–77. Shute, V., & Glaser, R. (1991). An intelligent tutoring system for exploring principles of economics (pp. 333–366). In R.E. Snow & D.E. Wiley (Eds.), Improving inquiry in social science. Hillsdale, NJ: Erlbaum. White, B.Y., & Frederiksen, J.R. (1998). Inquiry, modeling, and metacognition: Making science accessible to all students. Cognition and Instruction, 16, 3–118.
17
Figure 1 The Simulation Tool Interface
18
Figure 2 Choosing a Value for the Independent Variable
19
Figure 3 Making a Prediction
20
Figure 4 Running the Experiment
21
Figure 5 Choosing Variables for a Table
22
Figure 6 A Sample Table
23
Figure 7 Choosing Variables for a Graph
24
Figure 8 A Sample Graph
25
Figure 9 Drawing a Conclusion
26
Notes 1
This work was done under cooperative agreement for the Office of Educational Research and Improvement (OERI), National Center for Education Statistics, Washington, DC, 20208, CFDA#84.902F. The positions expressed herein do not necessarily represent those of OERI or of Educational Testing Service.
2
ETS staff members contributing to the TRE study include Andy Baird, Malcolm Bauer, Kevin Bentley, Jeff Haberstroh, Cindy Hammell, Kathy Howell, Frank Jenkins, Holly Knott, Mary Lauko, Lou Mang, Chris O’Sullivan, Debbie Pisacreta, Peggy Redman.
3
The sample will be nonrepresentative because many schools will not have the level of computer technology needed to run TRE.
27