Proceedings of the Problem@Web International Conference: Technology, creativity and affect in mathematical problem solving
Editors Susana Carreira, Nélia Amado, Keith Jones, and Hélia Jacinto
Copyrights © 2014 left to the authors All rights reserved May, 2014 Faro, Universidade do Algarve ISBN 978-989-8472-50-2 Cover Photo: Vilamoura Marina (Courtesy of the Municipality of Loulé) Cite as: Carreira, S., Amado, N., Jones, K., & Jacinto, H. (Eds.) (2014). Proceedings of the Problem@Web International Conference: Technology, creativity and affect in mathematical problem solving. Faro, Portugal: Universidade do Algarve. Proceedings available for download at: http://hdl.handle.net/10400.1/3750.
i
TABLE OF CONTENTS Acknowledgements ………………………………………………………………………..
vii
Organizing Committee ……………………………………………………………………
viii
International Scientific Committee ………………………………………………………
viii
The Problem@Web Project: An overview ……………………………………………….
ix
Opening Note from the Editors ………………………...………………………………… Susana Carreira, Nélia Amado, Keith Jones, Hélia Jacinto
1
PLENARY SESSIONS
LECTURES Math problem, Internet and digital mathematical performance ……………………… Marcelo Borba
4
Roles of aesthetics and affect in mathematical problem solving …………………….... Norma Presmeg
6
The curriculum, creativity and mathematical competitions ………………………….. Jaime Carvalho e Silva
8
Multiple solution problems in computerized and non-computerized environments: what difference does it make? ………………………………………………………….... Michal Tabach
10
PANEL Present and future roles of online math competitions in the education of twenty-first century young students ………………………………………………………………...…. João Pedro da Ponte, Keith Jones
ii
12
KEYNOTE ADDRESSES Strand 1 – Technology: strategies and representations used in technology-based problem solving approaches The use of digital tools in web-based mathematical competitions: degrees of sophistication in problem solving-and-expressing ………………………………….. Hélia Jacinto, Sandra Nobre, Susana Carreira, Nélia Amado
14
Strand 2 – Creativity: students’ mathematical creativity in mathematical problem solving Highlighting creativity in children’s beyond-school mathematical problem solving Nuno Amaral, Susana Carreira
16
Strand 3 – Affect: attitudes and emotions of students, parents and teachers regarding mathematical problem solving The affective relationship of youngsters and parents with mathematics and problem solving in inclusive mathematical competitions …………………………. Nélia Amado, Susana Carreira, Eugénia Castela, Rosa Antónia Tomás Ferreira
19
PARALLEL SESSIONS
RESEARCH PAPERS Strand 1 – Technology: strategies and representations used in technology-based problem solving approaches Digital storytelling for improving mathematical literacy ………………………….. Giovannina Albano, Anna Pierri
23
Using statistical software in basic education: difficulties and affordances ……….. Cláudia Fernandes, João Pedro da Ponte
35
Correlation between different learning styles and the use of wiki in learning …… Nashwa Ismail, Julie-Ann Edwards, Gary Kinchin
47
The role of peer and computer feedback in student’s problem solving …………... Júlio Paiva, Nélia Amado, Susana Carreira
59
Simulating random experiments with computers in high school level teaching …. Bernard Parzysz
71
Electronic forums: an added value when solving initial algebraic problems ……. M. Pilar Royo, Joaquin Giménez
84
iii
Preservice high school teachers’ construction and exploration of dynamic models of variation phenomena ……………………………………………………………… Manuel Santos-Trigo, Matías Camacho-Machín, Carmen Olvera-Martínez
96
The role of using technology and creativity in developing positive dispositions toward mathematical problem solving ……………………………………………… Mehmet Türegün, Luis Conde
108
Strand 2 – Creativity: students’ mathematical creativity in mathematical problem solving
iv
How to foster creativity in problem posing and problem solving activities ……… Cinzia Bonotto, Lisa Dal Santo
120
Mathematical problems in basic education ………………………………………… Virginia Furlanetto, Maria Madalena Dullius, Italo Gabriel Neide
133
Dimensions of mathematically creative processes in early childhood …………….. Melanie Münz
144
Creative advantages of visual solutions to some non-routine mathematical problems ………………………………………………………………………………. Norma Presmeg
156
The borrowers: using transportation, addresses, and paralelepípedos to prompt creativity using Ethnomodeling …………………………………………………….. Daniel Clark Orey, Milton Rosa
168
Creativity in mathematics class: how can it emerge? ……………………………… Sandra Pinheiro, Isabel Vale
179
Strategies used by elementary grade students in Mathematics Olympiad tests …. Márcia Jussara Hepp Rehfeldt, Marli Teresinha Quartieri, Maria Madalena Dullius
192
Writing problem stories: developing creativity through the integration of mathematics and language …………………………………………………………... Fátima Sardinha, Pedro Palhares, Fernando Azevedo
204
Revealing the inner connections of math using a clock puzzle ……………………. Sabine Stöcker-Segre
217
Mathematical creativity through the eyes of future teachers ……………………... Isabel Vale, Ana Barbosa, Lina Fonseca
229
Noticing creativity issues when future teachers analyzing problem solving dialogues ………………………………………………………………………………. Yuly Marsela Vanegas, Joaquin Giménez
242
Strand 3 – Affect: attitudes and emotions of students, parents and teachers regarding mathematical problem solving Practice in the mathematical modelling environment ……………………………... Bárbara Cândido Braz, Lilian Akemi Kato
254
Cognitive scaffolding for problem solving: use of the practical worksheet ………. Jaguthsing Dindyal, Eng Guan Tay, Khiok Seng Quek, Yew Hoong Leong, Tin Lam Toh, Pee Choon Toh, Foo Him Ho
265
Affective issues in solving challenging mathematical problems within an inclusive competition ……………………………………………………………………………. Rosa A. Tomás Ferreira, Susana Carreira, Nélia Amado
275
Identifying cognitive-affective interaction phenomena in a technological mathematical context ………………………………………………………………… Inés M. Gómez-Chacón
288
An exploratory study on using the think-pair-share cooperative learning strategy for students to solve mathematics problems in a Hong Kong primary school …… Andrew P. Kwok, Alexandria Lau
300
A mathematical congress: a window to affect in problem solving ………………... Teresa Pimentel, Isabel Vale
308
Teachers’ involvement and learning in a lesson study …………………………….. João Pedro da Ponte, Marisa Quaresma, Mónica Baptista, Joana Mata-Pereira
321
E-POSTERS Teaching and learning mathematics for creativity through challenging tasks …........... Ana Barbosa, Isabel Vale, Teresa Pimentel
335
Developing positive dispositions toward mathematical problem solving ……………… Luis Conde, Mehmet Türegün
337
Posing and solving problems in mathematical modeling scenarios ……………………. Cristina Esteley, María Mina, Mónica Villarreal
338
DROIDE II – Robots in mathematics and informatics education – final results of the project ……………………………………………………………………………………... Elsa Fernandes
339
Problem solving: carving out spaces for creativity, communication, and perseverance Deborah Moore-Russo, Anne Izydorczak, Harry T. O’Malley Proof and creativity in a geometrical problem from a regional Mathematical Olympiad ………………………………………………………………………………….. Juan Rodriguez, Nélia Amado, Susana Carreira, Sílvia Reis
340
341
v
Information environment for mathematics education based on relationship development theory ……………………………………………………………………….. Karasawa Toshimitsu
342
Problem solving in modeling scenarios with experimental activities: the role of information and communication technologies …………………………….…………….. Mónica Villarreal, María Mina, Cristina Esteley
344
Reviewers …………………………………………………………………………………..
345
List of participants ………………………………………………………………………...
346
Sponsors ……………………………………………………………………………………
350
vi
ACKNOWLEDGEMENTS This Conference was kindly supported by several sponsors and organizations. We wish to express our special thanks to:
Câmara Municipal de Loulé Hotel Dom Pedro Golf Springer Dismel Texas Instruments Pelcor Raiz Editora Associação de Professores de Matemática (APM) Fundação para a Ciência e a Tecnologia (FCT) Região de Turismo do Algarve
vii
ORGANIZING COMMITTEE Nélia Amado [Chair], Faculty of Sciences and Technology, University of Algarve, Portugal Hélia Jacinto, Research Unit of the Institute of Education of the University of Lisbon, Portugal Isa Martins, Pinheiro e Rosa Schools Grouping, Faro, Portugal Jaime Carvalho e Silva, Faculty of Sciences and Technology, University of Coimbra, Portugal Juan Rodriguez, Faculty of Sciences and Technology, University of Algarve, Portugal Nuno Amaral, Basic School 2,3 Sophia de Mello Breyner Andresen, Lisbon, Portugal Rosa Antónia Tomás Ferreira, Faculty of Sciences, University of Porto, Portugal Sandra Nobre, Research Unit of the Institute of Education of the University of Lisbon, Portugal Sílvia Reis, Schools Grouping of Valpaços, Portugal Susana Carreira, Faculty of Sciences and Technology, University of Algarve, Portugal
INTERNATIONAL SCIENTIFIC COMMITTEE Keith Jones [Co-chair], University of Southampton, United Kingdom Susana Carreira [Co-chair], Faculty of Sciences and Technology, University of Algarve, Portugal Guida de Abreu, Oxford Brookes University, United Kingdom Inés Gómez-Chacón, Faculty of Mathematics, Complutense University of Madrid, Spain Isabel Vale, School of Education, Polytechnic Institute of Viana do Castelo, Portugal Jaime Carvalho e Silva, Faculty of Sciences and Technology, University of Coimbra, Portugal Joaquin Giménez, University of Barcelona, Spain João Filipe Matos, Institute of Education, University of Lisbon, Portugal João Pedro da Ponte, Institute of Education, University of Lisbon, Portugal Marcelo Borba, State University of São Paulo, Brazil Matías Camacho-Machín, University of la Laguna, Spain Michal Tabach, Tel Aviv University, Israel Nélia Amado, Faculty of Sciences and Technology, University of Algarve, Portugal Norma Presmeg, Illinois State University (Professor Emerita), United States of America Rosa Antónia Tomás Ferreira, Faculty of Sciences, University of Porto, Portugal
viii
THE PROBLEM@WEB PROJECT: AN OVERVIEW The Problem@Web International Conference is a satellite conference of a research project running in Portugal between December 2010 and June 2014, jointly developed by the Institute of Education of the University of Lisbon and by the University of Algarve. As the completion of the Problem@Web Projecti approaches, the research team and the project external consultant (Prof. Keith Jones) took upon themselves the task of promoting a conference aiming to present and disseminate the main results of the research undertaken within the project and to create the opportunity of sharing and discussing neighbouring perspectives and ideas from scholars and researchers in the international field. The project was launched to embrace the opportunity of studying mathematical problem solving beyond the mathematics classroom, by looking at the context of two web-based inclusive mathematical competitions, running in the south of Portugal – Sub12® and Sub14®. By addressing such a rich multi-faceted environment, the project intended to explore, in an integrated manner, issues that combine cognitive, affective and social aspects of the problem solving activity of young students. Therefore, the field of research was clearly based on inclusive mathematical competitions that occur mainly through the Internet, involving a clear digital communicational activity and inducing strong resonance with the homes and lives of students. The two competitions, Sub12 and Sub14, have been running since 2005, promoted by the Mathematics Department of the Faculty of Sciences and Technology of the University of Algarve. The Sub12 addresses students in 5th and 6th grades (10-12 year-olds) and the Sub14 addresses students in 7th and 8th grades (12-14 year-olds). The two competitions are web-based, located in the same website (http://fctec.ualg.pt/matematica/5estrelas/), have similar rules and operate in parallel. They involve two distinct phases: the Qualifying and the Final. The Qualifying phase develops entirely at distance through the website and consists of a set of ten problems each posted every two weeks. During the Qualifying phase competitors may participate individually or in small teams of two or three elements. They have to send their answers to the given problems by e-mail or through the digital form available at the website that allows attaching files. The answers to the problems are received in e-mail accounts specifically devoted to that purpose and the organization replies to every participant, with formative feedback, suggestions, clues or appraisal. Participants are allowed to resubmit revised solutions as many times as needed within the respective deadline. The Final is a half-day on-site contest held at the university campus with the presence of the finalists, their families and teachers. At the Final, participants are given a set of five problems to be solved in limited time with paper and pencil. Everyone is competing individually and there is no technology available. The written answers to the problems are corrected anonymously by a jury. In the meantime parents, teachers ix
and other accompanying guests have a program devoted to them (usually a seminar or a workshop about mathematical ideas, especially prepared for that occasion). The Final culminates with the awarding ceremony of the three winners who receive prizes and honour diplomas. Throughout the history of this competition a number of distinctive characteristics have been standing out: i) it proposes non-routine word problems, usually allowing several ways to be solved; ii) problems are not intended to fit any particular school curricular topic; iii) the main trend is on moderate mathematical challenges; iv) the competition explicitly requires participants to expose the process to find the solution; v) it is close to teachers and families in the sense that it encourages their support to the young participants; vi) opportunities for reformulating and resubmitting answers are offered to all participants; vii) all types of media to find and develop solutions are welcome; viii) communication and interaction is carried out through digital web-based and email infrastructures; ix) interesting and diverse proposed solutions are published on the competition website; x) the competitive component is concentrated on the Final phase of the competition. Based upon this context, the Problem@Web project has defined three research foci: (a) Ways of thinking and strategies in mathematical problem solving, forms of representation and expression of mathematical thinking, and technology-supported problem solving approaches; (b) Beliefs, attitudes and emotions related to mathematics and mathematical problem solving, both in school and beyond school, considering students, parents and teachers. (c) Creativity manifested in the expression of mathematical solutions to problems and its relation to the use of digital technologies. The empirical research involved two main approaches – extensive and intensive – and the data analysis combined quantitative and qualitative methods. The extensive approach drew on the following data: a database of participants’ digital productions in three editions of the competitions (emails and attached files); the finalists’ written solutions collected in the Finals; the answers to a mini-questionnaire about each proposed problem during the Qualifying phase (online); and an online survey to all students from the Algarve (online). The intensive approach aimed to in-depth study and the collected data included: interviews with participants (including former participants some years after leaving the competitions), interviews with parents (or family members) of participants; interviews with teachers who have students participating; participant observation and video-recording of the Finals; participant observation in regular classes where problems from the competitions were proposed; ethnographic observation of participants in their home environment. The project has implemented qualitative and quantitative data analysis methods, namely content analysis, case study research, statistical descriptive analysis, and multivariate statistical analysis.
x
For the theoretical framework particularly relevant theories were those that suggest and endorse the expression of mathematical thinking as an integral component of the problem solving process. Therefore, our research has elected solving-and-expressing as a central unit of the problem solving activity. Moreover, as our aim is to study students’ problem solving with the digital technologies of their choice, either at school or at home, the project pays particular attention to the expression of students’ mathematical ideas mediated by digital tools. In particular, the interweaving of technological fluency with mathematical knowledge (and problem solving ability) has motivated the study of participants’ “techno-mathematical fluency”. In connection to the challenging and inclusive character of the competition, the project has considered some affective aspects surrounding it. The concept of inclusive competition, rather than the competitive element, and the idea of challenging mathematical problem of moderate degree are key notions that structure the theoretical view on the research strand devoted to affect. Parental involvement, help-seeking in problem solving, perceived difficulty in tackling the problems from the competition, along with attitudes, beliefs and emotions of participants, their parents and teachers, concerning school and beyond-school mathematics, the participation in the competitions, and problem solving in general are strategic ideas in the research developed. Finally, some characteristics of the way in which the competitions work, among which stands out an extended time for the submission of answers to the problems, the possibility of using all available resources and the voluntary nature of participation, are factors that promote the emergence of mathematical creativity. Our option in researching students’ mathematical creativity in problem solving is to divide attention between the mathematical representations and the strategies devised by the participants. Considering the final quality of a product as one of the ways in which creativity can be approached both in mathematics as in other areas, we have examined students’ creative solutions to problems by proposing analytical forms of consensual assessment of creativity and by putting emphasis on an inclusive view of creativity that accounts for novelty and usefulness in mathematical problem solving. The Problem@Web Project has so far attained a significant number of interventions in research conferences as well as several national and international publications. It is our intention to develop the work produced so far and to strengthen it through the contribution of a wider community, namely in the form of an international conference devoted to the three strands that are the pillars of the very existence of the project. Susana Carreira (Principal Investigator) NOTES i
Acronym for the project Mathematical Problem Solving: Views on an interactive web based competition (Sub12 & Sub14), funded by Fundação para a Ciência e Tecnologia under the grant PTDC/CPE-CED/101635/2008.
xi
OPENING NOTE FROM THE EDITORS The Problem@Web International Conference is an opportunity to gather together participants from the research community in mathematics education as well as from related research areas such as the psychology of education, technology education, mathematics popularization and other relevant fields that converge to the study of mathematical problem solving in different educational environments in the twenty-first century. The conference has elected three major topics presented as strands, technology, creativity, and affect, within which pedagogical and research perspectives were anticipated. The strands thus represent key issues that are crucially embedded in the activity of problem solving, whether in teaching or learning mathematics, both within the school and beyond the school. Technology, creativity, and affect in mathematical problem solving were the main focuses of a research project conducted in Portugal over the past three years, under a grant from the Portuguese funding agency, Fundação para a Ciência e Tecnologia. This research project, in devoting particular attention to web-based mathematical competitions, in line with the growing acceptance and importance attributed to this type of initiative all over the world, set itself the goal of sharing results, ideas, conclusions and developments achieved along its course, through a scientific meeting with interested colleagues from other countries. The scientific programme thus gravitates around the three thematic strands, offering four plenary talks given by prominent researchers from different parts of the world and three keynote addresses proposed by members of the Portuguese Problem@Web research team followed by invited reactors’ comments, but it simultaneously took in mind to encourage and welcome submissions of research papers and e-posters. Our sincere thanks are due to the plenary speakers and to the invited reactors who generously accepted to enrich the conference with their insightful inputs. It is our pleasure to have reached the final program with 27 peer-reviewed research papers and 8 e-posters, distributed across the three strands of the conference, attaining a good solid body of work that filled the three days of the conference. We want to compliment all the authors for their relevant perspectives, and we are in debt to all the reviewers who kindly and thoroughly collaborated in revising and improving the proposals, under a process of open peer-reviewing. All this contributed to the high quality of the final published papers in the conference proceedings. The conference proceedings are offering an overview of all the research presented in the form of plenary sessions, research papers and e-posters. This conference aims to be the seed of future developments, in particular, allowing the gathering of researchers who join and gain momentum for the preparation of a post-conference book that pushes research forward on issues discussed during the three days of work and debate. Therefore the plenary sessions, including both the lectures from invited authors and the keynote addresses in each of the conference strands, were seen as starting points for 1
the development of further publishable material and their abstracts are offered in the conference proceedings as the authors’ approaches to the conference key issues. The research papers are fully published in the proceedings and represent a substantial part of its content, organized under the three strands of the conference, according to the authors’ own intention of inclusion of their work in a particular strand. Moreover, the e-posters are summarized as short one-page articles and also connect to one or more of the conference strands. Altogether, these proceedings combine multiple perspectives and ways of addressing and relating technology, creativity and affect, three promising development directions in the current research on mathematical problem solving. One last word of recognition is due to the University of Algarve and to the Institute of Education of the University of Lisbon, which jointly promoted this event, contributing with their invaluable support to the organization. Susana Carreira, Nélia Amado, Keith Jones, and Hélia Jacinto
2
PLENARY LECTURES
3
MATH PROBLEM, INTERNET AND DIGITAL MATHEMATICAL PERFORMANCE Marcelo Borba State University of São Paulo, Brazil “If production of knowledge is understood in this way, what constitutes a “problem” will depend on the nature of the humans-with-media collective. A problem that needs to be solved, or that puzzles someone, may not be a problem when a search software tool like Google is available. Similarly, a real problem for collectives of humans-withorality may not constitute a problem for a collective of humans-with-paper-andpencil.” (Borba, 2012, p. 804). In this talk I will unpack the above quote from a recently published paper on ZDM. I will discuss first the way Internet and mobile telephones in particular, and digital technology in general, are changing the nature of what means to be a human being (Castells, 2009; Borba, 2012). In order to do this I will present the notion of production of knowledge that emphasize the role of different technology throughout history (Levy, 1993; Villareal & Borba, 2010). I will briefly discuss how different artifacts such as the blackboard are important for the development of education and how notions such as demonstrations are embedded in media such as paper-and-pencil. I will summarize the four phases of the use of digital technology in mathematics education (Borba, 2012) in order to discuss the notion of digital mathematical performance. I will next discuss a perspective regarding the notion of “problem” in which problem is seen as having an objective and subjective aspect, respectively an obstacle to be overcome and an interest in overcoming such an obstacle. In doing so, I will argue that a problem change depending on the media is available, in other words how different collectives of human-with-media (Borba & Villarreal, 2005) relate to different obstacles, and how they may become a problem or not to such a collective. Having discussing the notions of humans-with-media and problem, I will bring such a discussion to the classroom. I will show how a simple function activity may be a problem for collectives of humans-with-paper-and-pencil, but not for a collective of humans-with-Geogebra. Could calculate a given integral be a problem for some students in the math classroom? I will argue that availability of wolphram alfa is a good starting point for such a discussion. I will show these different examples showing how digital technology has evolved and how it has brought different possibilities of problems and how it has transformed “old problems” in mere “exercises”. Finally I will discuss if we should or should not admit Internet in the classroom (Borba, 2009) and I will show how I am believe Internet can be admitted in the classroom. I will show how video, facebook and regular software can create different possibilities 4
Carreira, S., Amado, N., Jones, K., & Jacinto, H. (Eds.) (2014). Proceedings of the Problem@Web International Conference: Technology, creativity and affect in mathematical problem solving. Faro, Portugal: Universidade do Algarve.
for learning in the regular classroom and on the “online classroom”. In particular I will discuss the notion of digital mathematics performance, showing how it brings together the fourth phase of the use of technology, arts and mathematics. I will argue that Digital mathematics performance “may be the future” of what problem means for a student. Text book problems may be out! Digital Mathematics Performance may be in! Discussion will be stimulated about whether Internet will be admitted in the classroom, or whether the classroom will be dissolved in the Internet. REFERENCES Borba, M.C. (2012). Humans-with-media and continuing education for mathematics teachers in online environments. ZDM Mathematics Education, 6(44) p. 801-814. Borba, M. C. (2009). Potential scenarios for Internet use in the mathematics classroom. ZDM Mathematics Education, 41(4), 453–465. Borba, M. C., & Villarreal, M. E. (2005). Humans-with-media and the reorganization of mathematical thinking: information and communication technologies, modeling, visualization, and experimentation. New York: Springer. Castells, M. (2009). Communicating Power. London: Oxford University Press. Levy, P. (1993.) As Tecnologias da Inteligência: o futuro do pensamento na era da informática. Rio de Janeiro: Editora 34.
5
ROLES OF AESTHETICS AND AFFECT IN MATHEMATICAL PROBLEM SOLVING Norma Presmeg Illinois State University (Professor Emerita), United States of America My goal in this presentation is to tease out some of the significant aspects of both aesthetic sense and affective issues in the solving of non-routine mathematical problems. Both aesthetics and affect are under-researched domains in mathematics teaching and learning (Sinclair, 2004, 2008). Yet there is ample evidence from the personal experience of teachers of mathematics of the motivational effect of an “Aha!” moment experienced by a student in solving a mathematical problem, and of the pleasure that such an experience afforded. And research mathematicians frequently speak of the aesthetic elements involved in their work, for instance of the beauty of an elegant proof (Burton, 2004). Thus it would appear that aesthetic sense is a significant issue in the learning and doing of mathematics, and worthy of further research attention. Especially, as in the case of the non-routine problem solving involved in the Algarve Project, when students are not under compulsion to solve the mathematics problems, what is it that gives them the motivation to do so, and to persist in the face of difficulty in order to reach a solution? I start with a vignette of a high school teacher who was particularly aware of the aesthetic elements of mathematics, and who stressed these in his teaching. This teacher was especially adept at helping his students to make connections in their learning of mathematics, between different topics, but also in linking aesthetic and cognitive processes. After that I address some theoretical formulations of ‘the aesthetic’, taken from both the arts and the sciences, and analyse differences between aesthetics and affect: these are intimately connected, but they are not the same because they function differently in problem solving processes (Sinclair, 2008). And there is evidence that both are also intimately connected to the cognitive domain. For instance, Presmeg and Balderas-Cañas (2001) describe the case of Ms. Blue, an elementary school teacher, whose meta-affect (affect about affect: Goldin, 2000) so paralyzed her thinking that she was not able even to enter the first sense-making stage of solving three non-routine problems presented to a group of graduate students. Continuing with empirical data from the same project, three further cases of nonroutine problem solving are presented, each of which gives evidence of a more productive affective pathway than that of Ms. Blue. In these three cases, despite difficulties, the students were able to persist and arrive at solutions to the problems by various methods. Visual aspects of aesthetic sense are examined. In several cases the patterning aspects of aesthetic sense resulted in metaphoric thinking that had the potential to be fruitful and to overcome some of the affective states, such as discouragement, that threatened to derail the problem solving processes. Some 6
Carreira, S., Amado, N., Jones, K., & Jacinto, H. (Eds.) (2014). Proceedings of the Problem@Web International Conference: Technology, creativity and affect in mathematical problem solving. Faro, Portugal: Universidade do Algarve.
examples of metaphors that were ultimately fruitful are presented, resonating with the work of Carreira (2001) in connection with mathematical models. Connections, patterns, and metaphors are recurring themes in my research that related to affect and to aesthetics. I present a brief vignette from the case of Sam, whose initial compartmentalization prevented him from solving a trigonometric problem involving an angle in the second quadrant; I report his elation when he finally connected the unit circle and the graph of a sine function. Finally in gathering results from further empirical studies, I describe the work of Sinclair (2001) in devising a color-coding calculator whose aim was to encourage free problem solving associated with aesthetic elements, as middle school students worked with fraction patterns in individual interviews. Sinclair’s research was specifically targeted to aesthetic elements, affect, and motivation in the mathematics learning of young students. She identified not only the difficulties associated with research on these “ephemeral” topics, but also their importance, and potential to make a difference in encouraging students to continue with the subject of mathematics. I close with suggestions for further research that might prove fruitful. REFERENCES Burton, L. (2004). Mathematicians as enquirers: Learning about learning mathematics. Dordrecht: Kluwer. Carreira, S. (2001). Where there’s a model, there’s a metaphor: Metaphorical thinking in students’ understanding of a mathematical model. Mathematical Thinking and Learning, 3(4), 261-287. Goldin, G. A. (2000). Affective pathways and representation in mathematical problem solving. Mathematical Thinking and Learning, 2, 209-219. Presmeg, N. C. & Balderas-Cañas, P. E. (2001). Visualization and affect in nonroutine problem solving. Mathematical Thinking and Learning, 3(4), 289-313. Sinclair, N. (2004). The roles of the aesthetic in mathematical inquiry. Mathematical Thinking and Learning, 6(3), 261-284. Sinclair, N. (2008). Aesthetics as a liberating force in mathematics education. ZDM: The International Journal of Mathematics Education, DOI 10.1007/s11858-0080132-x. Accessed 25 January, 2014.
7
THE CURRICULUM, CREATIVITY AND MATHEMATICAL COMPETITIONS Jaime Carvalho e Silva University of Coimbra, Portugal Mathematical Creativity has been discussed first with some detail by Henri Poincaré and Jacques Hadamard at the beginning of the 20th century. The journal “L'Enseignement Mathématique” has published an inquiry in 1902 trying to discern the mathematical work; one of the questions was “Avez-vous cherché à vous rendre compte de la genèse des vérités, découvertes par vous, auxquelles vous attachez le plus le prix?” (Volume 4, p. 209). Nevertheless it was not discussed with much detail until recent years (Leikin, PittaPantazi, 2013). Now it is considered to be very important at different levels. In Korea it is considered to be so relevant that “Creativity and Character building” is one of the main directions of the 2009 national curriculum revision. In this curriculum it is even considered to be important for all the students and not only for some (more gifted or more intelligent): “For all the students, not for the talented only”. Of course this policy faces considerable challenges, namely the assessment tools and the grading methodology that are being modified in Korea to accommodate assessment of creativity. Another issue is teacher preparation and so the Ministry developed model schools and created study groups for creativity/ character education. A formidable challenge. It will be argued that mathematical competitions can be one of the main tools to foster Mathematical Creativity in the school system. For this, the main types of mathematical competitions, its goals and its modus operandi will be reviewed. We will compare classical Mathematical Olympiads with more recent types of competitions like the Mathematical Kangaroo (Kangourou sans frontières) and the Mathematical Contest in Modeling (MCM). We will also discuss and try to classify competitions involving technology, online competitions, competitions made individually or in groups, and different kinds of competitions with mathematical games. We will call for a systematic exploration of different kinds of mathematical competitions in order to develop different aspects of mathematical creativity for different kinds of students in different grades. A competition like the “Math Video Challenge” is designed with the goal of getting students to develop their creativity and communication skills. Can it be classified as a major tool for that, or other types of competitions are close or more efficient at the development of Mathematical Creativity? How may we be able to analyze the different types of competitions from this perspective? 8
Carreira, S., Amado, N., Jones, K., & Jacinto, H. (Eds.) (2014). Proceedings of the Problem@Web International Conference: Technology, creativity and affect in mathematical problem solving. Faro, Portugal: Universidade do Algarve.
REFERENCES Commission Internationale de l'Enseignement Mathématique (1902). Enquête sur la méthode de travail des mathématiciens. L'Enseignement Mathématique, 4, 208-211. Kim, J. S. (2013). The Relevance of Creativity and Innovation: Korean Curriculum Revision Case. CERI/OECD - Educating for Innovation in Asia: Theory, Evidence and Practice. 15-16 January 2013. Singapore. Retrieved from http://www.oecd.org/edu/ceri/02%20Jin%20Sook%20Kim_Korea.pdf. Leikin, R. & Pitta-Pantazi, D. (2013). Creativity and mathematics education: the state of the art. ZDM, 45, 159–166. Sriraman, B. (2004). The characteristics of mathematical creativity. The Mathematics Educator, 14(1), 19–34.
9
MULTIPLE SOLUTION PROBLEMS IN COMPUTERIZED AND NON-COMPUTERIZED ENVIRONMENTS: WHAT DIFFERENCE DOES IT MAKE? Michal Tabach Tel Aviv University, Israel In recent years the mathematical education community’s attention towards creative mathematical thinking has increased considerably. Liljedahl and Sriraman (2006) suggest that creative mathematical thinking for mathematicians is “the ability to produce original work that significantly extends the body of knowledge” or “opens up avenues of new questions for other mathematicians” (p. 18). However in the context of school mathematics, one can hardly expect that a students' contribution will be at that level. Hence, the idea of relative mathematical creativity is more in order. Mathematical creativity in school may be evaluated with respect to students’ previous experiences and performances of their peers (Leikin, 2009). Relativity is also relevant when considering mathematical problems. Schoenfeld (1989) defined a mathematical problem as “a task (a) in which the student is interested and engaged and for which he wishes to obtain a resolution; and (b) for which the student does not have a readily accessible means by which to achieve that resolution” (pp. 87–88). Leikin (2009) claims that an explicit request for solving a problem in multiple ways may be used for eliciting students' creative mathematical thinking and as a mean for evaluate it. Three multiple solution problems were assigned to two fifth grade classes from the same school. One class worked regularly in a technological environment while the other did not. The presentation will relate to methodological questions regarding the evaluation of students' solutions. Researchi findings will be reported and discussed. i
The research was conducted in collaboration with Dr. Esther Levenson and Riki Swisa.
REFERENCES Leikin, R. (2009). Exploring mathematical creativity using multiple solution tasks. In R. Leikin, A. Berman & B. Koichu (Eds.) Creativity in Mathematics and the Education of Gifted Students (pp. 129-35). The Netherlands: Sense Publishers. Liljedahl, P. & Sriraman, B. (2006). Musings on mathematical creativity. For The Learning of Mathematics, 26(1), 20-23. Schoenfeld, A. H. (1989). Teaching mathematical thinking and problem solving. In L. B. Resnick & L. E. Klopher (Eds.), Toward the thinking curriculum: Current cognitive research (pp. 83-103). Alexandria, VA: Association for Supervision and Curriculum Development.
10
Carreira, S., Amado, N., Jones, K., & Jacinto, H. (Eds.) (2014). Proceedings of the Problem@Web International Conference: Technology, creativity and affect in mathematical problem solving. Faro, Portugal: Universidade do Algarve.
PANEL
11
PRESENT AND FUTURE ROLES OF ONLINE MATH COMPETITIONS IN THE EDUCATION OF TWENTY-FIRST CENTURY YOUNG STUDENTS João Pedro da Ponte*, Keith Jones** * Institute of Education, University of Lisbon, Portugal, ** University of Southampton, United Kingdom With this panel, we intend to exchange ideas and hear the perspectives of several people who, in different ways and at some stage, have been connected to the web-based mathematical competitions Sub12 and Sub14, held by the Department of Mathematics, of the Faculty of Sciences and Technology of the University of Algarve. We invite to bring in his/her own personal perspective: a former participant in the competitions because it will allow us to appreciate what such experience meant to his learning of mathematics and the importance it had in his academic and personal life; the mother of a former participant who has followed, for several years, the involvement of his son in the competitions and was beside him at the Finals, in order to knowing her vision with respect to parental involvement in these competitions, comprising the inclusiveness and educational purposes they embrace; a mathematics schoolteacher, who has supported several of her students throughout the various editions of the competitions, inside and outside the classroom, to hear her testimony on the advantages taken from their participation for mathematics learning and how she sees the role of the school in face of those and other beyond-school activities. As an introductory topic, we will offer a possible characterization of the young participants in the competitions, which was based on the results of the implementation of an online survey in 2012, in all schools of the Algarve, targeting students from 5th to 8th grades, whether or not participating in these competitions. Our challenge is to provide a multiple glance over the role of web-based mathematical competitions on the mathematics education of 21st century children and consider future developments of this kind of projects. Invited Members of the Panel: Ana Cristina Bacalhau Coelho, mother of a former participant in the competitions. Bruno Pedrosa, former participant in the competitions, currently graduate student of Medicine. Dora Nunes, Mathematics Teacher at the Group of Schools Padre João Coelho Cabanita, Loulé, Algarve. Eugénia Castela, collaborator of the Problem@Web Project, Faculty of Economy, University of Algarve and CIEO.
12
Carreira, S., Amado, N., Jones, K., & Jacinto, H. (Eds.) (2014). Proceedings of the Problem@Web International Conference: Technology, creativity and affect in mathematical problem solving. Faro, Portugal: Universidade do Algarve.
KEYNOTE ADDRESSES
13
THE USE OF DIGITAL TOOLS IN WEB-BASED MATHEMATICAL COMPETITIONS: DEGREES OF SOPHISTICATION IN PROBLEM SOLVING-AND-EXPRESSING Hélia Jacinto*, Sandra Nobre*, Susana Carreira**, Nélia Amado** * Research Unit of the Institute of Education of the University of Lisbon, Portugal; ** University of Algarve and Research Unit of the Institute of Education of the University of Lisbon, Portugal Reactor: João Filipe Matos, Institute of Education, University of Lisbon, Portugal The technological e-permeated society where we live (Martin & Grudziecki, 2006) has made it possible to enlarge the frontiers of mathematics learning, which once were confined to the classrooms in each school (Gee, 2004; Shaffer, 2006). The immersion in the digital world seems to be changing the way young people perceive and act on the environment that surrounds them (Prensky, 2001; Tapscott, 1998; Veen & Vrakking, 2006). Recently, the research community has recognized the importance of extracurricular activities in which youngster are becoming increasingly involved, demonstrating a growing interest in studying this involvement and its potential benefits, namely by looking at how it may stimulate formal mathematics learning, or by assessing the impact of curricular learning in life beyond the classroom (Barbeau & Taylor, 2009; Jacinto & Carreira, 2012; Wijers, Drijvers Jonkers, 2010). All over the world, several organizations have nurtured the development of students’ problem solving abilities by organizing competitions and tournaments of different kinds. This is the case of the Mathematics Competitions Sub12 and Sub14, promoted by the Department of Mathematics of the Faculty of Sciences and Technology, University of Algarve, addressing students from grades 5 to 8 (10-14 year-olds) in the south of Portugal. A trademark of these two extracurricular competitions is its inclusiveness during the Qualifying as they develop entirely through the Internet and the participation model allows young people with different mathematical abilities to develop their relationship with mathematics and problem solving. To each of the ten problems given, it is required that the participants explain their problem solving process and find ways to express their thinking and their strategies. They may use any of the digital tools they have at their disposal and find useful for solving a given problem. The research we have been developing has uncovered the aptitudes of young competitors to take advantage of everyday digital tools and its representational expressiveness to give form and substance to their own reasoning and the construction of a solution strategy (Carreira, 2012; Jacinto & Carreira, 2013). Another emerging aspect is the perception of the existence of different degrees of robustness of the 14
Carreira, S., Amado, N., Jones, K., & Jacinto, H. (Eds.) (2014). Proceedings of the Problem@Web International Conference: Technology, creativity and affect in mathematical problem solving. Faro, Portugal: Universidade do Algarve.
solutions submitted, mainly in terms of the conceptual models that competitors develop, with a particular technological tool, to solve the problems. Here we will analyse a selection of solutions submitted to two problems, in which competitors resort to Excel, in one case, and to GeoGebra, in the other. We present a proposal for identifying levels of sophistication and robustness of technology-based solutions to the problems, based on an inspection of the characteristics of the tool use and its connection to the conceptual models underlying students’ thinking on the problems. ACKNOWLEDGMENTS This work is supported by national funds through Fundação para a Ciência e Tecnologia, under the project PTDC/CPE-CED/101635/2008 and the research grants SFRH/BD/69917/2010 and SFRH/BD/73363/2010.
REFERENCES Barbeau, E. & Taylor, P. (Eds.). (2009). Challenging Mathematics In and Beyond the Classroom. The 16th ICMI Study. New York, NY: Springer. Carreira, S. (2012). Mathematical problem solving beyond school: digital tools and students mathematical representations. ICME 12, pp. 2933-2942. Seoul: ICMI. Gee, J. (2004). Situated Language and Learning. A critique of traditional schooling. New York, USA: Routledge. Jacinto, H., & Carreira, S. (2012). Problem solving in and beyond the classroom: perspectives and products from participants in a web-based mathematical competition. ICME 12, pp. 2933-2942. Seoul: ICMI. Jacinto, H., & Carreira, S. (2013). Beyond-school mathematical problem solving: a case of students-with-media. In A. Lindmeier, & A. Heinze (Eds.). Proceedings of the 37th Conference of the IGPME, Vol. 3, pp. 105-112. Kiel, Germany: PME. Martin, A., & Grudziecki, J. (2006). DigEuLit: Concepts and Tools for Digital Literacy Development. Innovation in Teaching and Learning in Information and Computer Sciences, 5(4), 249 -267. Prensky, M. (2001). Digital Natives, Digital Immigrants. On the Horizon, 9(5), October, (n/p.). NCB University Press. Shaffer, D. (2006). How computer games help children learn. New York: Palgrave Macmillan. Tapscott, D. (1998). Growing up digital: The rise of the Net generation. New York: McGraw-Hill. Veen, W. & Vrakking, B. (2006). Homo Zappiens: Growing up in a digital age. London: Network Continuum Education. Wijers, M., Jonker, V., & Drijvers, P. (2010). MobileMath: exploring mathematics outside the classroom. ZDM, 42(7), 789–799. 15
HIGHLIGHTING CREATIVITY IN CHILDREN’S BEYONDSCHOOL MATHEMATICAL PROBLEM SOLVING Nuno Amaral*, Susana Carreira** * Escola Básica 2,3 Sophia de Mello Breyner Andresen, Lisbon, Portugal, ** University of Algarve and Research Unit of the Institute of Education, University of Lisbon, Portugal Reactor: Isabel Vale, School of Education, Polytechnic Institute of Viana do Castelo, Portugal Many learning opportunities which are taking place beyond the classroom should in no way be neglected and should instead be seen as a valuable counterpart of the school curriculum and school-based learning (Harrison, 2006). Solving mathematics problems, in particular, is definitely established as an activity that may extend beyond the mathematics classroom and give rise to children’s engagement with mathematics and mathematical thinking. The knowledge and experience gained outside school are expected to extend, diversify and enhance the mathematical knowledge typically retained from school-based learning, while being likely that one boosts the other. The importance of studying students’ problem solving activity outside the classroom, especially when the problems are related to mathematical concepts, is highlighted by several researchers (e.g., English, Lesh & Fennewald, 2008; Barbeau & Taylor, 2009). On the other hand, encouraging and valuing mathematical creativity can be one of the purposes set out in different contexts of mathematical activity, which are not restricted to the classroom (Applebaum & Saul, 2009). Thus, looking at the mathematical creativity involved in solving problems outside the classroom appears as a suitable research avenue. The desire to compete and overcoming challenges is deeply rooted in human nature and has been used for centuries to help people improve their skills and performance in various activities (Kenderov, 2006). Thus, given that the classroom is no more than one of the possible contexts of the educational process, it is important to draw attention to the impact and benefits of competitions related to mathematics education, including those that take place beyond the school. Among many world-wide flourishing projects, the SUB12 Competition promotes mathematical problem solving beyond the classroom. Running in Portugal since the academic year 2005/2006, this web-based mathematical competition addresses students in 5th and 6th grades (10-12 year-olds), aiming to develop their enthusiasm and appreciation for moderate mathematical challenges. The competition problems are in line with a variety of problem solving approaches where students can develop concepts pertaining to diverse areas of school mathematics. This competition offers 16
Carreira, S., Amado, N., Jones, K., & Jacinto, H. (Eds.) (2014). Proceedings of the Problem@Web International Conference: Technology, creativity and affect in mathematical problem solving. Faro, Portugal: Universidade do Algarve.
students the opportunity to think for themselves, to come up with their own strategies and reasoning, as well as to activate knowledge and develop different representations in their search for a solution (Gontijo, 2006). It requires participants to submit and explain the entire process carried out to achieve the solution, including all of the reasoning developed in the clearest possible way. It provides a considerable amount of time, which is sometimes missing in the classroom due to the need to comply with the curriculum and other school work restrictions, thus allowing students to be more creative. Therefore it turns out to be a significant environment for the development of creativity and independent thinking, where students can display their talent and sometimes solve problems in unexpected and innovative ways (Taylor, Gourdeau & Kenderov, 2004). The freedom students have to think mathematically on each problem allows them to discover interesting ways of solving problems, often translated into unusual solutions (Ching, 1997). Within our research project, we seek to detect evidence of mathematical creativity in students’ proposed solutions to the problems posed in the SUB12 competition, partly motivated by the fact that a good number of solutions received within the online competition have been regarded as amazing solutions in light of what is expected of young children’s mathematical background. Thus, the main purpose of our research is to describe and characterise the mathematical creativity in young students’ solutions to mathematics problems, within their participation in the SUB12 competition. To this end, we have been developing and gradually improving a framework of analysis aiming to highlight specific dimensions of mathematical creativity in the ways students solve and express their solutions to mathematical problems. This framework has already been applied to some of our empirical data showing that mathematical creativity in problem solving may take many different shades and revealing that creative solutions mirror the presence of different indicators of creativity (Amaral & Carreira, 2012). In this way, we intend to increase the awareness about mathematical creativity and its relation to the expression of mathematical thinking through problem solving, seeking to identify observable indicators of creative mathematical reasoning (Saundry & Nicol, 2006). At the same time, we want to understand the extent to which online and digital environments like the SUB12 can add to the creativity found in activities such as mathematical problem solving that is in the end relevant to school mathematics. In this talk we will present some of the efforts heading for a way of characterizing students’ creative solutions to mathematical problems, in a competitive situation aiming for inclusiveness and which takes place beyond the classroom. ACKNOWLEDGMENTS This work is supported by national funds through Fundação para a Ciência e Tecnologia, under the project PTDC/CPE-CED/101635/2008.
17
REFERENCES Amaral, N., & Carreira, S. (2012). An essay on students’ creativity in problem solving beyond school – proposing a framework of analysis. In Pre-Proceedings of the International Congress on Mathematical Education (ICME 12) – Topic Study Group 3, Seoul, 8-15 July 2012, (pp. 1584-1593). Apllebaum, M., & Saul, M. (2009). Anecdotes and assertions about creativity in the working mathematics classroom. In R. A. Berman & B. Koichu (Eds.), Creativity in Mathematics and the Education of Gifted Students (pp. 272-284). Rotterdam: Sense Publishers. Barbeau. E. J. & Taylor, P. J. (2009). Preface. In E. J. Barbeau & P. J. Taylor (Eds.), Challenging Mathematics In and Beyond the Classroom. The 16th ICMI Study, (pp. 97-131). NY: Springer. Ching, P. (1997). An experiment to discover mathematical talent in a primary school in Kampong Air. ZDM-International Journal on Mathematics Education, 29(3), 9496. English, L., Lesh, R. & Fennewald, T. (2008). Future directions and perspectives for problem solving research and curriculum development. Paper presented at the 11th International Congress on Mathematical Education (ICME11) – Topic Study Group 19: Research and development in problem solving in mathematics education. Retrieved from http://tsg.icme11.org/document/get/458. Gontijo, C. H. (2006). Estratégias para o desenvolvimento da criatividade em matemática. Linhas Críticas, 12(23), 229-244. Harrison, C. (2006). Postmodern research and e-learning: anatomy and representation. European Educational Research Journal, 5(2), 80-93. Kenderov, P. S. (2006) Competitions and Mathematics Education. In M. Sanz-Solé, J. Soria, J. L. Varona & J. Verdera (Eds), Proceedings of the International Congress of Mathematicians (pp. 1584-1598). Universidade Castilla - La Mancha, Spain. Saundry, C., & Nicol, C. (2006). Drawing as problem-solving: young children’s mathematical reasoning through pictures. In J. N. H. Moraová, M. Krátká & N. Stehlíková (Eds.), Proceedings of the 30th Conference of the International Group for the Psychology of Mathematics Education (Volume 5, pp. 57-63). Prague, Czech Republic. Taylor, P., Gourdeau, F., & Kenderov, P. (2004). The role of mathematical competitions in mathematics education. In M. Niss (Ed.), Proceedings of the 10th International Congress on Mathematical Education (pp. 495-497). Roskild University, Denmark.
18
THE AFFECTIVE RELATIONSHIP OF YOUNGSTERS AND PARENTS WITH MATHEMATICS AND PROBLEM SOLVING IN INCLUSIVE MATHEMATICAL COMPETITIONS Nélia Amado*, Susana Carreira*, Eugénia Castela**, Rosa Antónia Ferreira*** * University of Algarve and Research Unit of the Institute of Education, University of Lisbon, Portugal, ** University of Algarve and CIEO, Portugal, *** University of Porto and CMUP, Portugal Reactor: Guida de Abreu, Oxford Brookes University, United Kingdom The school and, in particular, the classroom, were for many decades the main place for learning. The information and communication technologies and specially the advent of the Internet gave rise to new forms of learning and, as such, research in mathematics education is facing new challenges. In recent years, new places for learning, beyond the classroom, have emerged (Kenderov, Rejali, Bussi, Pandelieva, Richter, Maschietto, Kadijevich & Taylor, 2009), sparking young people’s interest and the attention of researchers. In Portugal, the interest for mathematics learning beyond the school is still recent; however, internationally, this topic has received particular attention from several organizations affiliated to the International Commission on Mathematics Instruction. This and other activities aim to give students the opportunity to get in touch with exciting mathematics, seeking to motivate them to learn this subject or giving them the chance to learn more mathematics. The increasing participation of young students in mathematics competitions, mathematics clubs, mathematics days, summer schools and other similar events (Kenderov et al., 2009) should not be regarded as a sign of weakness of the classroom; rather, it should be seen as additional opportunities for new and diverse learning, which may contribute to improving students’ school achievement. Following the previous Keynote Addresses, we will focus on affective issues involved in the Mathematical Competitions Sub12 and Sub14. These competitions, which have an inclusive character, are centred on solving challenging mathematical problems (Turner & Meyer, 2004). National and international studies (e.g., Kenderov et al, 2009; Wedege & Skott, 2007, Jacinto & Carreira, 2011) have suggested that these activities, taking place beyond the classroom, can promote a positive relationship of students with problem solving and, furthermore, an affective connection of youngsters and their families with mathematics (e.g., Carreira, Ferreira & Amado, 2013). Adopting a five-dimension perspective on affect – beliefs, attitudes, emotions, values, and feelings (Selden, McKee, & Selden, 2010) – we will intentionally focus on the beliefs, attitudes and emotions in the context of the aforementioned inclusive competitions, from the point of view of young participants and of their families. The Carreira, S., Amado, N., Jones, K., & Jacinto, H. (Eds.) (2014). Proceedings of the Problem@Web International Conference: Technology, creativity and affect in mathematical problem solving. Faro, Portugal: Universidade do Algarve.
19
results are supported by data collected through a questionnaire administered at the end of the 2011/2012 edition of the Sub12 and Sub14 competitions to the students of the Algarve region which participated in those competitions. Data were also collected through several semi-structured interviews to the participants and their families. At some points we will draw on the content of exchanged emails with the participants along the competitions to illustrate occasional affective aspects expressed by them. Data analysis has suggested that the inclusive character of the competitions relates to the affective dimensions involved in the youngsters’ participation, as well as a significant influence on their adherence to mathematics and problem solving. The empirical data show that the participants involved in these mathematical competitions are not necessarily gifted students. In fact, a considerable number of participants may be considered average-ability students. We believe that the high level of participation of youngsters in this type of beyond school mathematics activities is also a result of the freedom that characterizes Sub12 and Sub14; such freedom is threefold: participants have a considerable amount of time to solve each problem; participants are free to choose whatever approach they prefer to solve each problem; participants are left the choice of resources, namely technological resources, to solve and express their problem solutions. Our research results further indicate that the participants recognize two different kinds of mathematics, a school mathematics and a beyond school mathematics. In addition, the data reveal that participating in those competitions promotes a positive view regarding mathematics and problem solving, leading also to an improvement of mathematics learning in school. Finally, we will address how the students’ participation in these mathematics competitions spread out to their families, arousing and involving several emotions and unveiling beliefs about mathematics. ACKNOWLEDGMENTS This work is supported by national funds through Fundação para a Ciência e Tecnologia, under the projects PTDC/CPE-CED/101635/2008 and PEst-C/MAT/UI0144/2013, and by FEDER funds through COMPETE.
REFERENCES Amado, N. & Carreira, S. (2013). O contributo da participação numa competição matemática para a aprendizagem de um aluno com necessidades educativas especiais: o caso de Rui. In J. Fernandes, M. H. Martinho, J. Tinoco & F. Viseu (Orgs). Atas do XXIV Seminário de Investigação em Educação Matemática (pp. 529542). Braga: APM & CIE, Universidade do Minho
20
Carreira, S., Ferreira, R., & Amado, N. (2013). Young students solving challenging mathematical problems in an inclusive competition: enjoyment vis-à-vis helpseeking. In B. Ubuz, Ç. Haser & M. A. Mariotti (Eds.) Proceedings of the Eight Congress of the European Society for Research in Mathematics Education (pp. 1289-1298). Ankara, Turkey. ISBN 978-975-429-315-9. Jacinto, H. & Carreira, J. (2011). Nativos digitais em atividade de resolução de problemas de matemática. Conferência Online de Informática Educacional. Lisboa, UCP. Retrieved from http://www.coied.com/2011/actividades/ artigos/tema1/. Kenderov, P., Rejali, A., Bussi, M. G., Pandelieva, V., Richter, K., Maschietto, M., Kadijevich, D., & Taylor, P. (2009). Challenges beyond the Classroom – Sources and organizational issues. In E. J. Barbeau & P. Taylor (Eds.), Challenging Mathematics In and Beyond the Classroom: The 16th ICMI Study (pp. 53-96). New York, NY: Springer. Selden, A., McKee, K., & Selden, J. (2010). Affect, behavioural schemas and the proving process. International Journal of Mathematical Education in Science and Technology, 41(2), 199–215. doi:10.1080/00207390903388656. Turner, J., & Meyer, D. (2004). A Classroom Perspective on the Principle of Moderate Challenge in Mathematics. Journal of Educational Research, 97(6), 311-318. Wedege, T., & Skott, J. (2007). Potential for change of views in the mathematics classroom? In D. Pitta-Pantazi & G. Philippou (Eds.), Proceedings of the Fifth Congress of the European Society for Research in Mathematics Education (pp. 389398). Larnaca, Cyprus. Retrieved from http://ermeweb.free.fr/ CERME5b/.
21
RESEARCH PAPERS
22
DIGITAL STORYTELLING FOR IMPROVING MATHEMATICAL LITERACY Giovannina Albano, Anna Pierri Dipartimento di Ingegneria Elettrica, Ingegneria dell’Informazione e Matematica Applicata – University of Salerno, Italy
[email protected];
[email protected] This paper focuses on the use of digital storytelling in order to improve students’ capabilities be active solvers of real world problems. We present a storytelling model which takes into account both research results for storytelling in pedagogical research and for story problems in mathematics education research, posing them in the PISA framework in mathematics. At the end of the theoretical presentation of the model, a case of use is presented, which is going to be delivered to 13-15 year-old students in the schools of Campania (south of Italy). INTRODUCTION In this paper we present the work of an ongoing project, called “Obiettivo 500”, funded by the Regional School Office of Campania in the South of Italy. The project is devoted to 13-15 year-old students and aims at improving their mathematical literacy (in the sense of PISA) and thus at helping them be successful at the next PISA 2015. The project works in blended mode, that is some teaching/learning activities are going to be performed in face-to-face setting, and other ones are going to exploit new technology features and potentialities in distance setting. Our work is posed in the latter strand. Following the PISA framework in mathematics, which views the student as an active problem solver in front of a challenge in real world, our work focuses on the exploitation of digital storytelling in mathematics education to improve the student’s capabilities to face and solve such challenge. To this aim we have defined a storytelling design model which takes into account both pedagogical and mathematics education research results and PISA framework. At the end, a case of use of our model is presented, which is being implemented and it is foreseen to be delivered to the students at the end of next March. THEORETICAL BACKGROUND Mathematical competencies in the PISA framework The core of the PISA 2015 mathematics framework is the definition of mathematical literacy, which comes out from a fundamental actual requirement: what does a citizen need in order to face daily situations involving mathematics? The answer consists in an individual’s capacity to formulate, employ, and interpret mathematics in a variety of contexts. It includes reasoning mathematically and using mathematical concepts, procedures, facts and tools to describe, explain and predict phenomena. It assists individuals Carreira, S., Amado, N., Jones, K., & Jacinto, H. (Eds.) (2014). Proceedings of the Problem@Web International Conference: Technology, creativity and affect in mathematical problem solving. Faro, Portugal: Universidade do Algarve.
23
to recognize the role that mathematics plays in the world and to make the well-founded judgments and decisions needed by constructive, engaged and reflective citizens (OECD, 2013, p. 5).
Thus the student is viewed as an active problem solver. This definition puts emphasis on the need of developing the students’ capability of using mathematics in context, but this requires to plan lessons rich of experiences able to engage the students in reaching such abilities. Moreover, it is well-experienced that students are much more motivated when they have the chance to see the applications of mathematics to out-of-school contexts. The above definition highlights from the beginning the main mathematical processes needed to individuals in order to connect the context of a problem with mathematics, making them able to solve the problem. Let us see in more details: - Formulate situations mathematically, that is the ability of translating a problem from the real world to the domain of mathematics, then giving the problem a mathematical structure and representation; - Employ mathematical concepts, facts, procedures and reasoning, that is the ability of performing mathematical procedures in order to have outcomes and to find mathematical solutions to the problems; - Interpret, applying and evaluating mathematical outcomes, that is the ability of thinking on mathematical solutions, outcomes or conclusions, and of interpreting them in the context of real-world problems, evaluating the meaningfulness and the reasonableness with respect to the context of the problem. PISA experiences have shown that there is a set of fundamental mathematical capabilities underpinning the described processes in practice. Literature shows the various examples of recognition of such general mathematical capabilities (OECD 2013, p. 12). The PISA framework referred, until now, to Niss work (2003), using what Niss called competencies. The PISA 2015 framework refers to Turner work (2012), which condenses the number of the competencies from eight to seven: communication, mathematizing, representation, reasoning and argument, devising strategies for solving problems, using symbolic, formal and technical language and operations, using mathematical tools. For each of the previous fundamental mathematical capabilities, six levels of proficiency can be devised, according to the observation that increasing activation of fundamental mathematical capabilities is associated with increasing level of mastering of mathematical literacy by an individual (Turner & Adams, 2012). Narrative and logical-scientific thinking in story problems Bruner (1986) distinguishes two (complementary, even if irreducible) thoughts: the logico-scientific one, which “attempts to fulfil the ideal of a formal, mathematical system of description and explanation”, and the narrative one, which “leads to good stories, gripping drama, believable (though not necessarily “true”) historical accounts [and] deals in human or human-like intention and actions and the vicissitudes and consequences that mark their courses” (pp. 11-13). 24
Story are not popular in mathematics classrooms; most mathematics classroom instruction consists of short explanations by the teacher followed by a series of examples that students then imitate in their own work. Even when a problem solving is involved it is seldom accompanied by a story (Zazkis & Liljedahl, 2008). The main stages in problem solving are the representation (understanding the problem) and the solution. With this respect, there will be information relevant to representation, called by Zan (2011) narratively relevant, and information relevant to the solution, that is to answer the question, called by Zan (2011) logical relevant. The benefit of bringing storytelling into a mathematics classroom is the capability to introduce or explain hard concepts in a memorable fashion and involve students in mathematical activity. Thus a story problem could be conceived as a mathematical problem which has been contextualised in concrete and realistic situations, familiar to the student with respect to her life experience. Then the representation stage should recall the student’s encyclopaedic knowledge which should be the basis of the solution stage. Teachers’ experiences show that often students fails in story problems and it seems that the story does not help them, as expected. Zan distinguishes the failure in the two previous stages: in the first one, the student puts herself in the “mathematics context”, thus she does not give any attention to the story and just searches for “numerical/mathematical” data; in the second one, the student looses herself in the story and then does not activate logical-scientific thought. The key point faced by Zan is then how narrative thinking can support, through the process of representation of the story, the logical thinking in the solution process. Zan’s hypothesis is that it is important that information needed for the representation be consistent from the logical point of view, in particular consistent with the posed question (Zan, 2011, p. 8).
Based on this assumption, Zan (2012) proposes a Context and Question (C&D) model for the construction/formulation of the text of a story problem, which consists in the following requirements:
There is a story: there is a situation evolving along time, and there is at least an animated actor;
There is a natural link between the story and the posed question: there is an actor having a goal, which is not immediately reached, and the mathematical problem naturally arises from the context (i.e. it is not artificially introduced);
The story is well-structured: the various parts of the text are linked from the narrative standpoint and the information and details have sense in the narrative context;
The solution is consistent with the goal: the answer to the considered question is necessary for the character to achieve his goal.
25
THE METHODOLOGY In this section we illustrate the methodology considered for creating digital storytelling addressing mathematical capabilities starting from real world contexts. So, in the first subsection the design of the Storytelling Model is presented; the second subsection contains the adaptation of the Storytelling Model to the PISA mathematics framework. The Storytelling Design Model The Storytelling Design Model (SDM) is based on the notion of Visual Portrait of Story (VPS) defined by Raymond & Ohler (2008). The VPS represents a time-diagrammatic view of the most emotionally important moments of a narrative, which are summarized in the following list:
Elements of a beginning (call to adventure). The story begins by moving out of the flat, ordinary events of life to new heights of experience. For instance, information that ground the listener in the ordinary life of a character or group of characters is presented. A hero or main character is called to adventure in which the ordinary routine of life is interrupted. A quest of some kind is described or begun. The listener understands that the main character, perhaps with help from others, needs to accomplish something or to go somewhere.
Elements of a middle (conflict, consisting of problem/solution, tension/resolution). The full extent of the tension, problem or conflict is made apparent. The tension is increased through the use of situations that beg for some kind of resolution. We can have a series of such situations in which the characters, through failure, persistence and personal growth, finally achieve a goal.
Transformation (middle, continued). The key to transformation is that the central character (or group) cannot solve the problem of the story easily or simply; she/he needs to change in order to do it. If the central character does not undergo some sort of transformation on the way to solving the problem, then the listeners are dissatisfied, often cheated upon their listening experience. For instance, the main character needs to be transformed in order to solve the problem or achieve resolution. She/he needs to become stronger, smarter, wiser, more mature or some combination of these.
Elements of an end (closure). Stories need to have the endings that allow the listeners to feel as though their personal investment in listening has not been in vain. For instance, stories can finish in an obvious way, such as stating what has been learned in the form of a moral or personal revelation. Conversely, stories can move forward with some action that clearly shows what learners have internalized.
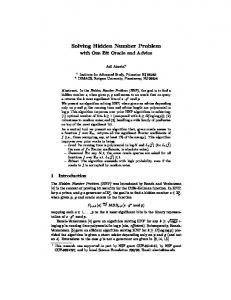
Figure 1 illustrates the phases of the VPS correlating them to the tension degree during the story (Raymond & Ohler, 2008).
26
Figure 1. Phases and tension function of the Visual Portrait of Story.
There are two tension picks. The first one is related to the time when the problem raises. The second one is related to the moment when the problem is solved. In the process of traversing the path from problem to solution, the student learns, grows and becomes a new person in some significant respect. VPS is an approach to flash out the story core with story details guiding the development of story-based didactic resources. The defined SDM exploits the concept of transformation formations, i.e. the transformation of characters. The characters can undergo different kinds of transformation. The literature (Ohler, 2006) identifies eight levels of transformations in a story map: Physical/kinesthetic, Inner Strength, Emotional, Moral, Intellectual, Psychological, Social and Spiritual. The levels are not mutually exclusive, therefore the characters often transform themselves at more than one level at the same time. The Storytelling Design Model aims to fill the lacks of existing storytelling models by providing ways of:
empowering pedagogical drivers during the storytelling definition phase, in order to connect storytelling situations and events and achieve specific levels of educational goals;
exploring branching logic in order to design micro-adaptivity mechanisms by using indications coming from data recovered from implicit assessment to define remedial paths tailored to meet the learner’s learning progress;
enhancing the character-based approach by defining role playing, taking and making strategies in order to support telling, re-telling and re-living;
supporting cognitive transformations by exploiting collaborative and social learning activities in order to maximize role making strategy.
This methodology has already experimented in other context (as in the ALICE1 European Project). Through the combination of guided, objectives oriented and adaptive process the methodology contributes to improve learning of the students that have a predisposition to the experiential learning by demonstrating, in such a way, as this didactic method is suitable to the transmission of lesson learned. 27
The methodology takes into account different hypothesis of validation needed for experimenting the use of the storytelling learning resource. They concern the following analysis:
The use of Storytelling Learning Objects (SLOs) contributes to improve students’ motivation and emotional status.
The use of SLOs contributes to support instructors’ task.
The use of SLOs contributes to increase students’ activity levels, both in individual and collaborative activities.
The use of SLOs contribute to improve students ‘understanding of key concepts as well as related skills.
The Mapping between the SDM and PISA’s levels The proposed model considers the intellectual transformations as changes in terms of learning goals. At this level of transformation, the learners (who lead the characters) are asked to use intellectual-creative abilities in order to solve a problem. In particular, the SDM proposes an extension to the association between Bloom’s Taxonomy (Bloom, 1956) and character transformations in order to map each transformation with a specific phase of the VPS. In Table 1 a mapping among VSP situations, Bloom’s learning goals and characters’ transformations has been presented. In particular, Bloom’s hierarchy of transformation, identifies a taxonomy of intellectual changes in terms of six different levels of learning goals, that are considered in increasing order of difficulty, from basic to higher levels of critical thinking skills (Mangione, Orciuoli, Pierri, Ritrovato, Rosciano, 2011). Table 1. Mapping among VPS situations, learning goals and character transformations. VPS Situations
Bloom’s Learning Objectives
Type of Transformation
Beginning The call to adventure
Knowledge
Character knows, remembers or describes something
Comprehension
Character explains, interprets, predicts something.
Problem
Application
Middle
Analysis
Solution
Synthesis
Closure
Evaluation
28
Character discovers, constructs or changes something; applies understanding to a new situation. Character deconstructs a situation, distinguishes among options, plans or organizes something, compares and contrasts different things. Character pieces together parts to form a new understanding of a situation. Character assesses a situation, critiques and/or defends an idea (or a person,…) and evaluates a situation in order to respond to it.
Each VPS situation includes the following event:
advancer event, that is designed to activate the prior knowledge of the student and ensure their initial involvement in the situation;
learning event, that supports the learner’s understanding of topic goal and it is based on a guided approach;
reflection event, that is designed to help the learner to reflect on learned concepts and to allow them to consolidate the acquired knowledge;
assessment event, that submits to learners a test (with respect to the specific VPS situation in which the learner is involved) for evaluating the type of transformation occurred.
An assessment event presents a selection of assessment modes through the arrangement of different types of tests and items with different levels of interactivity and complexity in order to detect different learners’ abilities during the storytelling path. For instance, true/false questions are useful to acquire mnemonic knowledge elements, multiplechoice questions can be exploited to evaluate the ability of understanding, problems to solve are needed to evaluate the ability to apply resolving procedures, matching questions should be used to evaluate the ability of the learner to identify and separate elements of knowledge, to highlight relationships that bind them and the general organizational principles and laws. Starting from the Bloom’s taxonomy, we have associated to each Learning Objectives, a specific Competence’s Level, that corresponds to the acquisition of skill or attitude in the mathematics context (OECD, 2013, p.27): - at level 1, students are able to work in familiar context and to manage direct and clear information and questions, and they can realize procedures of direct instructions; - at level 2, students are able to work in context requiring no more than one direct inference, to manage only one representations and they can perform elementary procedure and direct interpretation of outcomes; - at level 3, students are able to apply simple strategies, manage more than one source of information and make some reasoning, and they can edit brief reports of the results, reasoning, interpretations; - at level 4, students starting to be able to manage complex concrete situations, coordinating more representation and having flexibility and capability of discovering in contexts already known; - at level 5, students are able to model complex situations and to identify assumptions and constraints, they can develop advanced strategies and manage adequately more source of information and representations, and they can reflect on their actions and communicate their thinking;
29
- at level 6, students are able to conceptualize, generalize and use information based on his own analysis, to coordinate various sources of information and representation, they can perform advanced mathematical thinking and reasoning. Each competence’s level can be associated to each SDM phase starting from the association of Level 1 to the first SDM’s phase “Ordinary life” until Level 6 associated to the final phase “Life resumes…”. The right associations is obtained taking into account the skills necessary to acquire the considered level. So, considering the mapping between the Bloom’s Learning Objects and the VPS situations (Mangione, Orciuoli, Pierri, Ritrovato, Rosciano, 2011; Mangione, Capuano, Orciuoli, Ritrovato, 2013), we state the following associations shown in the following figure. Level 3
Level 4
Level 2 Level 5 Level 1
Level 6
Figure 2. Competences’ level with respect to the Storytelling’ phases
THE CASE OF USE The project “Obiettivo 500” aims to promote and enhance the fundamental mathematical capabilities using a storytelling based approach. The use of advanced digital contents in the form of “stories” encourages the involvement and the student's attention, thanks to overcoming the technological generation gap, and thus becomes an instrument “effective” through which transforming “complex knowledge” and encourage significant and profound understanding. In the following a first use case is going to be described. The design of the story moved according to the C&D model of Zan (2012). So we designed a story evolving along the time, whose main character is a student, who has an explicit goal. The problem naturally arises from the goal and the goal can be reached by solving the problem. As Duval (2006) pointed out, mathematical activities are characterized by the massive use of multiple representations and the conceptualization is strictly linked to the ability of handling at least two different representations of the same object moving from one to another at any time. This is the so-called coordination of the representations which is the core of the comprehension. Duval states that such coordination is not spontaneous 30
but it requires teaching/learning activities aimed to foster the students to systematically explore and observe the possible variations of a representation within a given system of representation and among various systems. This is why storytelling seems to be a good methodology to improve students’ ability. The learning goal The case of study is focused on one of the fundamental mathematical capabilities, the “representation”. From PISA 2015 the representation is so defined: this mathematical capability is called on at the lowest level with the need to directly handle a given familiar representation, for example going directly from text to numbers, or reading a value directly from a graph or table. More cognitively demanding representation tasks call for the selection and interpretation of one standard or familiar representation in relation to a situation, and at a higher level of demand still when they require translating between or using two or more different representations together in relation to a situation, including modifying a representation; or when the demand is to devise a straightforward representation of a situation. Higher level cognitive demand is marked by the need to understand and use a non-standard representation that requires substantial decoding and interpretation; to devise a representation that captures the key aspects of a complex situation; or to compare or evaluate different representations (OECD, 2013, p. 31).
Considering the three mathematical processes, shown in the Section 1, we can adapt them to the representation’s capability (OECD, 2013, p.15). More in depth we intend the mathematical processes as follow:
Formulate: the student is able to create a mathematical representation of real-world information;
Employ: the student is able to articulate a solution, show the work involved in reaching a solution and/or summarise and present intermediate mathematical results;
Interpret: the student is able to construct and communicate explanations and arguments in the context of the problem.
The story We suppose that a student is involved in a stage having for objective the acquisition of the journalist’s title. Considering the mapping in the Figure 4, we detail the storytelling’s phases for our context. Situation 1: Ordinary life In this situation, the student demonstrates a basic knowledge of the different types of charts examined. During the advancer event he attends a presentation of the course in “Graphical Representations” and takes part in a scenario where two journalists are working in the interpretation of graphs prediction of election results by communicating the wrong messages to the general public causing the derision of larger parties and the 31
illusion among smaller ones. During the learning event, the focus is the understanding of the existence of various types of diagrams and the importance of knowing, for example, to quickly switch from text to numbers, or usefulness of reading a value directly from a graph or table. The reflection event serves as organizer of the key concepts to remember. Finally, the assessment event presents the student with a first round of evaluation in order to help people understand the levels of knowledge input. Situation 2: The call to the adventure In this situation, the student demonstrates ability to understanding/reading considered graphs in a specific context. The advancer event presents to the student the opportunity to take part in an important service to be carried out in conjunction of the regional elections. In particular, a special communication, referred to aberrant communications, must be built for substituting these with real information that journalists promote on the basis of interpretations of data and graphical representations not properly modeled and interpreted. The student, during the learning event, must follow the point of view of the protagonist and understand how to read charts considered in a specific context of the specific newspaper and reproduce the correct message to the hypothetical viewer. The reflection event shows to the student the newspapers inefficiency to convey the correct information to the readers, highlighting the inadequacy of graphics selected for the scope or the misinterpretation made by journalists to communicate specific information which turn to be well away from the actual results. Finally, the interpretation of multiple charts semi-structured and guided (to complete a text with multiple distractors) characterizes the assessment event. Situation 3: The problem In this situation, the student must demonstrate ability to use representations based on information from different sources. The advancer event involves the student in writing an essay on a survey done on the parliamentary elections. The student accesses to four examples of situations in which, during the learning event, we show how to solve a problem by using representations from different sources. The student interacts with these scenes simulated and select the most suitable explanation. The reflection event proposes a trailers on the actions he performed during learning with a focus on the erroneous explanations. Finally the assessment event ask students to consider specific types of graphs (such as scatter plot or bubble) to represent the details necessary for the preparation of the test and then asked to complete a written text unstructured. Situation 4: The solution In this situation, the student must demonstrate the ability to compare and evaluate the information. Once done with practical problems, the advancer event asks the student to evaluate three audio video interviews of the three candidates of the majority parties. Each candidate exhibits from his point of view, what are the updated data of the campaign. The student, during the learning event, learns the translation mode of a situation in two or more different representations.
32
Situation 5: Closure The student must demonstrate the ability to reflect and communicate their interpretations of the data. The event draws attention to the student's introduction to the three major political bloggers on the interview and on the graphs represent the views of individual parties with respect to the performance of the voting. The assessment event asks the student to carry out an essay / piece of journalism. The student must use some words in free text by inserting them in a certain order. Visual feedback that shows only the logical accuracy of communication is associated with a qualitative judgment. Situation 6: “Life resumes….” In this final phase, the student is expected to demonstrate through a summative test their newly acquired skills for the analysis of graphical representations proposing new situations, that as a journalist may find that they need to manage. In the advancer event the student is asked to undergo a final test in order to be included in the official lists of employees and possibly be called to work for the realization of particular pieces of journalism. In the assessment event, the final test for journalistic qualification must demonstrate that they have acquired during the internship period the ability to connect different forms of information and representations passing from one to another in a flexible manner. As we can observe, some situations are not completely described in the specific (see from Situation 4 to Situation 6), since the development of the storyboard is and ongoing activity. CONCLUSIONS AND FUTURE WORKS In this paper we have presented an ongoing work, which focuses on the exploitation of digital storytelling for improving mathematical literacy. A new model is presented, which takes into account pedagogical features of storytelling and mathematics education research concerning story problems and fundamental mathematical capabilities. Based on such model, a first storytelling is being implemented, focused on the representation skill, and it is foreseen to be delivered to the students at the end of next March. This first delivery will help to test and adjust the model, since further implementations of storytelling are planned in the framework of the project “Obiettivo 500” in order to cover all the seven fundamental mathematical capabilities. NOTES 1. http://www.aliceproject.eu/.
REFERENCES Bloom, B. S., & Krathwohl, D. R. (1956). Taxonomy of Educational Objectives: The Classification of Educational Goals, by a committee of college and university examiners, Handbook I: Cognitive Domain. New York: Longmans Green. 33
Bruner, J. (1986). Actual minds, possible worlds. Cambridge: Harvard University Press. Duval, R. (2006). The Cognitive Analysis of Problems of Comprehension in the Learning of Mathematics. Educational Studies in Mathematics, 61(1), 103-131. Mangione, G. R., Orciuoli, F., Pierri, A., Ritrovato, P., & Rosciano, M. (2011). A new model for storytelling complex learning objects. International Workshop on Adaptive Learning via Interactive, Collaborative and Emotional Approaches, in conjunction with the Third International Conference on Intelligent Networking and Collaborative Systems (pp. 836-841). Fukuoka: IEEE. Mangione, G. R., Capuano, N., Orciuoli, F., & Ritrovato, P. (2013). Disaster Education: a narrative-based approach to support learning, motivation and students’ engagement. Journal of e-Learning and Knowledge Society, 9(2), 129-152. Niss, M. (2003). Mathematical competencies and the learning of mathematics: The Danish KOM project. In A. Gagatsis, & S. Papastavridis (eds.): 3rd Mediterranean Conference on Mathematical Education (pp. 116-124). Athen: Hellenic Mathematical Society. OECD (2013). PISA 2015 Draft Mathematics Framework. OECD. Retrieved from http://www.oecd.org/pisa/pisaproducts/Draft%20PISA%202015%20Mathematics %20Framework%20.pdf. Ohler, J. (2006). The world of digital storytelling. Educational leadership, 63(4), 4447. Ohler, J. & Raymond S. (2008). Digital Storytelling in the Classroom: New Media Pathways to Literacy, Learning, and Creativity. Computers and Composition, 25 (4), 449–452. Turner, R. (2012). Some drivers of test item difficulty in Mathematics. Annual Meeting of the American Educational Research Association. Vancouver: AERA. Retrieved from http://research.acer.edu.au/pisa/4/. Zan, R. (2012). La dimensione narrativa di un problema: il modello C&D per l’analisi e la (ri)formulazione del testo. L’insegnamento della matematica e delle scienze integrate. 35 A. Zan, R. (2011). The crucial role of narrative thought in understanding story problems. In K. Kislenko (ed.) Current State of Research on Mathematical Beliefs. XVI Proceedings of MAVI-16 conference, pp. 287-305. Tallin, Estonia: Tallinn University, Institute of Mathematics and Natural Sciences. Zazkis, R., & Liljedahl, P. (2008). Teaching mathematics as storytelling. Thousand Oaks, CA: Sage Publications.
34
USING STATISTICAL SOFTWARE IN BASIC EDUCATION: DIFFICULTIES AND AFFORDANCES Cláudia Fernandes*, João Pedro da Ponte** * Agrupamento de Escolas Manuel Teixeira Gomes, Portimão; ** Instituto de Educação, Universidade de Lisboa
[email protected],
[email protected] The aim of this study is to analyze the benefits and problems associated to the use of statistical software TinkerPlots in grade 7 and its consequences to teachers’ practice. The research methodology is qualitative and interpretative, with a teaching experiment design and data collected from video recorded classes and interviews. The results show that there are (i) benefits in using this tool in statistics teaching, given its possibilities for the manipulation of graphics, stimulating students’ conceptual understanding, (ii) difficulties in students’ work, both in using the software and in interpreting statistical concepts and representations; and (iii) difficulties in the teacher’s professional practice, in managing the class in a new situation and in issues related to knowledge of content and of the software. INTRODUCTION Technology is a very versatile resource for the classroom work. The use of statistical educational software allows dealing with sets of data of any size, quickly and efficiently, leaving time for exploratory data analysis and discussion so necessary for understanding concepts and progressing in learning. The development of technology yielded a new way of teaching statistics, focusing attention in concepts and not on computations (Martins & Ponte, 2010). This is clearly a resource that motivates students for classroom work and fosters their involvement in the proposed tasks. Teachers need to know to take advantage of this possibility. The software TinkerPlots allows exploratory work in statistics in an easy and intuitive way. This paper aims to analyze the problems associated to the use of this software, as well as the affordances that it may provide in the framework of a teaching experiment with grade 7 students. USE OF TECHNOLOGY IN THE TEACHING OF STATISTICS Several reasons may lead a teacher to consider the use of technology in statistics classes: (i) facility in representing and manipulating data; (ii) possibility to give emphasis in the understanding of concepts instead of focusing attention in computational procedures; (iii) possibility to undertake exploratory and investigation tasks, promoting its discussion in the classroom; (iv) possibility of using these tasks to promote awareness of the role of statistics in society associated to the development of statistical thinking; and (v) students’ motivation for this kind of work.
Carreira, S., Amado, N., Jones, K., & Jacinto, H. (Eds.) (2014). Proceedings of the Problem@Web International Conference: Technology, creativity and affect in mathematical problem solving. Faro, Portugal: Universidade do Algarve.
35
In the statistics class, technology may be regarded as a tool to be used by teacher and students, in different ways. Two of them are of high interest for this study – the construction of graphs and computing statistics and using simulations. The quick elaboration of graphs and the efficiency in obtaining statistics allows using more time for interpreting situations and solving problems. Pratt, Davies and Connor (2011) indicate that the work with simulations, based on mathematical models, allows students to develop a vision of what the reality may be providing them the experience of working with distributions. Martins and Ponte (2010) consider that using simulations based on technological resources a valuable process for getting a sense for statistical concepts and to understand variability, a key idea in statistics. The power of using this kind of software lies in creating graphs or simulations and is related to the possibility of making a dynamical control of data, especially in the case of distributions with many elements. Such distributions may be quickly handled using these tools, providing students the opportunity to explore cases using different representations (Lee & Hollebrands, 2011; Rubin & Hammerman, 2006). The visualization of graphical representations using statistical software allows a detailed exploration of data, leading to the creation of different representations and different questions and conjectures, as well as to different interpretations. As Rubin and Hammerman (2006) indicate, regardless of the available tools, data analysis requires contrasting distributions and patterns presented by variables. They argue that TinkerPlots may support students to represent and explicit their reasoning and these representations may be then used to support group discussions. The use of technological resources allows the classroom activity to focus on students, with the teacher assuming the role of promoting and leading learning situations. As students’ autonomous work goes on, the teacher needs to monitor what is going on, which is a rather complex task. Exploratory work may lead students to follow strategies and find results that the teacher did not foresee and this requires a solid knowledge of statistics as well as of the software. Likewise, the diversity of the situations that may emerge during whole class discussions requires the teacher the capacity to conduct them. During discussions, the teacher selects the students’ mathematical ideas to present, sequences students’ interventions and facilitates communication asking students to expose these ideas (Stein, Engle, Smith, & Hughes, 2008). Also for Connor, Davies and Holmes (2006), solving exploratory tasks in groups and then participating in whole class discussions sharing experiences and negotiating meanings is a way of work that supports students’ learning. Rubin and Hammerman (2006) highlight that teachers need to understand the key value of interactions among the tools used, the underlying culture, and the mathematics argumentation in the classroom. In their view, that is fundamental so that students relate classroom discussions to contextual knowledge ascribing meaning to the task. Ponte, Mata-Pereira and Quaresma (2013) present a model of analysis of whole class discussions focusing on the teacher’s actions. In this model, inviting actions provide the initial involvement of students in a discussion. In supporting/guiding actions the 36
teacher promotes students’ continued participation in solving a problem, leading them in a discrete or explicit way through questions or other interventions. In informing/ suggesting actions the teacher provides information or validates students’ responses, thus assuming the primary responsibility for the mathematical discourse. In challenging actions the teacher leads the students to think, explain of justify their responses. In addition, other teachers’ actions are mostly geared to the management of learning. There are many pedagogical aspects that influence the management of communication, particularly with regard to the initiation and maintenance of mathematical discussions as a normal class activity. In addition, the use of technology is another factor to consider in managing the classroom environment. METHODOLOGY This study was conducted in 2012/13 in a grade 7 class of a public school at the Algarve. The class includes 24 students (13 boys and 11 girls) aged between 12 and 14, which, in general, show difficulties, little autonomy, and lack of working habits, preferring to work individually rather than in groups. The tasks proposed in the statistics teaching unit were exploratory and were solved using TinkerPlots. These tasks followed the curriculum guidelines and sought to take into account the interests of students and their prior learning. As such, they focused on the study of some of the students’ characteristics, with data collected by them. Each task included a script for the use of the software since this was the first time that the students were manipulating this tool. Based on the different situations proposed and using the software, the students should make conjectures and come to their own conclusions. This software is appropriate to their age level, allowing for very easy and intuitive graphical representations of data in various ways. At the same time it allows to find values of measures of location and dispersion, enabling students to obtain these representations rather than knowing how to compute, so that they have the opportunity to interpret the meanings of these measures in the contexts described. The teacher played the role of a guide, leaving room for students to progress at their own pace. Each task was introduced by the teacher, through a short presentation, followed by class time devoted to autonomous work which varied depending on the degree of complexity of the task. As foreseen in the lesson plan, the students worked in pairs or groups of three, each group having access to a computer with TinkerPlots. For each task, there was also a whole-class discussion, then a final synthesis. The communication process was based on sharing ideas, and the teacher’s role was to help students, leading them to learn mainly by reflective activity. The explanatory function was shared by teacher and students. The statistics unit had six lessons that were videotaped and students’ written records were collated. The teaching experiment included the realization of six tasks. The first tasks aimed primarily at familiarizing students with the software, especially the graphical representation of different chart types and obtaining absolute and relative frequencies. This initial phase of the experiment proceeded without major difficulties. In this paper 37
we analyze what occurred in the final tasks that had a higher degree of complexity. In each episode we highlight the potential use of this software in the classroom and the difficulties found in terms of students' work and on the teacher’s professional practice. We also strive to show the decisions taken by the teacher in the face of unforeseen situations. TASK 5 This task was intended to provide students an opportunity to work with location and dispersion measures using the variable age of students in the class in months. Since, at this stage, students had already a reasonable mastery in manipulating this software, the teacher guided them to work autonomously from the beginning of the task. 1. Starting with the birth dates of the different students in this class, we calculate the age of each student in months and organize the information in a table. This indicates age in months and the absolute frequency for each age, as you had the chance to check. a) Based on the data in the table, draw a dot plot that represents information correctly. b) Compute the mean and median age of the group (in months). c) What is the age of the oldest student? And of the youngest? d) Compute the amplitude of ages in the class. e) Construct, using Tinker Plots, a box plot that represents this data set. Prepare a short text that explains this graphical representation. Task 5: “I’m younger than you!” The students built the intended dot plot quickly and organized the information. They called the teacher, while she circulated among the tables, asking her to confirm their work: Ricardo:
Teacher, is this correct?
Teacher:
It’s correct. (...) So tell me, what is the most common age in the class?
Ricardo:
Here it is! There are three. (The student correctly interpreted the graph after arranging the points properly using the control buttons)
Figure 1. Task 5 - Solution.
38
In this episode, the teacher validated the student’s answer, indicating that he was correct. She also guided the continuation of the work raising a question to focus the student’s attention in interpreting the chart. The student lived up to the expectation and read the graph correctly answering the teacher’s questions. Then, the teacher guided the students to continue working on the concepts of mean and median, interpreting them in the context of the situation. As the students used the button to get the mean, the teacher further guided their work asking: Teacher:
And now what happened?
Ricardo:
A triangle appeared here ... It is showing a value here...
By asking this question the teacher wanted to see if the students identified the change on the graph with the introduction of a new symbol that located the mean and its value so that they could continue working. Her objective was achieved because the question helped the students to focus their attention and to identify the changes depicted on the graph. As the students found the values of the location measures, the groups interacted with each other, trying to confirm the values that they got. At this stage, some problems emerged, such as the students’ difficulty in the graphical interpretation of the values of the mean and the median or the different results found by different groups, because of several mistakes: Mariana:
Teacher! What is the result?
Teacher:
(Approaching) What you are computing? Do you have the average?
Mariana:
This is the average. Here is our result! The median is not... Isn’t like theirs… They have that number...
Teacher:
(Approaches the other group) Show me! Oh! It is because you selected only a small part of the points and then you computed the mean and the median only for that part instead of computing for all of the data.
Sometimes the students seemed to feel the need to carry out computations instead of interpreting the values that they had got. The teacher, without undermining the importance of numerical computation, insisted on the interpretation, and later exemplified the computation: Jorge:
Teacher, this is just to indicate the mean and the median? What about the computations?
Teacher:
The TinkerPlots already computed. Now I’d like you to tell me how it computed it. (...) Tell me, what was the value of the mean and the median?
Students:
The median is 157 and the mean is 158.6.
Teacher:
(Notes in the black board). This appeared in TinkerPlots. It’s convenient and quick, but if you didn’t have the software, how would you do this? (...) How can we obtain the mean through a table with data organized? For example, if 39
we wanted to know the mean of the tests of each of you, how would you do to mean? Carlos:
We sum all the tests and then divide by the number of tests.
Teacher:
So, how does TinkerPlots get the mean age in months?
Mariana:
It added everything and divided by the number of...
Ricardo:
Students.
In this episode the predominant form of teacher action is supporting/guiding. She noted that the students just read the values on the graph. Aiming to recall and reinforce students’ concept of mean, the teacher draw on a sample known to students so that they establish a connection between ideas. This strategy successful and the students managed to show understanding of the notion of mean. The last question referred to the construction of a box plot. The students were building this diagram for the first time and the teacher, once again, emphasized the importance of interpreting in the final discussion of the task. In the following episode we identify a negotiation of meanings as the teacher throws in the discussion an unknown terminology (box with whiskers) with the intention of focusing on the shape of the diagram. The students, based on the notion that the “whiskers” are usually symmetric, made this observation and the teacher took the opportunity to inform/suggest that this asymmetry is due to how the data is distributed: Teacher:
You did the box plot using TinkerPlots. It looks like a box with whiskers doesn’t it?
Ricardo:
Whiskers?
Teacher:
If you look at the diagram…. It has some tips…
Ricardo:
(Noticing that the graph is not equally distributed) Yes, only the whisker is poorly done. One side is longer than the other.
Teacher:
Because the data are not distributed in the same way.
Once end values and quartiles were identified and their graphical interpretation was made, the teacher addressed the notion of distribution. She asked for the interpretation of the diagram but noted some difficulties in students. In consequence, she decided to guide students focusing their attention on the division into quartiles: Teacher:
Where do you think there is a greater concentration of data? (...) It is... between quartile 1 and quartile 2, or between quartile 2 and quartile 3...?
Carlos and Ricardo: Between quartile 1 and quartile 2.
40
Teacher:
Why?
Carlos:
Because that’s where there’s more.
Teacher:
More what?
Mariana:
Dots.
The support given by the teacher was effective because the students were able to identify the parts of the diagram where the data were more concentrated and to justify their choice. The use of TinkerPlots in this task was beneficial, not only for finding quickly and efficiency the graphics and the location and dispersion measures, but also to address the notion of statistical distribution. The students themselves compared the points in the graph and the boxplot to understand how the data was distributed. Later, they made other conclusions regarding the specific context of the class.
Figure 2. Solution of task 5 regarding measures of location and dispersion.
TASK 6 This task aimed at working the notion of probability in an intuitive way, based on the notion of relative frequency. The task was a simulation and took 50 minutes to do. The variable under attention was the favorite flavor of ice cream of the students in the class. The task proposed the following simulation scenario: 1. Each of the students of our class responds to an inquiry about what ice cream flavor was preferred among five possible flavors: Strawberry (S), Chocolate (CH), Vanilla (V), Cream (CR), and Lemon (L). On a very hot day all students in the class decided to go to Vilamoura’s marina to have ice cream. Each student asked their favorite flavor. Mr. Ramos, the owner of the ice cream store, greeted them cheerfully, and made them an offer: - Good afternoon! Our store is celebrating today its 10th anniversary and, because of that, the ice creams are on the house, provided the consumer accepted playing a little game that we are proposing. Do you accept? The students all agreed and Mr. Ramos continued: - So, each of you asks an ice cream cone with your favorite flavor and goes out for a walk in the marina with the ice cream in one hand and five cards on the other hand. Each of the cards has the letters of each of the ice cream flavors (S, CH, V, CR, or L). When you find the first person, you must ask him or her to choose one of the cards. If the person hit the taste of the ice cream that you have in your hand you should offer this person your ice cream, otherwise you can eat it: (As it is impossible to perform this experiment in real life, we use the Tinker Plots and simulate this situation to realize what could happen). 2. Based on the simulation carried out, answer the following questions: a) How many students lost their ice cream? b) What percentage of students lost his ice cream after playing? c) What was the most chosen flavor ice cream on the cards?
41
Task 6. “Who eats icecream?” The students were confused with the results of the simulation. The teacher decided to encourage a whole class discussion, beginning with a question that challenged them to interpret the results. The teacher undertook this action because the students were following the statement of the task and carrying out the simulation, but were not interpreting the results as she expected. Teacher:
What happened?
Mariana:
(...) The numbers of students appeared in face of the flavors of ice cream.
Teacher:
(...) So what happened? It appeared a new table?
Diva:
With our tastes?...
André:
No! I did not choose this!
Roberto:
Teacher ... I think it’s what other people have chosen...
Teacher:
That’s it! Roberto is right. That's right. So let’s see what happened to each of you. Who ate the ice cream and who does not eat ice cream?
By challenging students to interpret what happened, the teacher initiated a discussion that led them to interpret the results. After reaching this goal the teacher validated the students’ findings, stating that they were correct and supporting/guiding them to the next stage. Following the directions given in the statement, the students created a table showing the column of their choices alongside the column of choices that the simulation generated for each student. Some conclusions began immediately emerging, and the teacher validated some opinions in order to encourage the students to pursue: Teacher:
Daniela is saying “I ate”... Why Daniela?
Daniela:
Because the computer is saying “strawberry” but I chose vanilla.
Teacher:
Because Daniela’s computer says that the person who spoke to Daniela chose strawberry and she chose vanilla.
Each group conducted a simulation on a different computer and found a different set of results due to the randomness of the experience. The teacher did not inform the students on purpose and let them to try to understand the situation. As this stage, she adopted predominantly supporting/guiding and informing/suggesting actions as the students showed to be somewhat confused by the disparity in results between the different groups:
42
Ricardo:
But here, she chose lemon and the lady she spoke chose... Cream.
Teacher:
You chose what Daniela?
Daniela:
I chose vanilla!
Barbara:
Here was strawberry!
Carlos:
And here it was vanilla.
Teacher:
Look, vanilla! Then Daniela did not eat ice cream!
Daniela:
So? I ate or did not eat?
Elix:
No. Here is “C” Chocolate.
Teacher:
So the person who Daniela found, in Elix’s computer, chose chocolate... What happened then?
André:
They are different options.
Mariana:
This is a simulation.
Realizing that the students were reasoning in the intended direction the teacher changed her strategy, assuming a challenging position, trying to lead students to figure out the meaning of simulation. So she launched a simple question urging students to continue autonomously: Teacher:
And... ?
Carlos:
You may have various situations.
Mariana:
(...) If it were another time, we could find someone else who chose something else.
The goal of the teacher was achieved. Using an informal language the students expressed the notion of simulation. The teacher then informed them of the validity of their conclusions: Teacher:
What is happening is that this computer is a simulation... It is random (...) So, getting different results is normal.
Afterwards, the students created a column in the table where they compared the results for each student obtaining the information for who would have eaten or offered the ice cream, by introducing a formula. Given the greater complexity of the task, some minor difficulties arose due to mistakes made in the introduction and interpretation of the formulas, as the students were not familiar with these processes. As the table setting out the comparison was achieved, the teacher posed again a challenging question, requesting an interpretation of results: Teacher:
What’s up?
Mariana:
Look, teacher! Almost everyone eats!
The teacher took advantage of the observation made by the student and returned to challenge students with a new question. The intention of the teacher was to get students to go further in the exploration, comparison and interpretation of results: Teacher:
Almost everyone eats. Why is that?
Beatriz:
Oh, only numbers 19 and 21 have to give the ice cream.
Elix:
Here it isn’t like that! 43
Mariana:
Here there are four people who give the ice cream.
Teacher:
How many people give their ice cream?
Mariana:
Four... three in their group.
Jorge:
I count two.
In response to this challenge from the teacher, the students made comparisons between the results obtained in the different groups, fulfilling the goal of the teacher. The contextualized nature of the task helped the students’ interpretation, since they were able to associate the results to a real situation. The teacher bypassed the problem of the diversity of results found in the simulation in a whole class discussion where the students shared their results and finally came to their own conclusions. The last questions of the task did not provide difficulties for the students that always answered them using the software while the teacher circulated through the classroom. CONCLUSION This research shows some benefits for statistics teaching in using the software TinkerPlots in the classroom as well as some difficulties regarding students’ work, both in using the software and in interpreting statistical concepts and representations. It was observed that students were quite autonomous in handling the software, especially in constructing graphical representations – even in the case of new representations as the boxplot. As in the studies by Lee and Hollebrands (2011) and Rubin and Hammerman (2006), it was possible to confirm that the possibility of finding quickly the sought representations allowed channeling most of class time to the interpretation of results, encouraging students’ conceptual understanding. However, after constructing the graphical representation, they revealed uneasiness in interpreting the results and many of them called the teacher to confirm and validate their work or to inquire about how to interpret the representations. The effectiveness of the software in determining the mean and the median (measures that students already had studied in previous years) allowed the teacher to recall these concepts without substantial use of class time. Using values and examples from everyday life, the teacher managed to effectively recall these concepts. In task 5, the possibility of simultaneous visualization of the dot plot and the boxplot was useful to promote the students’ understanding of the concept of distribution, supporting Rubin and Hammerman (2006) as they argue that the software’s representations may be used as a basis for group discussions. Given the difficulties shown by some students, the teacher chose to support/guide them focusing their attention on comparing the concentration of points with the boxplot, which proved to be a successful strategy. In task 6, the use of the software enabled a quick simulation of the situation (which otherwise would hardly be done in a timely way). Our study shows that the use of TinkerPlots allowed the teacher to challenge the students to go beyond what is indicated in the curriculum, starting from what they already knew and establishing
44
connections with their knowledge in a contextualized situation as advocated by Martins and Ponte (2010) and Pratt, Davies and Connor (2011). The students felt the need to perform calculations, as reported in an episode in task 5. In contrast to their usual routine, in this task there were no computation procedures to carry out and this created a noticeable insecurity in the students. That is, the fact that the software quickly provides the values of the statistical measures led the students to think that they should do something more. They did not seek to interpret the values provided by the software, but simply accepted them almost without questioning. In this situation the teacher decided to conduct a whole class discussion, leading the students to realize the significance of the localization measures, and also to exemplify their calculation. She stressed the need for the interpretation of the concept as a basis to calculate it in a given situation. To promote students’ conceptual understanding, the teacher supported and guided the students through focused questions. The fact that students worked in groups spurred some difficulties that resulted from the interaction within each group and among groups. For example, in task 5 the students compared results with those of neighboring groups, realized that some values were wrong, and requested the teacher assistance. The disparity in results of task 6 observed in different computers also provided some difficulty to interpret what was going on. In this case, the teacher helped the students to overcome this difficulty posing challenging questions that encouraged them to exploit the situation and to relate ideas and concepts. The teacher thus managed a whole class discussion in which she challenged each group to present its results to interpret the situation, as suggested by Connor, Davies, and Holmes (2006). Moreover, as Stein et al. (2008) advocate, the ideas selected for whole class discussion were previously selected in the monitoring phase of work to make the discussion as productive as possible. By analyzing the teachers’ actions in this context, following the model proposed by Ponte, Mata-Pereira and Quaresma, (2013) we observe that in both tasks the teacher chose to interim informing/suggesting, supporting/guiding, and challenging actions. However, in task 5 challenging actions were scarce. The teacher undertook supporting/guiding actions especially when the students requested the validation of the results obtained using the software and that they were not able to read. This happened especially as the teacher felt the need to conduct the students’ work to help them to make progress. This action was supported by questions to the students so that they would continue to reason on their own. Informing/suggesting was not much frequent and arose especially in situations where the teacher, monitoring the students’ work, was asked to validate arguments already made by students. Challenging actions were found especially in task 6 where the teacher invited the students to explore ideas and to conjecture about the proposed situation, opting to confirm or refute these conjectures in the whole group discussion, with the help of the software. Such questions led the students to understand the concept of simulation by sharing ideas and to make connections between the underlying concepts.
45
We note that the use of the software had a very significant role. The ease in obtaining representations allowed the teacher to rely on their use as a support to discussions in small groups and in whole class. The use of this tool in the teaching of statistics allowed the teacher to focus attention on concepts rather than on procedures and to manage her actions in bringing the students to work as autonomously as possible. REFERENCES Bishop, A., & Goffree, F. (1986). Classroom organization and dynamics. In B. Christiansen, A. G. Howson & M, Otte (Eds), Perspectives on mathematics education (pp. 309–365). Dordrecht: D. Reidel. Boaler, J. (2003). Studying and capturing the complexity of practice: The case of the ‘dance of agency’. In N. Pateman, B. J. Dougherty, & J. T. Zilliox (Eds.), Proceedings of PME International Conference (Vol. 1, pp. 3-16). Honolulu, Hawaii. Connor, D., Davies, N., & Holmes, P. (2006). Using real data and technology to develop statistical thinking. In G. F. Burrill & P. C. Elliot (Eds.), Thinking and reasoning with data and chance (pp. 185-195). Reston, VA: NCTM. Franke, M. L., Kazemi, E., & Battey, D. (2007). Understanding teaching and classroom practice in mathematics. In F. Lester (Ed.), Second handbook of mathematics teaching and learning (pp. 225-256). Greenwich, CT: Information Age. Lee, H. S., & Hollebrands, K. F. (2011). Characterizing and developing teachers' knowledge for teaching statistics with technology. In C. Batanero, G. Burrill & C. Reading (Eds.), Teaching statistics in school mathematics: Challenges for teaching and teacher education. NewYork, NY: Springer. Martins, M. E. G., & Ponte, J. P. (2010). Organização e tratamento de dados. Lisboa: DGIDC. McCrone, S. S. (2005). The development of mathematical discussions: an investigation in a fifth-grade classroom. Mathematical Thinking and Learning, 7(2), 111-133. Ponte, J. P., Mata-Pereira, J., & Quaresma, M. (2013). Ações do professor na condução de discussões matemáticas. Quadrante, 22(2), 55-81. Pratt, D., Davies, N., & Connor, D. (2011).The role of technology in teaching and learning statistics. In C. Batanero, G. Burrill & C. Reading (Eds.), Teaching statistics in school mathematics: Challenges for teaching and teacher education (pp. 97-107). NewYork, NY: Springer. Rubin, A., & Hammerman, J. K. (2006).Understanding data through new software representations. In G. F. Burrill & P. C. Elliot (Eds.), Thinking and reasoning with data and chance (pp. 241-256). Reston, VA: NCTM. Stein, M. K., Engle, R. A., Smith, M., & Hughes, E. K. (2008). Orchestrating productive mathematical discussions: Five practices for helping teachers move beyond show and tell. Mathematical Thinking and Learning, 10, 31.
46
CORRELATION BETWEEN DIFFERENT LEARNING STYLES AND THE USE OF WIKI IN LEARNING Nashwa Ismail, Julie-Ann Edwards, Gary Kinchin University of Southampton
[email protected],
[email protected],
[email protected] This paper is investigating the relationship between the learners’ Learning Styles (LS): Visual, auditory and kinaesthetic (VAK), and their use of wiki in learning. It highlights the question: How can tutors suit individual learners’ preferences according to their LS while using wiki? The benefit of this paper will be for both teachers and students. For students, it may help them to identify their LS in a way that is well-suited when using wiki. This may maximize the benefits that students can gain from using social network in learning. For teachers, this correlation is expected to give them guidance of the students’ preferences and abilities with online learning (OL) when using wiki. Therefore, they can select the tool that suits each learner and increases their engagement and communication when using wiki. INTRODUCTION (CURRENT SITUATION) According to Richmond and Cummings (2005) since online instructors usually do not engage with students in a face-to-face learning environment, they may be more concerned with the mechanics of course delivery than with the individual concerns of students. Due to the increasingly heavy demand for online distance education courses, there is now an urgent need and responsibility to accurately assess the quality and effectiveness of OL design. Further, there is a need to conduct inquiries regarding the effect of OL delivery on learner outcomes (Moore, 2013). Therefore, it is increasingly important to identify student LS and adapt online course design to accommodate these styles. Social network shows a promising trend in the use of learning. Wiki, specifically, is one of the main applications that has been used in social network. Maddux, Ewing-Taylor, and Johnson (2002) have suggested that considering the relevance of student LS, with regard to design, the instructional methods can ensure the quality of online course design and positive student outcomes. One approach that holds promise for accomplishing this goal is Kolb’s (1984) Experiential Learning Theory (ELT), which is illustrated in the following diagram (figure 1).
Carreira, S., Amado, N., Jones, K., & Jacinto, H. (Eds.) (2014). Proceedings of the Problem@Web International Conference: Technology, creativity and affect in mathematical problem solving. Faro, Portugal: Universidade do Algarve.
47
Figure 1. Model of learning styles (Kolb, 1984).
To explain the previous diagram the following bullet points highlight Kolb’s terminology in LS: • Divergent students: look at things from different perspectives. • Assimilating students: require good clear explanation rather than practical opportunity. These students are looking for a concise and logical approach. Ideas and concepts are more important than working alongside others. • Converging students: solve problems and use their learning to find solutions to practical issues. They prefer technical tasks more than watching them being done. • Accommodating students: use other people's analysis, and prefer to take a practical and experiential approach rather than carry out their own analysis. With regard to figure 1, a student with a dominant LS of ‘doing’ rather than ‘watching’ the lesson, and ‘feeling’ rather than ‘thinking’ about the experience, will have a LS which combines and represents those processes. Kolb (1984) named these processes ‘accommodating’. In summary, Kolb’s LS are the combination of two lines of axis (continuums), each formed between what Kolb called ‘dialectically related modes’ of ‘grasping experience’ (‘doing’ or ‘watching’), and ‘transforming experience’ (‘feeling’ or ‘thinking’). Numerous studies have investigated the impact of LS in learning (Terry, 2001), for educators in public schools (Lemire, 2002), and pre-service student teachers (Raschick, Maypole, & Day, 1998). Recently, Yoshitaka (2010) investigated the impact of LS on the development of learning-skill in higher education, Moreover, Manktelow and Carlson (2013) confirmed that in learning when tutors have information about learner’s preference, they can make the most of their learning potential. Regarding OL, very little research has been focused on the relevance of LS in online courses in higher education (Jurus, Ramos & Castañeda 2008). Another perspective by Shih and Hung (2007) that for the implementation of LS in online learning, learners have to own their dedicated flexible profile. This profile is capable of dynamically 48
changing as the learners develops and learns. In light of the relationship between LS and the satisfaction of online students, Simpson and Du (2004) found that LS correlated with students’ perceptions of class enjoyment. Students with the converging style reported the greatest amount of enjoyment followed by those with diverging, accommodating, and assimilating styles. From the author’s point of view, although the research on LS and distance education is sparse, few findings identified a relationship between LS and course enjoyment (Simpson & Du, 2004). This provided some support for the consideration of LS in online course design. Further, Simpson and Du did not analyse the distribution of LS, to explain the enjoyment of each LS, related to a specific activity that was presented in the course. For example, they did not analyse data that may have highlighted the convergent student’s acceptance with watching YouTube videos in OL. Moreover, it could be beneficial to add the academic benefit of this analysis and its reflection on the students’ final grade. In light of the importance of LS, James and Gardner (1995) recommend that teachers assess students and adapt their classroom methods to best fit each student's learning style. Therefore, there are many leaning modalities, each model is based on how students perceive information. Examples of these models such as: Visual, Auditory, and Kinaesthetic (VAK), VARK model Fleming split the Visual dimension (the V in VAK) into two parts - symbolic as Visual (V) and text as Read/write (R). This created a fourth mode, Read/write and brought about the word VARK for a new concept, a learning-preferences approach, a questionnaire and support materials. Moreover, there is the VACT model ("T" breaks out Tactile or touch from Kinaesthetic).For Fleming (2001) both the VARK and the VACT add a fourth mode and category to the mix of the VAK’s three style categories. In this paper, VAK model is the model that is used. The reason behind this selection is according to the studied online course via the wiki, students are given activities that are based on the three sensory modes — Visual (seeing and reading), Auditory, and Kinaesthetic (movement and tactile or touch) — to determine three preferred learning-style categories. Conversely, researchers such as Stahl (2002) and Schank (1995) criticised VAK as learning is a complex and integrated process that could be placed in jeopardy by the practice of LS. Stahl’s (1995) criticism was that if students’ LS are assessed and matched to instructional methods, then matching has no effect on improving their learning. Moreover, Schank (1995) believed that teachers confused their students’ learning by classifying them according to their LS. Schank quite simply thought that LS do not exist. For both of these researchers, the main concern was that if LS were identified, then teacher’s instructional method will be specifically directed to these LS. The teacher may then only focus on a student’s activity that supports and develops these skills. This may lead to marginalizing other potential skills that can exist within a student. Reid’s (1995) one of the proponents who supports the importance of investigating students’ LS as they have a direct impact on students’ acceptance to learn. Table 1 demonstrates) classification of LS, regarding students’ acceptance to learn: 49
Table 1. Classification of Learning Styles (Reid, 1995). Used LS (visual, auditory and kinaesthetic)
Facilitating learning and learner’s acceptance
Major: related activities are used in this LS
Preferred
Minor: related activities are not highly considered
Learning can still function with little struggle
Negligible: related activities are not used
Can learn, but more difficult
The previous table explains the impact of disregarding students’ LS or not knowing it. According to Fleming (2001) this may lead to students’ frustration. For example, if students are given activities that are considered to be one of the minor or negligible activities, according to the table students may struggle to learn. Therefore, that leads to their disengagement, frustration or may opt out the whole course. From the author’ point of view, regarding OL, in this environment there is more flexibility and freedom for the learner to view and select all sorts of activities. Nonetheless, identifying these LS for teachers will help them to provide the associated activities and tasks for these LS. For students, knowing their LS could help them to select the activities that suit their abilities and skills. Meanwhile, all other activities are open to be selected and experimented. In summary, This paper is trying to give an answer that explain how can tutors suit individual learners’ preferences according to their LS while using wiki. In details, this paper is trying to associate between the learners’ Learning Styles (LS): Visual, auditory and kinaesthetic (VAK), and their use of wiki in learning. Moreover, to find out if these learning styles are positively or negatively correlated with their learning preference. VAK MODEL The following section will explain in detail the VAK model of LS, that was created by Fleming (2001) and based on Kolb’s (1984) previous model (figure 1). The author has implemented this model as a way to identify the LS of the learners who will be participating in this paper. As according to Sheppard (2013), learners have different strengths, weaknesses, skills and interests. Therefore, they have individual attributes related to their learning and how they perceive the information. In details, some learners rely on visual presentations such as images, these individuals are known as visual learners. Others prefer spoken language and these people are known as auditory learners, while others prefer hands-on activities and are known as kinaesthetic learners. It is important to know the LS of learners in order to make a correlation between how students learn and how teachers teach (Reid, 1995). Disregarding this information or not knowing it may lead to students’ frustration (Fleming, 2001), as learners may be given a certain piece of information while not given the tool that facilitates its understanding. Felder (1995) added that the lack of understanding of students’ LS may 50
impact on learner in two ways; academically, as there may be a reduction in students’ acceptance of the subject being studied, and behaviourally, as students’ may become aggressive or introverted in class. The author is therefore of the opinion that with OL it is more important to identify learners’ LS, in order to engage them with learning. According to Moore (2013) online learners easily get disengaged, demotivated and may opt out the course. Fleming developed one of the most popular models used to identify learning styles (Fleming, 2001). In this model learners are classified into three main styles. Visual learners, who get information through their visual sense. These learners prefer charts, maps, graphs, data, images and photographs. Auditory learners, who learn best through the hearing sense (Gaven, 2012). These learners are those who are using tones and rhymes in explaining and storytelling. According to Materna (2007), to increase the benefits of learning for auditory learners, they listen first to the information and then they can read it. Therefore, recording lectures and YouTube video are suggested to be appropriate tools for their learning. Finally, kinaesthetic learners, who process information through interacting with the space around them, they make models or roleplay in order to physically be involved in learning (Gaven, 2012). Therefore, these learners can be encouraged to learn though creating maps and flashcards to enforce concepts. According to Materna (2007) kinaesthetic learners are more independent learners than learners of other LS, as they adopt self-study strategies that they personally create to help them with learning. From the author’s point of view, with regard to Materna’s claim (2007), OL in general may suit kinaesthetic learner and enable them to achieve reasonable results, as according to Moore (2013) OL is more independent and student-led environment. The following section will highlight the use of wiki in learning, as it is the used social network application that the learners have joined to study this course and to identify their LS. WIKI AS A SOCIAL NETWORK APPLICATION IN LEARNING Web 2.0 technologies allow website visitors to make contributions and changes to existing web content, and to interact with other members of those websites. They are also designed to facilitate and stimulate collaboration and sharing of information and ideas (Oradini & Saunders, 2008). Therefore, social network is one of the main features in Web 2.0. In this paper, the researcher has selected wiki as a Web 2.0 social network application, to deliver the course in online mode. The evidence of the successful use of wiki has been identified in many areas, such as in the storing of online books. In addition, companies like System Applications and Products (SAP), Motorola, or British Telecommunications utilize wiki as a corporate intranet (Ebersbach, Glaser, Heigl & Warta, 2008). In educational institutions like universities wikis are widely used, for example Blackboard which allows students to collaboratively design and implement websites as part of class content. Blackboard can perform these tasks from separate locations, at any time (Emory University, 2013). 51
The following section will highlight some basics for the use of wiki. According to Mader (2008a), wiki is a website that allows the easy creation and editing of any number of interlinked web pages, via a web browser. The first wiki was invented by Leuf and Cunningham in the 1990s (Leuf and Cunningham, 2001). Its content is fast and uncomplicated for end users as it is based on capturing and sharing content between all users. In addition, for teachers it is successful in monitoring complex tasks, tracking memos, creating plans and providing a powerful resource of knowledge. Wiki also extends page length, as most have no page limit, unlike other mail servers which have restrictions on the number of web pages. Lindsay (2009) explained more extended features of wiki, such as: the ability to embed multimedia into a wiki, e.g. videos, Really Simple Syndication (RSS), images, etc. History tab to show all edits on the page. Ebersbach et al. (2008). Versioning system: to save the history of each page and re-establishing previous changes if needed (Mader, 2008b). Change alerts: this allows wiki administrators to be notified, monitor and track any changes on any page (Chatfield, 2009). In general, educators can harness wiki in diverse applications, such as implying course content, organizing schedules, attaching related files and following up students‟ brainstorms”. This helps to identify any possible obstacles in the students’ learning as early as possible, alleviate actual assessment and facilitate the collaborative brainstorming of ideas. These features provide wiki with the flexibility to be applied in many fields and different activities. From the author’s point of view, wiki provides a collaboration of knowledge, where each user can take part in creating and sharing information. This concept is in line with Vygotsky’s notion (1978) where each person can learn if they join knowledge communities. All of the aforementioned features mean that wiki is to be highly recommended for closed communities, such as schools and colleges. METHODOLOGY This is a quantitative study, 30 students at a learning academy enrolled in a 6 month vocational IT course. This course qualifies them with National Vocational Qualification (NVQ) certificate. Students were studying in a blended mode, where they were attending the class once a week, while the rest of the study was dependent upon OL. Students were communicating and collaborating with each other and their teacher via wiki as a social space. This private wiki was created for this class only. This wiki is provided with different learning tools range between audio and video recording, games and readable text files. Each tool is created to support different learning styles. These tools, expressed in the graphs as students’ preferences, were selected based on LeFever (2011) LS classification that matches the instructional style to the individual learning. To collect empirical data, a semi-structured questionnaire was distributed to all participants. The types of questions used in the questionnaires vary between rating scales (from 1-10), intensity-scaled questions (including categories such as ‘excellent’, ‘very good’, ‘good’, ‘fair’, and ‘poor’), as well as a few open-ended questions to enable 52
the respondents to write free responses in their own terms. According to Cohen et al. (2007) open-ended questions help gathering a combination of qualitative and quantitative data. The semi-structured questionnaire was designed to address the following questions: Main research question: How can tutors suit individual learners’ preferences according to their LS while using wiki? and subordinate research question: What are the students’ preference in online learning media such as: audio, video, text or games and simulations? Beside the questionnaire, students had two assessments: • Students’ LS assessment at the beginning of the course. Participants completed an LS assessment to describe their learning preference. It’s worth mentioning that, there are many VAK tests to assess learners’ preferences. The author has used this specific test as it is designed by (Neuro Linguistic Programming) NLP experts, who rely on the sensory representation preference to assess the VAK style of learners (Ellerton, 2010). •
Students’ final course assessment to evaluate their knowledge about the course content. The reason for using these grades that they help the researcher to provide feedback on the students’ learning and to give an indicator that the used tool(s)(audio-video-text…) for each individual fulfil his/her preferences and helps to achieve their academic success.
In summary, the researcher followed the following approach in collecting data: identifying LS (VAK Test)
Students’ final grade
Questionnaire
Figure 2. Research approach.
DATA
Percentage of request
(1)What does the visual, auditory and kinaesthetic learner request while learning online? 40 20 0
5 5 5 More youtube video
14 4 3 hands on exercise
2 5 More Pdf
8 2 4 More Games and simulations
Kinaesthetic Auditory Visual
Students' preferernces
Figure 3. Correlation between LS and students’ preferences in OL.
53
Figure 3 shows statistical significance with the request of YouTube videos from learners in all LS. Hands on exercises are an important need for kinaesthetic learners, while reading files such as PDFs are more requested by visual learners. (2) How does each learner perceive wiki as an online social learning application? 3 2 Number of Students
Auditory Visual
1
kinaesthetic 0 10
20
30
40
50
60
70
80
90
100
Grades in Percentage
Figure 4. Correlation between LS and the percentage that social network helped students to study their course.
Figure 4 shows statistical significance that the use of wiki helped students in studying with the following ratios: kinaesthetic learners (average 70%), visual learners (average 25%) and auditory learners (average 20%). (3) What is the final academic grade for each learner after studying the course online? 100 90 80 70 60 Grade 50 40 30 20 10 0
97
79 77 69
89 79 77
91 88
86
97 91 Kinaesthetic
69 54
Auditory
54
Visual
1
2
3
4
Number of students
5
6
Figure 5. The correlation between LS and the student’s final exam grade in percentage.
Figure 5 shows statistical significance that kinaesthetic learners achieving the highest grade compared to other LS. Visual learners have achieved average score, while auditory learners did not follow a clear pattern in their scores. This is possibly because
54
the recruitment of auditory learners was low, therefore the data did not indicate significance or correlation. RESULTS AND FINDINGS Regarding the correlation between LS and students’ preferences in OL, there was a balanced learning preference between all LS regarding the use of YouTube videos in wiki. Statistical significance was found for the preference of kinaesthetic learners to use hands on exercises. Similarly, a significant preference for the reading files such as Text and PDF files for visual learners. With reference to the correlation between LS of learners and the percentage that social network assisted them to study this course, wiki achieved a significant contribution for kinaesthetic learners in their learning. Wiki also achieved a balanced contribution for visual and auditory learners in their learning. With respect to the correlation between LS and the student’s final exam grade, there was a significant academic achievement for kinaesthetic learners. A moderate academic achievement for kinaesthetic learners was identified, while no significant differences were observed for auditory learners. This is agreed with Manktelow and Carlson (2013) who positively correlated between identifying the learners’ preference and maximizing their learning potential. In summary, it can be claimed that, tutors’ knowledge and consideration of student’s LS, can help them to guide their learners in selecting the learning tools that can suit their learning preferences. For example, based on the findings in this paper, by identifying that a certain learner is mainly kinaesthetic, tutor can guide that learner by providing more tutorial YouTube, simulations and hands on experience. Moreover, tutor can encourage this learner to join and collaborate with other learners in online social forums. This result can be generalized to other learning styles for other learners. RECOMMENDATIONS AND CONCLUSION It is important for any online course that both teachers and students identify the LS of learners. Therefore, uploading a VAK test in the OL course is one of the recommendations in this study. Castaneda et al. (2008) confirmed that LS may be easily studied amongst distance learners, and has the potential to reveal preferences that educators should consider in their teaching activities. Table 3, which is stemmed out from the literature, where their basic preferences for each LS are explained, illustrates the paper findings learners’ for each LS regarding their OL preferences:
55
Table 2. Summary of students’ preferences in each learning style. Learner style
OL preferences
Auditory
- Listening to podcasts, and audio and video downloads related to the studied topic.
Visual
- Online links to videos that access the course content. - Online text or other visual aids in interactive games and simulations
Kinaesthetic
- Mobile learning, exploring the web or completing research projects. - Participating in outdoor activities, to complete assignments and then report their findings and reactions to their peers in a forum.
Further two recommendations, the first that confirms the claim of Shih and Hung (2007) about the importance of flexibility in OL. From the authors’ point of view, online course design itself can encompass flexible authoring facilities. So, with the tutors guidance and support, learners can make the changes of the course design that can suit their learning preference. Consequently, I recommend the use of other Web 2 strategies that may provide opportunities for increased interaction and flexibility in online learning. Examples of these strategies such as: live chat rooms, threaded discussions, and the use of blogs simultaneously with wiki, combined with prompt responses to all email inquiries and real-time Frequently Asked Questions (FAQs). The second recommendation may help to minimise the drawback that may exist when tutors classify students according to their LS. As according to Stahl (2002) and Schank (1995) sometimes, teacher’s instructional method will be specifically directed to these LS. Therefore, I recommend that after identifying each learners’ LS, teachers can start to develop a multisensory learning environment, rather than tailoring teaching techniques to each individual. This combination of simultaneous congruent stimuli will enable an entire classroom to improve their encoding, storing and retrieval of information. Finally, this paper could investigate the LS of wiki students and draw guidelines to motivate and engage these learners. It may give evidence through identifying LS of OL, as clear correlations were drawn between these learners, their academic performance and their learning preference. Moreover, it can be said that each learner has his/her own abilities and perceptions to receive information. Therefore, knowing and understanding their LS may help wiki tutors to design and implement wikis to suit these learners. REFERENCES Chatfield, T. B. (2009). The complete guide to wikis: how to set up, use, and benefit from wikis for teachers, business professional, families and friends. Ocala, Florida: Atlantic Publishing Group. Cohen, L., Manion, L., & Morrison, K. (2007) Research methods in education. 6th edition. Routledge: London. 56
Ebersbach, A., Glaser, M., Heigl., R. &Warta, A. (2008). Wiki: Web Collaboration (2nd ed.). Berlin: Springer. Ellerton, J. (2010). Live your dreams. Let reality catch up: nlp and common sense for coaches, managers and you. Oxford: Trafford Publishing. Emory University. (2013). Welcome to the Discussions Resources Wiki!. Retrieved from http://emorydisc.wikispaces.com/. Felder, M. R. (1995). Learning and Teaching Styles in Foreign and Second Language Education. Foreign Language Annals, 28(1), 21- 31. Fleming, N. D. (2001). Teaching and Learning Styles: VARK Strategies. Honolulu Community College. Retrieved from http://www.howtostudy.com/LearningStyles.htm. Gavan, A. (2012). Visual, auditory and kinaesthetic (vak) learning style. Retrieved from http://www.jcu.edu.au/wiledpack/modules/fsl/JCU090460.html. Hinchliffe, D. (2006). Blogs, wikis, and web 2.0 as the next application platform. Retrieved from http://www.zdnet.com/blog/hinchcliffe/blogs-wikis-and-web-20-asthe-next-application-platform/50. James, D., & Gardner, D. (1995). Learning styles: implications for distance learning. New Directions for Adult and Continuing Education, 67. Juris, M. F., Ramos, V., & Castañeda, M. G. G. (2009). Learning and teaching crossroads. Institute for Learning Styles Journal, Spring, 1, 1-19. Kolb, D. (1984). Experiential learning as a science of learning and development. Engelwood Cliffs, New Jersey: Prentice Hall. LeFever. M. (2011). Learning styles. Colorado: David C. Cook Lemire, D. (2002). Brief report: What developmental educators should know about learning styles and cognitive styles? Journal of College Reading and Learning, 32(2), 177-182. Leuf, L., & Cunningham, W. (2001). The wiki way: quick collaboration on the web, Addison-Wesely: Boston. Lindsay, J. (2009). Web 2.0 and learning. http://julielindsay.wikispaces.com/Web2+and+Learning.
Retrieved
from
Mader, S. (2008a). What is a wiki and how does it work/? Retrieved from http://kibesa.wikispaces.com/Definition+of+a+wiki. Mader, S. (2008b). How do you use a wiki? Poll results. Retrieved from http://blogs.atlassian.com/news/2008/03/how_do_you_use.html. Maddux, C. D., Ewing-Taylor, J., & Johnson, D.L. (Eds.). (2002). Distance education: Issues and concerns. New York: The Haworth Press
57
Manktelow, J., & Carlson, A. (2013). Understanding your learning preference Retrieved from http://www.mindtools.com/mnemlsty.html. Materna, L. E. (2007). Jump-start the adult learner: How to engage and motivate adults using brain-compatible strategies. CA: Corwin Press Incorporated. Moore, M. G. (2013). Handbook of Distance Education. NY: Routeledge. Oradini, F., & Saunders, G. (2008). The use of social networking by students and staff in higher education. In Proceedings of the iLearning Forum 2008 Conference and plugfest. (pp. 236-242). Champlost, France: European Institute for E-Learning. Retrieved from http:www.l-eife/proceedings/ilf08/contributions/improving-qualityof-learning-with-technologies/Oradini_Saunders.pdf. Raschick, M., Maypole, D. E., & Day, P. A. (1998). Improving field education through Kolb’s learning theory. Journal of Social Work Education, 34(1), 31-42. Reid, J. M (1995). Learning styles in the esl/efl classroom. Boston: Heinle & Heinle. Richmond, A. S., & Cummings, R. (2005). Implementing Kolb’s learning styles into online distance education. International Journal of Technology in Teaching and Learning, 1(1), 45-54. Schank, R. C. (1995). What we learn when we learn by doing. (Technical Report No. 60). Northwestern University, Institute for Learning Sciences. Sheppard, A. L. (2013). Learning styles and motives of postgraduate distance learners undertaking a United Kingdom professional doctorate. Journal of Perspectives in Applied Academic Practice, 1(1). DOI:10.14297/jpaap.v1i1.40. Shih, T. K., & Hung, J. C. (2007) Future directions in distance learning and communications technologies.USA: Idea Group Publishing. Simpson, C., & Du, Y. (2004). Effects of learning styles and class participation on students' enjoyment level in distributed learning environments. Journal of Education for Library and Information Science, 45(2), 123-136. Stahl, S. A. (2002). Different strokes for different folks? In L. Abbeduto (Ed.), Taking sides: Clashing on controversial issues in educational psychology (pp. 98-107). Guilford, CT, USA: McGraw-Hill. Terry, M. (2001). Translating learning style theory into university teaching practices: An article based on Kolb’s experiential learning model. Journal of College Reading and Learning, 32(1), 68-85. Vygotsky, L. S. (1978). Mind in society. London: Harvard University Press. Yoshitaka, Y. (2010) Impact of learning styles on learning-skill development in higher education. International University of Japan, Graduate School of International Management. Retrieved from http://www.ua.ac.be/main.aspx?c=.ELSIN&n=95888.
58
THE ROLE OF PEER AND COMPUTER FEEDBACK IN STUDENT’S PROBLEM SOLVING Júlio Paiva*, Nélia Amado**, Susana Carreira** *Agrupamento Vertical Dr. Francisco Fernandes Lopes, Olhão ** FCT, University of Algarve and Research Unit of the Institute of Education of the University of Lisbon, Portugal
[email protected],
[email protected],
[email protected] In this paper we present an episode of a teaching experiment with a class of 8th graders where since the previous year (7th grade) the computer was integrated in the learning of geometry. The learning context is characterized by the importance given to studentstudent interactions. The overall aim of the research is to understand the role of the emerging peer feedback and computer feedback in student’s problem solving with the use of technology. We adopted a qualitative and interpretive research methodology. The data presented are based on an episode involving the actions of a pair of students while solving a geometry problem. The application of a model of feedback phases to the empirical data and its subsequent interpretation led to a set of evidences about the role of feedback (peer feedback and computer feedback) in problem solving with technology. INTRODUCTION Research has provided solid arguments for the integration of computers in mathematics teaching and learning. In particular, the use of technology may facilitate interaction and communication between students when they get involved in the construction of mathematical meanings (Arzarello & Robutti, 2010). In the past, geometry was often presented to students as a finished product, like a fixed system of axioms, definitions, theorems, postulates, constructions, and statements, created for unknown reasons and by unknown people and ready to be inertly assimilated by students. More recently it is intended that students “do geometry”, that is, students are expected to actively engage in open-ended tasks that involve problem solving and allow them to define mathematical objects and discover their properties. The computer provides several features that enable the learning of most topics of geometry and support problem solving in geometry. In technological environments students are more impelled to reflect on the mathematical implications of their actions as it opens up the possibility of easily and rapidly trying out new ideas in ways which are impossible with paper and pencil. Given that effective problem solvers monitor their own mental processes as they plan, implement and reflect on a learning task, learners need to be given opportunities to discuss what goes on in their minds. This means that many opportunities to practice, Carreira, S., Amado, N., Jones, K., & Jacinto, H. (Eds.) (2014). Proceedings of the Problem@Web International Conference: Technology, creativity and affect in mathematical problem solving. Faro, Portugal: Universidade do Algarve.
59
reflect, challenge and revise have to be available (Earl & Katz, 2008). Furthermore, the use of technological environments associated with proposing exploratory or investigative tasks is a significant curricular trend (Ponte et al., 2007). ON THE CONCEPT OF FEEDBACK The notion of feedback has evolved over time. Although the understanding of feedback is not exclusively dealt with in assessment, as Sadler (2010) points out, much of the empirical studies on feedback are from that field (Natriello, 1987; Crooks, 1988; Black & Wiliam, 1998; Hattie & Timperley, 2007). Initially reduced to sanctioning student’s errors (fig.1A), later it started to incorporate information from students’ actions as a way to feed back the process of teaching and learning (fig.1B). A
B
Figure 1. Models of feedback.
Under the conception of feedback reported in figure 1A, much of the feedback provided by the teacher has no impact on student learning (Taras, 2013). As noted by Black, Harrison, Lee, Marshal, and Wiliam (2003, p. 58) “teachers... found it extremely difficult, if not impossible, to offer advice to the students as to how to improve”. In this article we propose a conception of feedback as a dialogical and relational process. Here feedback takes the form of a dialogue opened to all participants. In this context, the role of the teacher is to stir dialogue with and among their students (coconstructive dialogues between pairs) and the role of the learner is to be actively involved in the process (Askew & Lodge, 2000). Black and Wiliam (2010) refer that we have now a clearer idea on the importance of the interactive dialogue between teacher and students and among students themselves, and placed it at the core of formative assessment practices. Feedback may therefore be seen as dialogue (Askew & Lodge, 2000), as “an interaction between parties with the intention of generating a shared understanding” (Price at al., 2013, p. 43). Situations that lead students to support others and to receive help from peers are rich experiences in restructuring their own knowledge, in regulating their learning, and in promoting responsibility and autonomy (Santos, 2002). In this context, it makes sense to refer to co-regulation as a continuous unfolding of individual actions, capable of being continuously modified by the actions of the peers (Fogel, 1993). 60
Many students prefer to learn with their peers than with teachers, reacting differently in each case (Prensky, 2010). Empirical evidence tells us that, under the right conditions, students working with their peers receive more feedback and support, with better quality than they would get only from the teacher. What underlies this quality is that students continue to question each other when they do not understand (unlike the interactions with the teacher that end up ceasing), and also because students use a more accessible and understandable language (Smith, 2007). In mathematics classes, students’ dialogues within their groups are forms of engaging them in describing, predicting, explaining and exploring, thus helping to build understanding (Briten, Stevens & Treby, 2012). The dialogues between students, when working with a computer, are naturally driven by the images shown on the screen (computer feedback) and grow from students need to justify and clarify their own conjectures (Yu, Presmeg & Barret, 2009). In a context of learning that involves the interaction between students and between the students and the computer, we developed a teaching experiment with the implementation of various tasks as the basis to explore the role and relevance of feedback. Throughout the activities performed with the computer, using Geogebra, we could detect chains of feedback between students and between the computer and the students, which contributed to the problem solving process. METHODOLOGY In this study, the teacher (first author) assumes the dual role of teacher and researcher. The research follows a qualitative and interpretative methodological approach and is centred on a teaching experiment of using Geogebra in the classroom. The class consisted of 22 students aged between 12 and 14 years. In this experiment the computer was gradually introduced along 33 tasks through four subtopics of geometry in a two-year teaching program, allowing students to adapt to the technology and become Geogebra natural users. Students worked in pairs, with a computer for each pair. In this article, we will give particular emphasis to the work of two students, who were given the names of Andre and Lukas, so as to preserve anonymity. Data collection involved participant observation, audio and video recording of lessons, and students’ productions. We used audio recordings of conversations between peers, video recordings of students’ actions in the computer and we collected the Geogebra files produced by the students. In this paper, we describe and analyse one episode related to a problem solving task. For data analysis, a descriptive model of feedback phases adapted from Kollar & Fischer (2010) was used (figure 2). The model comprises the phases of: Performance – A student interacts with the computer performing an action in a given task. This action may result from a strategy established with a partner or not.
61
Feedback Provision – Following the student’s action, visual feedback provided by the computer appears, which may be complemented by possible oral feedback from a peer. This peer feedback focuses on the thinking process; it may reveal doubts, discordance or approvals, indications or simple findings resulting from actions, procedures or reasoning. Feedback Reception – The reception of feedback by a student may lead to the emergence of a response (generating feedback to feedback) and thus leading to a cyclical process, termed as interactive dialogue, whose aim is to clarify actions, procedures or reasoning, which can be used as a lever to the process of co-regulation. Construction Process Revision – A new search for strategies starts, opened to the participation of each student in order to enhance a new action. This step consists of proactive (feed forward) and reactive strategies. Reactive strategies are those in which a student responds to visual feedback while manipulating geometric figures. Proactive strategies are those in which the student determines which actions to take before carrying them out, feeding forward the process. While in the reactive strategies the student is more dependent on the feedback provided by the computer, in the proactive strategies the student starts from mathematical properties and uses the computer to implement a specific plan (Hollebrands, 2007).
Figure 2. Model of feedback phases.
THE ANALYSIS OF AN EPISODE When the episode took place, students were used to explore the affordances of Geogebra. This episode focuses specially on a pair of students (Andre and Lukas). The task (adapted from Trigo (2004)) comprises a set of instructions for building a figure similar to the given below (figure 3).
62
Figure 3. Given figure for the problem of wire connecting poles.
The vertical line segments represent electricity poles connected by an electric wire that must be attached to the floor somewhere between them. The goal is to know where to locate the point between the poles in order to spend as less wire as possible. At first, Andre takes control of the computer and later the students are taking turns. The direct interaction with the computer had been an object of negotiation between the two students. Andre begins drawing a horizontal line through two points and he quickly decides to show the grid that, in his view, would become helpful. Then he starts by drawing additional lines as shown in figure 4.
Figure 4. Initial construction.
Then he sets the points that define the ends of each pole and constructs the segments that represent the poles. He measures the two segments whose lengths are 2 units and 1 unit, respectively. After that, he defines the midpoint of the horizontal segment between the bases of the two poles. Finally, he constructs the segments representing the two pieces of wire by joining the highest point of each pole to the midpoint of the horizontal segment. The students change roles and Lukas takes over the computer. Lukas renames the points and reflects the rectangle triangle having the higher pole as one of the sides, in following Andre’s suggestions (figure 5). He also constructs the segment that joins the end of the reflected higher pole to the end of the lower pole, which crosses the horizontal line.
63
Figure 5. Construction with the reflected triangle.
Then Lukas wants to drag the point where the two pieces of wire are joined but the point does not move as Andre had defined it as the midpoint of the horizontal segment and therefore as fixed point. Lukas hides the point where the two pieces of wire join (the midpoint of the horizontal segment), after getting Andre’s agreement, and he looks for the tool that allows finding the intersection point between two lines. At that point, the teacher calls the attention of the class to the need for using measurements to investigate the best location for the point where the two pieces of wire join. Looking closely at the image on the screen, Lukas considers the lengths of the poles: Lukas:
Look this one is higher; is it true that the distance from this one to the point of intersection is greater?
Shortly after, Lukas decides to erase all the constructions and starts over. He suggests that Andre then takes over the computer and remakes the construction until the point where it would be necessary to move the point where the two pieces of wire join. Andre repeats the same procedures for the construction of the poles and finally defines the point P as a free point on the horizontal line. After drawing the segments EP and FP (from the top of the poles to the point P on the floor), Andre measures their lengths. The heights of the poles are again 2 units and 1 unit.
64
Lukas:
Now, if this one has two units of height and this one has only one unit of height, which of the two will need more wire from top to bottom?
Andre:
Need?
Lukas:
Here, if you think of height, this one will need twice the length of the other. What matters more? The height or the base?
Andre:
What is said here [in the problem]? Spend as little as possible?
Lukas:
Yes.
Andre:
As little as possible means that we should make the two [wires] equal.
Andre makes the experience of dragging the point P, and observes the outcome. When he drags the intersection point the following dialogue arises: Andre:
Do the sum: 3.12 + 3.26.
Lukas:
Oh yeah. I know how we’ll do it. (He uses the calculator).
Andre:
It’s 6.38. And now if we change this to 3.2 (referring to one of the pieces of wire), it gives 6.36 (sum of the lengths).
Lukas:
Yes. Which way did you drag it?
Andre:
This way.
Lukas:
That way? Then you’re wrong, you have to drag it to the other side.
Andre:
Yes (he drags again). With 3.1 (referring to one of the pieces of wire) it gives 6.39 (sum of the lengths).
Lukas:
The answer will be 6.36 then.
Andre:
Yes, it’s this way.
Lukas:
Wait, don’t move it. Look, this is not the right answer.
Andre:
Ah, now it’s here. (He drags the point again).
Then Andre measures the angles and notices that the angles between the wires and the horizontal line have very close amplitudes. Andre:
No it’s not. It’s here: twenty eight, twenty eight. (Referring to the angles sizes).
By carrying out the dragging and the observation of the angles sizes (figure 6), the students realized that the solution corresponded to the point where the two angles would have equal sizes.
Figure 6. Final construction with the angles.
According to the peer feedback model involving technology that was proposed above, we can identify a sequence of phases where performance, feedback and revision were important for a deeper understanding of the problem and its solution. In table 1, we present a summary of the feedback cycles taking place in connection with the key points of students’ problem solving activity with Geogebra.
65
Table 1. Description of the phases of feedback. Feedback Phases
Key points from the episode
Performance Feedback Emergence Revision Performance Feedback Emergence
Lukas tries to drag the point on the horizontal line where the two segments join. The computer doesn’t allow the movement of the point. Lukas suggests that the position of the point depends on the heights of the poles. Andre remakes the construction of the figure. Lukas questions Andre about which of the poles will need more wire and about what matters more to the wire length: the height or the basis of the triangle. Andre revisits the aim of the problem and proposes making the lengths of the wires equal. Andre makes the experience by dragging the point on the horizontal line. The computer shows the change of the lengths as the joining point changes. Lukas computes the sum of the two lengths as Andre asked him. When the result of the sum increases Lukas suggests that Andre changes the direction of dragging. Andre changes the direction of dragging. The computer shows the change of the lengths. Lukas computes the sums and concludes that the answer is 6.36 units. Andre says they are moving in the right way. Andre keeps dragging and trying. Lukas asks him to wait; he seems to doubt that the right answer was actually found. Andre keeps dragging the point. Lukas says that it’s not the right answer. Andre disagrees. Andre decides to measure the angles. Andre measures the angles. The computer shows two equal sized angles. The students conclude that the solution to the problem is found when the two angles are equal.
Feedback Reception Performance Feedback Emergence Performance Feedback Emergence Performance Feedback Emergence Performance Feedback Emergence Performance Feedback Emergence Performance Feedback Emergence Feedback Reception Revision Performance Feedback Emergence Revision
CONCLUDING REMARKS In this episode, continuous and interactive feedback fuelled by the use of the dynamic geometry environment gave rise to the so-called co-constructive dialogue between students, where knowledge is jointly constructed through dialogue (Askew & Lodge, 2000). In order to explore the full potential of dialogue in mathematics learning it is crucial to create an environment where dialogue is unceasing (Briten, Stevens & Treby, 2012). Feedback is an integral part of the ongoing dialogue. The episode clearly reveals how co-regulation was a product of peer feedback and visual feedback from the computer. The mutual feedback appears integrated in the learning, suggesting a series of loops in the development of the problem solving activity (Askew & Lodge, 2000). The structure consistently reiterated, as depicted in figure 7, emerges as a strong feature of the activity. We may notice that some of the loops emerge with blanks. This means that some phases do not appear in verbal format or in the form of actions, but they are taking place within the triad composed of the peers and the computer. Other phases are only implicitly present through actions such as, for example, when students adopt new strategies to solve the problem without spelling them out orally. An example is given by the construction of the line segment joining the reflected top of the higher pole and the top of the lower pole (crossing the horizontal line). This particular construction seemed to influence Lukas thinking on the need to change the position of the point on the horizontal (initially defined as the midpoint of the base). In general, the successive 66
cycles of feedback phases indicates an obvious occurrence of students’ exploratory work, some of which are sometimes not continued as they are overtaken by other ideas and approaches to the problem.
Figure 7. The loops of development in problem solving.
The episode clearly reveals that co-regulation emerges as feedback between students and visual feedback from the computer arises, in the sense that there is a continuous unfolding of actions that are likely to be constantly modified based on permanent feedback coming from students and from the computer. The visual feedback from the computer became relevant in several moments. The first idea held by Andre was based on the perception that the two pieces of wire would connect at the midpoint of the horizontal line. This has probably guided the construction he made with Geogebra. However, as Lukas tried to drag the connection point (which he was expecting to be a movable point along the horizontal line), the immediate feedback from the computer showed that the construction was static and would not serve the purposes of exploring different positions for the two pieces of wire. As soon as the figure was reconstructed and the connection point was able to move on the horizontal line, the dragging action and the measurements displayed provided immediate feedback on the lengths of the two wires. The concept of feedback on feedback emerges in the phase of feedback reception when, for example, Lukas tries to relate the heights of the poles with the lengths of the two wires and Andre offers a conjecture, which consists of making the two wires of equal lengths. Although the dialogues are characterized by spontaneity, informality and openness, the meanings that student are developing for the problem situation seem to be built at each step. This is visible in the way students consistently reshape the intentionality of their actions. On the one hand, Lukas tries to understand how to model the horizontal distances between each pole and the point on the floor; on the other hand, Andre seems to look for some kind of condition which will substantiate the solution to the problem: first, he thinks about the connection point equally distant from the two poles; then he goes on to consider equal lengths for the two pieces of wire. An example of the dissenting views can be seen in the last part of the episode when Lukas disagrees of Andre’s assumption about having found the optimal solution; Lukas seems to believe that the position found by his peer is not the right one; however it is important to note that Andre’s point of view ultimately had an effect on getting the solution, since he 67
eventually proposed a condition that leads to the solution of the problem: the two angles between the wires and the horizontal must be equal. This idea also seems to agree with Lukas’ perspective of considering the position of the connection point as somehow related to the heights of the poles. At that point, both views on the problem became compatible. We want to note the emergence of reactive strategies, like when Andre drags the intersection point and sees the sum of the lengths increasing and Lukas reacts by saying that the point has to be moved in the opposite direction. As well, we note the appearance of proactive strategies, like when Andre decides to measure the size of the angles and explore that new aspect of the figure. The notion of proactive feedback or feed forward can be seen here as a set of information that leads the students to act in order to achieve a certain goal, either immediately or later on. The search for peer feedback is also quite evident in students’ dialogue as in the case where Lukas questioned Andre about which of the poles will need more wire and what mattered more in the change of the lengths of the wires – the height or the base of the triangles. This prompted Andre’s conjecture on considering the two pieces of wire with equal lengths and led to further experimentation and verification. According to Keeley and Tobey (2011), it is important to emphasize students seeking feedback from other students as opportunities for them to assess their thinking and reasoning (Donovan & Bransford, 2005). In short, the computer represented an important source of feedback that was coupled with peer feedback in the construction of meaning for the solution to the problem. In this episode, we observed that, starting from two distinct visions to interpret the required position to minimize the wire length, the actions and reactions were leading to a conclusion that found echo in both students’ perspectives. Although not having justified the reason for the two equal angles, the two students were confident of having found the right solution. REFERENCES Arzarello, F., & Robutti, O. (2010). Multimodality in multi-representational environments. ZDM, 42, 715–731. Askew, S., & Lodge, C. (2000). Gifts, ping-pong and loops - linking feedback and learning. In S. Askew (ed.) Feedback for learning, (pp. 1-18). London: Routledge Falmer. Black, P., Harrison, C., Lee, C., Marshal, B., & Wiliam, D. (2003). Assessment for learning: putting in to practice. Maindenhead: Open University Press. Black, P., & Wiliam, D. (1998). Inside the black box: raising standards through classroom assessment. London: School of Education, King’s College. Black, P., & Wiliam, D. (2010). A pleasant surprise. Phi Delta Kappan, 92(1), 47-48.
68
Briten, E., Stevens, S., & Treby, N. (2012). Using talk for learning in science and mathematics. In D. Jones e P. Hodson (eds.) Unlocking Speaking and Listening, 2nd Edition, (pp. 19-34). London e New York: Routledge. Crooks, T. J. (1988). The impact of classroom evaluation practices on students. Review of Educational Research, 58, 438-481. Donovan, S., & Bransford, J. (2005). How students learn mathematics in the classroom. Washington, DC: National Academy Press. Earl, L., & Katz, S. (2008). Getting to the core of learning – Using assessment for selfmonitoring and self-regulation. In S. Swaffield (Ed.) Unlocking Assessment – Understanding for reflection and application, (pp. 90-104). London: Routledge. Fogel, A. (1993). Developing through relationships: Origins of communication, self, and culture. London: Harvester-Wheatsheaf, and Chicago: University of Chicago Press. Hattie, J., & Timperley, H. (2007). The power of feedback. Review of Educational Research, 77, 81-112. Hollebrands, K. (2007). The role of a dynamic software program for geometry in the strategies high school mathematics students employ. Journal for research in mathematics education 38(2), 164-192. Keeley, P., & Tobey, C. (2011). Mathematics Formative Assessment - 75 practical strategies for linking assessment, instruction, and learning. Thousand Oaks, CA: Corwin Press. Kollar, I., & Fischer, F. (2010). Peer assessment as collaborative learning: A cognitive perspective. Learning and Instruction, 20, 344-348. Natriello, G. (1987). The impact of evaluation processes on students. Educational Psychologist, 22, 155-75. Ponte, J. P., Serrazina, L., Guimarães, H., Breda, A., Guimarães, F., Sousa, H., Menezes, L., Martins, M. G., & Oliveira, P. (2007). Programa de Matemática do ensino básico. Retrieved from http://sitio.dgidc.min-edu.pt/matematica/ Documents/ProgramaMatematica.pdf. Prensky, M. (2010). Teaching Digital Natives – Partnering for real learning. Corwin: SAGE. Price, M., Handley, K., O’ Donovan, B., Rust, C., & Millar, J. (2013). Assessment feedback: an Agenda for change. In S. Merry, M. Price, D. Carless and M. Taras (Eds.). Reconceptualising feedback in higher education – Developing dialogue with students, (pp. 41-53). London: Routledge. Sadler, R. (2010). Beyond feedback: developing student capability in complex appraisal. Assessment and Evaluation in Higher Education 35(5), 535-550.
69
Santos, L. (2002). Auto-avaliação regulada: porquê, o quê, e como? In P. Abrantes and F. Araújo (Coords.), Avaliação das aprendizagens, (pp. 77-84). Lisboa: Ministério da Educação, DEB. Smith, I. (2007). Assessment & Learning pocketbook. Alresford: Teacher’s Pocketbooks. Taras, M. (2013). Feedback on feedback: uncrossing wires across sectors. In S. Merry, M. Price, D. Carless and M. Taras (Eds.). Reconceptualising feedback in higher education – Developing dialogue with students, (pp. 30-40). London: Routledge. Trigo, M. (2004). The Role of Technology in Students’ Conceptual Constructions in a Sample Case of Problem Solving. In Focus on Learning Problems in Mathematics. Spring Edition, 26(2), pp. 1-17. Yu, P., Barrett, J., & Presmeg, N. (2009). Prototypes and Categorical Reasoning: A Perspective to Explain How Children Learn about Interactive Geometry Objects. In T. Crane and R. Rubenstein (eds.), Understanding Geometry for a Changing World. (NCTM Yearbook), (pp. 109-125). Reston, VA: NCTM.
70
SIMULATING RANDOM EXPERIMENTS WITH COMPUTERS IN HIGH SCHOOL LEVEL TEACHING Bernard Parzysz Université d’Orléans, France & Laboratoire André Revuz, Université Paris-Diderot
[email protected] Nowadays the teaching of probability makes great use of software, especially to simulate random experiments. For this purpose spreadsheet is a very useful and necessary tool. This paper studies a type of tasks very widely used in French high school curricula (as well as in other countries), in which spreadsheet is used in turn as a random generator, a logical tool, a calculator and a plotter. To work out such a task students first have to elaborate a model of the situation, then simulate it using the software. Thus they have to move through several probabilistic and statistical paradigms, mostly with no explicit clue to help them identify the suitable one(s), making it difficult to know in which paradigm they are supposed to work, which may result in their mixing up statistical and probabilistic notions. Through an emblematic example I would argue into teachers not overlooking this point. INTRODUCTION Through the last century statistics and probability used to be separate chapters in the secondary curriculum (Parzysz, 2003), but a new approach of probability, together with the development of technology for teaching, threw a bridge between them. In French high school curricula the teaching of probability has evolved a great deal from 2010 on, shifting from a purely ‘Laplacian’ (or ‘cardinalist’) point of view on the concept of probability (i.e. assuming that the elementary events have the same chance of occurring) to a much less dogmatic approach, integrating a ‘frequentist’ view (according to which the probability of an issue is the ‘limit’ of the relative frequency of its occurrences through repetitions of the random experiment). This can be in some way compared to the teaching of geometry, since the question of modeling appears to be an important element in both approaches. Another important fact is that nowadays technological tools play a large role in both domains (e.g. dynamic geometry software on the one hand, spreadsheet on the other hand). However, “it is not good enough to only consider which technology to use, but (…), in order for effective learning to take place, it is how the technology is integrated into the curriculum and learning process and how the teacher uses it that are vital” (Pratt, Davies & Connor, 2008, p. 98). Some years ago I got an interest in this question about the use of spreadsheet in the teaching of probability at high school level, and especially the use of computer simulation in the modeling process. As Trouche pointed out:
Carreira, S., Amado, N., Jones, K., & Jacinto, H. (Eds.) (2014). Proceedings of the Problem@Web International Conference: Technology, creativity and affect in mathematical problem solving. Faro, Portugal: Universidade do Algarve.
71
The development of computer tools has largely influenced the development of some mathematical domains (…) and given a new status to experimental features in research (…). These effects apply to classroom mathematics as well. (…) Tools also have a great impact on the way students work. (…) Finally the tools put into play in teaching have thorough effects on conceptualization. (Trouche, 2005 p. 267, my translation).
These recent changes were not without consequence on students’ understanding, e.g. because they may favour a tendency to blur the distinction between similar notions in one domain and the other. As Girard states, “teaching probability by modelling and simulation is not easy” (Girard, 2008, p. 2); he also adds that “the link between statistics and probability is still to be clarified” (ibid.). And Borovcnik advocates supplying the students with a wider and clearer view on probabilistic notions: “clarification of the mutual dependencies between frequentist, Bayesian, and mathematical conceptions and intuitive thought makes the concept of probability flexible and robust” (Borovcnik, 2011, p. 79). In this paper, in order to bring to the fore some problems which arise from the current situation and indicate some possible ways to overcome them I study how French 10th and 11th grade textbooks deal with computer-aided tasks in their probability courses. This paper may be considered as an a priori analysis of a widespread situation that nearly all high-school students will meet more than once. THEORETICAL FRAMEWORK To analyze this type of task I shall use the concept of paradigm coming from Kuhn (1962) and recently applied to geometry by Houdement & Kuzniak (2006). My idea was to transfer these authors’ framework to probability, following the parallel made between the two domains by Henry (1999). Thus I defined several probabilistic paradigms which, in a more or less explicit way, are of common use in the teaching of probability at high school level (Parzysz, 2011): • a ‘realistic’ paradigm, i.e. the concrete experiment put into play using material objects (e.g. real dice, coins, lottery wheel, balls in a bag, etc.); • a second paradigm (P1), resulting from a modeling in which the concrete experiment will result in a list of outcomes and a precise experimental protocol (‘pseudoconcrete’ experiment) ensuring that the experiment can be repeated in the same conditions, the repetition leading to observe phenomena to which a chance of occurrence is ascribed; • another paradigm (P2), resulting from a ‘probabilistic’ view on the experiment, in which the generic random experiment and the notion of probability are defined. Then a study of the properties of probability is undertaken, i.e. an algebraic structure is defined about the events, illustrated in classical model laws (binomial, exponential, geometrical, Gaussian…). The related tools are mathematical proof, usual calculation techniques, representation registers (two-way table, probabilistic tree, set diagram, various statistical graphs…); 72
• a statistical paradigm, namely descriptive statistics (DS), at play in computer simulation, which is also used to establish links with probabilistic notions (relative frequency / probability, arithmetic mean / expected value…). The current French curriculum for 11th grade encourages such a relation: “By using simulations and a heuristic approach to the law of large numbers, the link will be made with the mean and variance of a series of data”. [1] I shall also refer to the notion of workspace (Kuzniak, 2011), that I extended from geometry to probability, with its three components: • a reality space composed of material objects, associated with a visualization process; • a set of artefacts (tools, instruments) allowing actions on the objects, associated with a construction process; • a theoretical reference system, associated with a discursive process (argumentation, proof). Other theoretical elements have been of interest for me, such as: • semantic congruence (Duval, 1995), i.e. a match between units belonging to two different semiotic registers and a similar organization of these elements. • instrumental genesis (Rabardel, 1995), i.e. what makes a mere tool becomes an instrument through using it. USING COMPUTERS IN CLASSROOM TO SOLVE PROBABILITY TASKS Since they are much referred to by teachers, textbooks are a good indication of how computers may be used in classrooms. A survey of the French textbooks for 10 th to 12th grades showed that spreadsheets are mainly used to solve two types of tasks: • tabulating a law of probability, • simulating a random experiment. In the first case, a typical exercise shows a picture of a sheet meant to display a random distribution, asks the students some questions about how it was made and then asks to get a graph of the distribution, calculate some associated numbers (expected value, standard deviation…) and vary the parameters. Then the student has to answer some questions and is asked to make conjectures about what he/she could observe. Here the computer is merely used as a calculator, allowing instantly to get results which in olden days would have required a long time (but nevertheless would have been theoretically available). The second case constitutes the subject of the present study. The French curriculum for 11th grade lays emphasis on this aspect: Using graphic representations and simulations is essential. (…) Algorithmic activities are undertaken (…). Simulating polls on spreadsheet allows become sensitive to interval estimates. [1]
73
What is meant here by ‘simulation’ seems clear: it is using a calculator or a computer to simulate a random experiment. The authors of the curriculum have indeed taken into account the expansion of technology, but by this they restrict the meaning of the word, since, as a 10th grade textbook states: “simulating an experiment is replacing it by another experiment which enables one to get results similar to those of the first experiment; moreover, the new experiment has to be simpler to carry out.” [2] [1]. The essential difficulty lies in ascertaining that the results will be ‘similar’. In fact, the similarity between the experiment and its substitute can only come from the fact that they refer to the same probabilistic model. For instance throwing a well-balanced coin to play heads and tails may be simulated with a die, by agreeing that getting an even number will mean ‘head’ and an odd number will mean ‘tail’. Assuming that the die is well balanced will ensure that the ‘virtual’ coin is also well-balanced. Similarly, in order to study how boys and girls are distributed in families with three children, you can put in a bag black and white balls in equal numbers (e.g. 10), then remove three balls from the bag one at a time, put each ball back in the bag afterwards and study how many balls of each color you have got. In that case the underlying model supposes that the births of a girl or a boy are independent and occur with the same probability; hence the number of girls in a family will follow a binomial law with parameters n = 3 and p = .5. Model simulation
choice
Experiment A
Experiment B
(phenomenon studied)
(substitute) Figure 1
The most frequent type of exercise to be found in French 10 th and 11th grade courses and textbooks includes a simulation of a real situation in which several outcomes can occur in an unpredictable way, according to the following process: 1° simulating the situation with the spreadsheet 2° observing the result of the simulation 3° expressing a conjecture about the probability of one of the possible issues of the experiment or about the possible value of a parameter of the situation. 4° solving the problem using the probability theory. 5° comparing the theoretical results with the results of the simulation. In order to make my purpose clearer I shall now study a practical work taken from a French 10th grade textbook well used in classrooms [3]. In fact, by now this task has
74
become a stereotype, since numerous examples of this same practical work can be found in textbooks of that level. ANALYSIS OF A SIMULATION TASK The task Here goes the wording [1]: (Part 1 [4]) You have three perfect tetrahedral dice: one blue, one red and one green [4]. You throw these three dice and observe how many 4s you obtain. An outcome is a three-digit number, for instance 1 4 3. It is assumed that the probability for all the outcomes is the same. Let us consider the following game: if you get the number 4 three times you win 36 €; if you get it twice you win 2 €; otherwise you lose 1 €. The aim of this exercise is to estimate the average profit which can be expected from a series of 2,500 tries. (Part 2) Simulate with a spreadsheet A B C D E F G Try n° Blue die Red die Green die Issues of 4 Profit Average profit 1 2 3 a) Open a worksheet and fill cells A2 to D2 with the appropriate formulas. b) In E2 count the occurrences of 4 in the block of cells B2:D2. [help: use the instruction COUNTIF] c) In F2 have the profit of try 1 displayed. Enter the conditional instruction: =IF(E2=3;36;IF(E2=2;2;-1)). Justify that it suitably describes the rule of the game. a) In column H you want to display the mean profit as a function of the number of tries. Which formula do you have to enter? b) Select the block of cells A2:H2, then paste downwards until row 2501. c) Select columns A and H, then represent the mean profit as a function of the number of tries, n. (Part 3) Conjecture Simulate this experiment several times. (…) How does the mean profit evolve with the number of tries? Which mean profit can be expected at the end of 2,500 tries? (Part 4) Proof a) How many outcomes are there for a try? b) Count the outcomes giving three 4s; two 4s. c) Let G be the random variable giving the algebraic profit (in €) of the player. Set up the table of the law of probability of G, then calculate E(G). (Part 5) What link do you establish between the result of the simulation and the expected value of G?
75
Simulation In Part 1 the ‘concrete’ situation is described: material objects at play, rule of the game, and a question is asked about this game. The student’s intended workspace is composed of these objects and rules, together with actions (2,500 tries) and subject of interest (mean profit). Then a hypothesis is made (“It is assumed that the probability for all the outcomes is the same”). In fact, it introduces a probabilistic model of the situation. This going through P1 is necessary, since to simulate an experiment you need to model it. Making the model explicit ensures that the same experiment will be repeated, since in each try the same protocol will occur (Parzysz, 2009). However this necessary step is often skipped in teaching and one shifts directly from the real situation to its simulation. This is made easy because for most of the random experiments studied in classrooms a canonic model exists, which is then considered ‘transparent’. But, by so doing, the students may be induced to simulate the real situation at first, i.e. without being aware that they are implicitly making hypotheses. In the model presented here, “an outcome is a three-digit number” and, since each die can show 1, 2, 3 or 4 there are 64 possible outcomes which, from the hypothesis, are assigned 1/64 as probability. The referent workspace (in P1) is composed of the outcomes with their probabilities, and the student is supposed to work within the domain of rational numbers. The next step of the task (Part 2) is a simulation. One of its current uses in probability teaching is to have the computer carry out a long series of tries supposed to be similar to the random experiment studied. The feature used for that purpose is a (pseudo) random generator supposed to provide decimal numbers equally displayed between 0 and 1 (Parzysz, 2005). In this part the student’s workspace shifts from P1 to DS: the probability hypotheses have to be converted into instructions for the software, the corresponding registers being natural language and the symbolic language implemented in the spreadsheet. Then the students work within DS, using notions they already know (sum, mean). Implementing the rule of the game in the worksheet is trickier, but the textbook helps them by giving the formula. The students have to elaborate a strategy, and for this they are given clues at each of the three steps which can be distinguished in the strategy: 1° dealing with the three dice individually; 2° putting the three results in common; 3° repeating the experiment.
A major difference with using geometry software for teaching appears here: the students are much more guided, and they are confined to carry out elementary tasks. This characteristic fact has already been mentioned by educators:
76
A (…) feature of the [computer aided] teaching is the tendency to develop a solution strictly step by step (…) The aspect being important for my concern is not that an order is put on mathematical task solving (…) but that the participants restrict their considerations to the actual mathematical step. (Jungwirth, 2009 p. 3)
Since “making the handling of software easier does not ensure the necessary ability for succeeding in more complex tasks” (Rabardel, 1995, [1]), it seems important that the teacher explains the process in its entirety, and for that a diagram visualising the algorithm at work may be most useful. The justification required at the end of question c) is supposed to make sure that the student understands what he/she is doing, but it is in fact purely rhetorical. Some textbooks pay attention to this question and have devoted paragraphs on how to use calculators, spreadsheet and dynamic geometry software in relation with the tasks required in the curriculum. In Part 3 the spreadsheet is used for repeating the experiment and making conjectures based on the results displayed (numbers and diagram). This dynamic aspect is an important feature of the task, because it establishes a link between DS and P2 Until now the spreadsheet had been used in turn as a random generator (for throwing dice), a logical tool (conditional instruction), a copying machine (in order to get 2,500 tries), a calculator (for the average profit) and finally a plotter (to show its evolution). Then it is used for making conjectures. The student’s task is now to observe how the results evolve through several series of experiments and then conclude by making a guess about a ‘limit’ for the parameter. An important feature of the software for teaching is indeed its dynamic aspect (F9 key) which shows the sample fluctuations and the convergence of the frequencies; nevertheless it has some limits, since the – postulated − limit of the series of frequencies is not necessarily accessible, e.g. if it is not a decimal number. The student’s workspace is mostly DS, with a – more or less implicit – recourse to a ‘naive wording of the law of large numbers’ [6] which refers to probability. Finally, this process can be illustrated by the following diagram (figure 2): starting from the real situation, the student shifts to probability (to implement a model in the spreadsheet) then to statistics (to calculate parameters of the distribution), then again to probability (using the law of great numbers to conjecture limits) and finally back to the real situation to express his/her answer.
77
Descriptive statistics (DS) Result
Experimentation
Law of large numbers
Spreadsheet
Part 3
Part 2 Probability (P1) Semi-concrete model semi-concret
Part 1
Conjecture
Modeling
Translation
Question
Answer
Real situation Figure 2
Theoretical solution Part 4 is quite another exercise, in which simulation is abandoned and a theoretical solution asked. Its structure and wording are that of a ‘classical’ probability problem (P2). The student’s task is to determine in which theoretical space he/she will have to work, then to set up the table of the law of probability of G and calculate its expected value. The processes at play in this part of the task can be described by the following diagram (fig. 3):
Probability (P2) Solution
Part 4
Modeling
Translation
Question
Answer
Real situation Figure 3
78
Let us note that the subjacent model is the initial one, in which an outcome is a threedigit number: this is the reason why the dice must have different colors, the aim of such a ‘pedagogical artifact’ being to guide the student towards the correct solution. Comparison To finish with (Part 5), the student is asked to establish a link between the ‘statistical’ part (simulation) and the ‘probabilistic’ part (proof). The justification will be based on a ‘naïve formulation of the law of large numbers’. But here we have E(G) = ∑ 𝑥𝑖 . 𝑝(𝑥𝑖 ), whereas the average profit is ∑ 𝑥𝑖 . 𝑓(𝑥𝑖 ) (1 ≤ i ≤ 3). Therefore one has to take into account not only the convergence of a particular frequency but the convergence of the frequency distribution towards the probability distribution. This is indeed a consequence of the law, but it makes it necessary to consider the whole distribution. Remark. The purpose of the authors was certainly here to introduce the binomial law, since three independent Bernoulli random variables B(.5) can be attached to the dice. Moreover, the values of the random variable were chosen so that its expected value is 0 (fair play). DISCUSSION About model(s) Here a question arises about the model, which is far from unusual in probability, especially when spreadsheet is used (Parzysz, 2009): the model implemented in the software does not fit with the hypothesis. The table shows that the assumed equiprobability concerns the four vertices of each die, since the hypothesis states that it is in the 64 possible three-digit numbers. A more suitable implementation would have been to display the three-digit number together with the corresponding number of 4 and/or the associated profit. Of course in the present case the two models, although different, give the same results, According to the hypothesis, there are 54 outcomes with no or one 4, 9 issues with two 4s and 1 outcome with three 4s. Hence the distribution is: P(G = 36) = 1/64, P(G = 2) = 9/64, P(G = −1) = 27/32. According to the model implemented, for each die p(1) = p(2) = p(3) = p(4) = ¼. And, assuming that the dice are mutually independent, a binomial law with parameters n = 4 and p = .25 gives the same distribution as above: 3 2 3 3 P(G = 36) = ( ) (1⁄4) = 1/64, P(G = 2) = ( ) (1⁄4) (3⁄4) = 9/64, 3 2 2 3 3 3 P(G = −1) = ( ) (1⁄4) ((3⁄4) ) + ( ) (3⁄4) = 27/32 1 0 However the first model would have been more difficult to implement in the software and this is certainly the reason why the authors chose another one which they knew would lead to the same results. In fact, there seems to be a general implicit – and efficient − rule according which, when the congruent model is not easy to implement 79
in the computer, you replace it by another one, equivalent to the first one and easier to set up. Replacing a model by another one is no problem for the teacher, since he/she knows that they are equivalent. But the students could rightly be puzzled by this substitution. In the present case a possible better solution would be to study another experiment, in which a same die is thrown three times, the first throw giving the first digit of the number and so on. The table would then be: 1 2 3
A B C D E F G Try n° 1st throw 2nd throw 3rd throw Outcomes of 4 Profit Average profit
A problem appears when students are beginning to study probability, since they do not know what a probabilistic model is. The use of computer simulation can help them grasp this notion, in the following way (Parzysz, 2009): after simulating various random experiments they may become aware that for some of them the procedures implemented are very similar, since the corresponding sheets have the same structure (e.g. the above table and the table given in the wording of the exercise). This common experiment scheme can then be used to justifiy that one experiment can be replaced by another one that will ‘give the same results’ (fig. 4):
Model Common experiment scheme
Experiment A
Procedure A
Table A
Experiment B
Procedure B
Table B
Experiment C
Procedure C
Table C
Simulations
Experiments Figure 4
Reality, statistics and probability As we could see, this task is in fact composed of two quite different exercises, the first one making use of a spreadsheet, and the second one being of a traditional type. What makes it interesting from a pedagogical point of view is the final comparison between 80
them: it shows that the computer can be used to approximate a law of probability, on the condition that this law is implemented in a correct way in the computer. Here the link between statistics and probability is fundamental, and one must not confuse these two domains: probability is about theoretical objects, whereas statistics studies a series of data coming from an observed phenomenon. There are of course strong links between them, and some concepts and formulas are very similar, such as for instance: • arithmetic mean (statistics): m = ∑ 𝑓𝑖 𝑥𝑖 • expected value (probability): 𝑋 = ∑ 𝑝𝑖 𝑥𝑖 In the present case, the average profit observed in 2500 tries may be .0426, .0018 or .0235, but the expected value of profit is exactly 0. The wording is confusing, since ‘average profit’ is used both in a probabilistic context (Part 1: “estimate the average profit which can be expected”) and a statistical context (Part 2: “In column H you want to display the average profit”). Moreover, the meaning of ‘average profit’ in the question “Which average profit can be expected at the end of 2,500 tries?” is really puzzling: if it really means ‘average profit’, after having carried out 2,500 tries you know it because you can calculate it; but if it means ‘expected value’ you do not need 2,500 tries to know it, since it is 0. This may give a clue to making the difference between the two domains appear. For instance, when you compare on a screen several experimental graphs issued by simulations of a binomial law with the theoretical graph of this same law, you notice that the statistical graphs are different from one another, and different from the probabilistic graph as well (although they are close to it). Finally we could see that in such exercises the student is faced with three different experiments: a real experiment (dice), a model experiment (implementation on computer) and a simulated experiment (simulation). These experiments are associated with different reference domains, and thus with different workspaces, and they interact with one another. This is somewhat similar with what happens with geometry problems. CONCLUSION In such tasks the process which has to be put into play by students is complex, since they have to deal with several domains and shift from one to another: reality, probability and statistics. The student’s workspace is constantly changing, first through a modeling process – often implicit − then through a simulation on spreadsheet and finally through a return to the model. In this process the computer acts as a versatile help, since it is used in turn as random generator, calculator, logical tool and plotter, both to calculate (and then its produces results) and to ‘show’ theoretical results (and then it produces conjectures), which may not be so clear for students. In these process three different ‘experiments’ are carried out in turn, each of them belonging to a different domain, and teachers would certainly be aware of the risk of ‘blurring’ the distinction between them:
81
A dissymmetry between students and teachers must be noted. The latter, who are experts in their domain, directly decode the results which they are presented, without even thinking about it. It is not the case with students in the process of learning, who usually do not have the required knowledge at their disposal. (Bruillard, 1997 [1]).
For that reason the role of the computer is not just to make it easier to get a large number of experiments in a short time (i.e. tool) but it constitutes an important element in the modeling process (i.e. instrument). This ‘instrumentation’ process needs time, and students must be given the conceptual background enabling them to become familiar with the modeling process to fulfill this goal (Rabardel, 1995). The semantic congruence between the real situation and the model implemented in the computer has to be taken into account explicitly in teaching. Computer has now become a very useful − in fact essential – help in probability teaching. But its numerous advantages − among which the random generator and the speed for calculation − must be accompanied by a concern for possible problems which may arise from using this medium. As we could see, some of them can be overcome if teachers train their students to become aware of the various domains brought into play by putting the stress on what comes from (real or computer-aided) experiment and what comes from the theory. One aim of this paper was to show which didactical problems may arise from the use of probabilistic simulation; another one was to contribute to make things clearer. But further research should now be undertaken to specify how this can be achieved in classrooms. NOTES 1. My translation. 2. Mathématiques classe de Seconde. Collection Indice. Bordas, Paris 2000, p. 138. 3. Mathématiques classe de Première. Collection Transmath. Nathan, Paris 2011, p. 303. 4. This division into five parts is mine; it is intended to make the following discussion easier. 5. The wording is illustrated with a photograph of the dice showing their vertices labeled 1, 2, 3, 4. 6. “When the number of experimentations grows the relative frequency gets nearer the probability” (Cf. Resource document for 9th grade, p. 8).
REFERENCES Borovcnik, M. (2011). Strengthening the role of probability within statistics curricula. In C. Batanero, G. Burrill, C. Reading, & A. Rossman (Eds), Teaching statistics in school mathematics. Challenges for teaching and teacher education. Joint ICMI/IASE Study, (pp. 71-83). New York: Springer. Bruillard, E. (1997). L’ordinateur à l’école: de l’outil à l’instrument. In L.O. Pochon & A. Blanchet (Eds), L’ordinateur à l’école: de l’introduction à l’intégration, 97118. Neuchâtel: IRDP. Duval, R. (1995). Sémiosis et pensée humaine. Registres sémiotiques et apprentissages intellectuels. Bern: Peter Lang. 82
Henry, M. (1999). L’introduction des probabilités au lycée: un processus de modélisation comparable à celui de la géométrie. Repères-IREM 36, 15-34. Houdement, C. & Kuzniak, A. (2006). Paradigmes géométriques et enseignement de la géométrie. Annales de Didactique et de Sciences cognitives 11, 175-193. Girard, J.-C. (2008). The interplay of probability and statistics in teaching and in training the teachers in France. In C. Batanero, G. Burrill, C. Reading, & A. Rossman (Eds), Teaching statistics in school mathematics. Challenges for teaching and teacher education. Joint ICMI/IASE Study, (pp. 1-2). New York: Springer. Jungwirth, H. (2009). Explaining a technologically shaped practice: a sociological view on computer based mathematics teaching. In C. Bardini, D. Vagost, A. Oldknow (Eds), Proceedings of the Proceedings of the 9th International Conference on Technology in Mathematics Teaching, Metz, France: ICTMT9. Retrieved from http://ictmt9.org/contribution.php?id=55&lang=en. Kuhn, T. (1962). The structure of scientific revolutions. Chicago: The University of Chicago Press. Parzysz, B. (2003). L’enseignement de la Statistique et des probabilités en France: évolution au cours d’une carrière d’enseignant (période 1965-2002). In B. Chaput & M. Henry (Eds), Probabilités au lycée, 9-34. Paris: ADIREM/APMEP. Parzysz, B. (2005). Quelques questions à propos des tables et des générateurs aléatoires. In B. Chaput & M. Henry (Eds), Statistique au lycée I, 181-199. Paris: APMEP. Parzysz, B. (2009). Simulating random experiments with computers in the classroom: indispensable but not so simple. In C. Bardini, D. Vagost, A. Oldknow, A. (Eds), Proceedings of the Proceedings of the 9th International Conference on Technology in Mathematics Teaching, Metz, France: ICTMT9. Retrieved from http://ictmt9.org/contribution.php?id=89&lang=en. Parzysz, B. (2011). Quelques questions didactiques de la statistique et des probabilités. Strasbourg, Annales de Didactique et de Sciences cognitives 16, 127-147. Pratt, D., Davies, N. & Connor D. (2008). The role of technology in teaching and learning statistics. In Batanero, C., Burrill, G., Reading, C. & Rossman, A., eds, Teaching statistics in school mathematics. Challenges for teaching and teacher education. Joint ICMI/IASE study, Springer, 97-107. Rabardel, P. (1995). Les hommes et les technologies. Une approche cognitive des instruments contemporains. Paris: Armand Colin. Trouche, L. (2005). Des artefacts aux instruments, une approche pour guider et intégrer les usages des outils de calcul dans l’enseignement des mathématiques. In Proceedings of the Saint-Flour Summer University, 265-289. Retrieved from http://www3.ac-clermont.fr/pedago/maths/pages/site_math_universite/CD-UE/ Menu_pour_Internet.htm. 83
ELECTRONIC FORUMS: AN ADDED VALUE WHEN SOLVING INITIAL ALGEBRAIC PROBLEMS M. Pilar Royo, Joaquin Giménez INS Montillivi, Barcelona University
[email protected],
[email protected] Eighteen students of Junior High School (13-14 years old) have been observed when solving a classic algebraic problem in a collaborative way, by using electronic forums. This task is considered as an example to show the interactions appearing when using electronic forums as mediators on the reflective process of co-constructing algebraic ideas. It’s found that the highest profile students not only participate actively in the task but they introduce more mathematical meaningful issues. Qualitative analysis shows that generalization methods are close to which it’s regularly presented in faceto-face classrooms but reflection spontaneously emerges as a need for revealing the importance of exchanging the representations. INTRODUCTION According to traditional perspectives on algebraic teaching, mathematical context is taken as the starting-point while the applications of algebra (like problem solving or generalizing relations) come in the second place. Teachers in traditional classes give a lot of information, while teachers in the reformed classes chose to draw information out of students by presenting problems and asking questions. According to Coll (2007) various studies show that the effective capacity of ICT to transform the dynamics of work of teachers and students in schools and the processes of teaching and learning in the classroom is, in general, far below the transformer and innovative potential, usually attributed to them. In such a framework, our main hypothesis is that the forum of conversation, as a Computer-mediated Communication (CMC from now), can turn out to be a useful instrument to solve, reflect and discuss problems jointly. The challenge is for teachers to create learning environments that help students to make the transition from basic to high-order skills. In this new scenario, the focus is not on teachers but the process of how the students learn. In such a framework, the use of ICT in first Secondary Schools will entail the gradual disappearance of the limitations of space and time, which will result in a transition toward a usual student-centered model based on cooperative work. Online discussion forums are web-based communities that allow users to share ideas, post problems, comment on posts by other users and obtain feedback. Previous research experiences, uses forums to promote debate and thinking in prospective teachers learning (Bairral & Giménez, 2004; Bairral & Powell, 2013), but less use is devoted to a common problem solving activity with young students (Murillo & Marcos, 2011). Though students are more and more confident in their technical abilities for online 84
Carreira, S., Amado, N., Jones, K., & Jacinto, H. (Eds.) (2014). Proceedings of the Problem@Web International Conference: Technology, creativity and affect in mathematical problem solving. Faro, Portugal: Universidade do Algarve.
communication, we know that their online experiences do not generally require them to use dialogue as a way to explore, expand, and drill down into problem solving issues significantly (Jonanssen, 2002). In this paper, our aim is to present how a group of eighteen students of Junior High School (13-14 years old) interact and solve a classic algebraic problem in a collaborative way, using ICT tools as an example for basic scientific understanding of interactions as co-construction processes of sense making in online environments or mixed environments. In particular, to see which is the relation between the use of media tools and problem solving approach. By analyzing such a task, we explain some benefits and possibilities of online algebraic problem solving teaching issues, focusing on the implications of forum conversations as a mediator for reflective interactions. The activity leads to the development of generalization and symbolism processes. The “listening” of the ideas and reasoning of the students allows the planning of activities in order to promote individual learning and the learning of the group. The condition of transformation agents assigned to the ICT is worth to be taken into account for conceiving deliberate interventions to change the pedagogical models, the practices in the classroom, and the curricular contents in educative systems in order to lead the students towards a significant and satisfactory learning (Rojano, 2003: 138). THEORETICAL BACKGROUND We assume that running online discussion forums enable the application of constructivist learning issues for problem solving (Jonanssen, 2002). In our assumption, Teachers have to guide the pedagogical setting towards situations in which relevant aspects are discussed, such as posing questions related to the critical analysis of contexts or the necessity for the generation of new and useful information to promote attention (Ainley & Luntley, 2007). On-line forums and blogs have also been recognized as fertile ground for meaning product discussion. Some recent researches analyzes forum discourses with preservice teachers or in training teachers courses (Bairral & Gimenez, 2004), and also collaborative problem solving activities with future teachers (Bairral & Powell, 2013). But a few researches focus on what kind of behavior and strategies appear when young students solve algebraic problems in an asynchronous way. Generally speaking, the use of the Internet in a student-centered model has a great deal of potential strengths: (1) computer networking facilitates the implementation of cooperative learning overcoming the relation human-media (Borba & Vilareal, 2005); (2) promotes articulated communication by compelling the students them to state their needs in a concise and highly articulate way (Royo & Giménez, 2008); (3) Asynchronous web-based forums give students time to reflect on issues before they add their own contribution (Bairral & Powell, 2013); (4) accommodate the potential for e-tutors and e-learners to engage in continuing tutorials, rich in dialogues and reflections, and generate processes of meaning construction and knowledge
85
advancement (Rowentree, 1997); (5) gives specific opportunities for co-construction of learning (Royo, 2012). In particular, using forums allows students to become the center of their own learning (Jonanssen, 2002). Participation in our analysis of reflective interactions should be considered as something that improve or restrict mathematics development (Cobb, P. et al., 1997, p. 272). When analyzing interactions we want to understand if the media facilitate mathematical discourse and scaffolding by providing direct instruction (Anderson, 2001). We assume some previous research results about the use of electronic forums with geometry problems (Murillo & Marcos, 2011) that the use of the forums of conversation in a digital environment, used to jointly investigate algebraic problemsolving strategies, create favorable conditions, (a) so that the process of problem solving promote reflection and communication of ideas among the students; (b) for influencing changes affecting the teaching role and the relations that are set out in the classroom; (c) individual growing and collective development of objects and processes in the topic. Several authors tell us that such e-activities based on group work must be properly structured to avoid the free rider effect, but we decide to use the forums in a completely free way (Johanssen, 2002). For analyzing the educational influence of interactions on electronic environments we consider two dimensions: the academic task management and the management of the meanings. It’s considered the construct called educational profile, which relates quantitative contributions data by accessibility, participation and connectivity criteria (Coll, Mauri, & Onrubia, 2012). We also assume that content analysis helps to categorize students interventions in algebraic settings. Many cognitive results are not in this paper, but fully described and justified in Royo (2012). It was also considered that the inscriptions of individuals working online in a small-group or team provide observers, who must interpret meanings constituted in the contributions, as evidences of individual and collective thinking (Bairral & Powell, 2013). METHODOLOGY The task presented in this paper, belongs to a part of a wider research in which several problem solving tasks were conducted, analyzed and redesigned through the application of a Design-Based Research methodology (Gravemeijer, 2002, Royo, 2012). For the design of the learning environment (Murillo & Marcos, 2011), we used the Moodle-platform provided by the School. This paper analyzes just a simple problem, and their conversation forums on the virtual environment Moodle, which was new, both for teacher and students at that moment (see figure 1). The experiment presented in this paper was developed during two months, the year 2008/09 and repeated in 2010 and 2011. In order to see an example of the forums, we focus on the following problem: “Given n dots, how many segments do we need to unite them in pairs?” We choose this problem, because is the first one in the global project, and means a classic in the work of generalization. Wiki spaces were also used to introduce more final reflections, not analyzed here. 86
Figure 1. Presentation page (left) and contributions of the forum (right).
Such a problem allows a wide variety of representations and the development of inductive processes, starting with particular cases. Oral conversation occurred in the classroom at the same time that they did contributions to the forums. In addition to using computers, students had paper and other material written or manipulative aids as instruments of work to look for strategies for resolution of the problems. The use of the forums in situation of non attendance and outside the assigned hours (from home, library...) was optional. The participants communicated individually among themselves simulating to be at home in a computer room, and combining it with group of four discussions in the regular face-to-face classroom. At the end of the intervention period in forums, students carried out a written test and answered a survey for the evaluation of the use of electronic conversation forums. The collected data for our study is constituted by registered dialogues on the forum, and also audiovisual records of some moments of the session; direct records of the diaries of the students in the Moodle platform; record direct from the journal of the teacher in the Moodle platform. We have analyzed the dialogues of the forums by applying descriptive methods to its development during the sessions, including aspects of activities that have had impact on them. We think that it should lead the mathematical reasoning through observation of individual cases, guess, check and argumentation, since thus prepares the task of orientation of the process of generalization, one of the main ways of introduction of the algebra. To follow our aims, student’s interactions had been analyzed by using educational profile using e-accessibility and e-connectivity. Content analysis is presented here by identifying algebraic contributions in a specific task, and quantifying the use of problem solving strategies in terms of applying and answering, grounding, or interpreting other’s contributions. To describe the steps and strategies used, we considered the following categories (following J. Mason et al., 1985): (V) Students verbally explicit relationships between the data of the problem. (PA) Used arithmetic procedures to express relationships between the data of the problem. (LlS) Used symbolic language to express relationships. (RP) Records a pattern or regularity, preferably using symbolic language in which formula appears in accordance with symbolic expressions, including ways to 87
iterative and recursive procedures. (PVF) if students prove the validity of the formulas used. RESULTS To see the results of our first structural interaction analysis of contributions within the DBR process, we selected and adapted a set of e-communication indicators (following Coll, Engel & Bustos, 2009). Expected profile considers: (a) accessibility by individual average of entries being > 1 and individual entries ≥1/n; (b) participation by observing individual contributions in front of readings being ≤ 0,5 and individual contributions in the total being ≥1/n ; (c) connectivity by seeing number of messages received out of the whole ≥1/n, and number of messages received over sent being almost 1 (d) collective accessibility being everyday average of entries >n; tax of contributions being ≤ 0,5 . In Table 1 we show how the first four groups of the 18 participants which were grouped according to the highest number of above cited criteria satisfied. Table 1. Profile and interaction characteristics found in the problem analyzed. N DOT PROBLEM (individual indicators) ACCESS PARTICIPANTS Students Teacher
Individual average of entries MDIE
(>1?)
PARTICIPATION
CONNECTIVITY
IIRCL (≤ 0,5)
individual indicator of written contributions — IIC (≥1/n)
individual indicator of received messages— IIMR (≥1/n)
Individual indicator of reciprocity— IIR (≈1)
Individual indicator of entries— IIE
individual indicator of contribution relating lectures—
(≥1/n)
St 1_E14
20
0,23
0,17
0,21
0,26
0,83
St 6_St 9
6
0,07
0,24
0,09
0,13
1,00
St 8
12,6
0,15
0,11
0,09
0,12
0,90
0,07
0,21
0,07
0,13
1,25
Teacher
5,57 Profile A
Satisfying all the criteria with expected indicators (Highest profile)
St 5
8
0,09
St 11
5,71
0,07
0,05 0,11 Profile B Satisfying five criteria 0,20
0,07
0,08
1,00
0,01
0,13
Profile C Satisfying four criteria St 2
5,86
0,07
0,12
0,04
0,01
0,20
St 12
1,71
0,02
0,33
0,03
0,05
1,00
St 15
4,86
0,06
0,09
0,03
0,03
0,67
St 16
6,43
0,08
0,05 0,13 Profile D Satisfying three criteria
0,01
0,17
We have classified the contributions into groups of students depending on whether its focus is the algebraic content or the relationship with the other participants (see table 2, below), and we see that it changes according tasks (Royo, 2012). We found that in the electronic forums, students passed through the access/motivation and online socialization stages to the information algebraic exchange stage in a few days during the analyzed forum as we can see next when describing the example of the first
88
dialogue. An interaction scheme shows three main nodes for this task, but a lot of common interventions (explained in detail in Royo, 2012, p. 212). Next, we describe some dialogues of this first task, to see how the dialogues introduce problem solving issues among interactions and how they were codified and associated to each contributor. In their first interventions, the students showed that teacher guidance was still desirable. Student 1: Student 2:
Pili, which number is n??? We can unite nothing because we don’t know how many dots we have. Teacher: Well, maybe we can start with a few dots… How many dots you want to start? (Assume V)
The second part of the Forum starts from a contribution in which St 6 and St 9 vary referential perspective to propose a new strategy to find the sum of n consecutive natural numbers (PA). The teacher proposal offered some security when attempting to begin to draw diagrams with some groups of dots. Therefore, she decided to make a new proposal: Teacher:
You have been drawing dots and segments. You have tried with 2 dots, with 8 dots… Is it possible that you make a table with the results?
Then, many students follow the suggestion, and ordered the data in a table (PA). Others simply accept. This action facilitated the passage from the particularization to the generalization, a process that each student understands as a compulsory proposal. As usually in face-to-face classrooms, the development of tables gave rise to the emergence of recursion strategies. dots
segments
1
0
2
1
3
3
4
6
5
10
6
15
Student 3 says that “I have found this: the difference between 1 and 2 is one. Between 2 and 3, it is 2. Between 3 and 4, it is 3. And so on… a is the number of segments a=n –1+ a of previous number.” (PA) This kind of contributions gave rise to the expression of diverse ideas, request for clarification and comments. It is interesting to observe the last expression of the written contribution above (“a = n - 1 + a of the previous number”), which are not valued as wrong but as a step in the use of algebraic language. (LIS)
The teacher-researcher wrote in her research diary some comments on content analysis, using different categories: “They have decreased the contributions posed questions (D). They have increased the social contributions (S) and explanations (E). In terms of strategies, they appear for the first time contributions of registration pattern (RP) and evidence of the validity of formulas (PAV). Communication of cognitive elements appearing in some interventions mixed with emotional and affective elements. As an example, St.13 participates for the first time, after having refused initially to use the Forum. The teacher had been talking with him individually after the first session”.
89
Finally, the students also commented in their written forum reports that they thought the forum allowing active processing, mediated contribution, and a better understanding and control of the problem solving process. In order to facilitate the communication of these expressions, the teacher suggested an oral discussion and the use of the whiteboard to represent the situation jointly developed (see figure 2).
Figure 2. From the particular cases to the generalization.
At the end of the oral discussion, in the forums, new representations appeared: Students 4 & 5:
We have discovered the formula. It works with our examples. It is: n:2 (n-1) (LIS)
The input to the forum continued. The students kept their communication by requesting and offering explanations and help, or exchanging their findings: Student 6:
[to Student 7] Is it possible that I understand a thing that you don’t? ¬ ¬" The question is to catch any number, which will be “n”, then you must split between 2 multiply by the result of n minus 1. (LIS+ RP)
Student 8:
Albert is right. I checked it out. The formula is n:2 (n-1) (LIS+ RP)
From here, a discussion arose about the equivalence between the expressions “(n-1), n:2” and “n+(n-1)/2 * n”. Student 4:
We can do both things and it goes well. (Example of agreement)
Some students proposed the use of known resources: Student 9:
We can take the geoboard and go testing with dots and segments http://nlvm.usu.edu/en/nav/frames_asid_279_g_4_t_3.html?open=activiti es&hidepanel=true&from=vlibrary.html (non cognitive comment)
Some other students sought convincing explanations to the formula. Although this explanation had already been found a week earlier, the attribution and appropriation of meaning has to be performed individually, and each student needs to perform an individual process: Student 10:
Why the formula works: It is because each dot matches with another one, but not with itself. So, you have to subtract 1 from the starting number: ·(n-1). The result is divided by 2 because the dots are listed only once. (RP)
Meanwhile, new representations emerged: Student 11:
90
Me and [Alumn.12] have discovered: When n= 5 dots: (5-1) + (5-2) + (5-3) + (5-4) = 4 +3 +2 +1= 10 segments (we are still investigating)
This latest contribution led to the introduction of manipulative material (polycubes) to encourage representations (see figures 3a and 3b) and oral discussion about them: Teacher :
Which relationship do you see in 1 +2 +3 +4+5 in this new context (polycubes)?
[Students:
It’is the same]
[Teacher :
Can you find a formula for it?
[Students:
Yes, it’s the sum of the "squares"] (PA)
Figure 3a: Representing 1+2+3+4.
Figure 3b: Representing 1+2+3+...+n.
After the work with material and some discussion, the students returned to the forum. New representations and relationships appeared, as we can observe by Student 13 comment. Another strategy: “5 dots and n=4: 1+2+3+4 = (1+4) + (2+3)=5+5= 10, and that’s equal to: (1 +4) • 4/2= 5 • 2= 10 (1+n) ·n/ 2” (LIS)
Student 13:
After doing all codifications when some strategies and categories appeared, some tables had been constructed to identify what happens in each task. In table 2, we present part of the data research table in this task of n dots we analyze here. It’s possible to see the categories above explained and codified as we see in the dialogue. In the table 2, we see the contributions not related to algebra but including possible clarification issues (a); and related to algebra over a colleague contribution (b). Table 2. Part of classification of contributions in the task according the content, according to different students and profiles. Problem “n dots”
Categoríes of contributions
Participants
Profile
S
D
V
St 1_St 14
A
4
4
1
St 2
C
2
1
St 3
F
1
2
St 4
E
6
3
St 5
B
2
Teacher
A
Total group
E
LIS
RP
PVF
9
1
4
1
1
1 1
1 2
2 34
PA
28
1
1
5
6
26
1
9
1
9
3
Total
(a)
(b)
24
7
17
5
1
4
4
1
3
10
1
9
6
2
4
8
1
7
115
28
87
91
Finally, to see the influence of educational profile on the final results, we observe how the students in highest profiles evolve in some algebraic meanings. Analyzing the results from all the tables associated to the different tasks and final test, we observed that the categories corresponding to the higher level of algebraic content are related to the contributions of higher educative profile students. Just the Student 16 is different, perhaps his comments are not enough understood by the colleagues. DISCUSSION The value of technological tools such as virtual learning environments is not to replace the role of the teacher, but enhance the distributed teaching presence, creating a context that promotes the understanding and development of growing significant algebraic knowledge. In our study we introduced a theoretical tool called “educational profile influence” that served to explain how evolve the interactions in each task as it is in the example. Content categories (as we see in our example in table 2) also were helpful to analyze if the interactions are focused on certain aspects of problem solving activity. Such tools provide the possibility to understand how the interactions relate the educational profile with algebraic content issues and strategies. If we look not only the example, but the global amount of results and problems, we observe that electronic forums act as agents of change that affected the teaching role and in the relationships and interactions established in the classroom. In particular, highest profile students correspond to the highest problem solving contributions. We also found that in almost all the tasks, electronic forums enable individual and collective construction of objects and processes in the learning of algebra (Royo, 2012), and improve generalization attitudes, similar to face-to-face conversations. Interlocution interactions yield different outcomes and influence the development of mathematical ideas and reasoning in diverse ways . Its use allows: (a) to facilitate guided construction of objects and processes in the learning of algebra (as generalized properties or inquiry methods), encouraging ideas partially developed and without rushing off to get results; (b) to promote the cognitive and linguistic capacities of the students, encouraging them to reflect on what they learn and to express what they know; (c) to develop the communication of mathematical ideas. (d) to develop an increasing use of formal language from problematic situations. (e) to stimulate the ability to share and compare ideas; (f) to stimulate joint construction of meanings; (f) to set the thread around which other activities are developed that also become part of the teaching and learning process. Some of these results are consistent to which were considered in other geometrical problem solving e-studies (Murillo & Marcos, 2011). It can be expected that all students participate in forums significantly, although as with all educational action/profile, some cases require guidance or teaching intervention to adjust the conditions of participation. In didactic programming it may be convenient to include participation in forums such as evaluation activity. The use of the forums in the joint resolution of algebraic problems facilitated reflection during time, access to
92
different points of view or contributions, review of what you try to communicate, raise questions and request or offer help or clarification. Qualitative analysis shows that generalization methods are close to which it’s regularly presented in face-to-face classrooms and spontaneously emerges a need for revealing the importance of exchanging the representations not always usual in face-to-face classrooms. These features have also been evaluated positively by the students and the teacher. In addition, the students read messages from other participants even when they have not spoken with contributions. At the end of the forum, it is important to provide a new step to be seen to be appreciated transfer programming made. CONCLUSIONS Cognitive and content analysis was not fully explained in this paper, but we observed that almost all students have participated in the forums in a significant way introducing algebraic contributions (Royo, 2012). Although it is not usual, if any student is not involved in a forum with interventions, you would expect that their participation consist of reading the contributions of others. When it doesn’t, there are external causes that should be considered (absence…). Or maybe there are grounds which require teacher intervention. We have seen that at the start of the forums the largest number of contributions raise questions or request clarification, but later on, there are more and more algebraic features present during the conversation. Interactional data corroborate the findings of authors who point out that these instruments allow reflection during the time necessary, giving opportunities to have access to different points of view or contributions of the members of the group, or review what you try to communicate before sending it. They combine features of spoken and written discourse which can facilitate collective learning (Murillo & Marcos, 2011). Comparing the results presented here with the global research study, we have seen that with 13-14 years old students, the use of electronic forums has been compatible and effective when combined with face-to-face classroom methods. This leads to question the asynchronous use that is usually given to these tools. It makes emerging features of the electronic speeches while synchronous (DES) and asynchronous (DEA) which are combined in a peculiar way offering features that should be considered: If treated properly in the school context, they allow overcoming some difficult or limiting aspects of one and other speeches when performed separately, as it was observed in other subjects (Coll, Mauri, & Onrubia, 2012). According to global data for all the problems during the broader study (Royo, 2012), the number of contributions with a focus on the algebraic content is significantly less than the contributions with a focus on the relationship with other participants. However, the ratio varies significantly depending on the problem that it was discussed in the Forum. We found enough evidences to tell that the interlocutions observed support the reflective development of the participants’ mathematical ideas and
93
reasoning (Bairral & Powell, 2013) sharing multiple unexpected representations as manipulatives (not related to web environment, and usually presented inside the task). Because of lack of space, we don’t explain here the results of the achieved scaffolding process (Anderson, 2001) built in the environment. This study also present an example contributing to describe some values of using technological resources for analyzing the role of interactions in teaching practice for teacher training preparation of future Secondary Mathematics teachers. ACKNOWLEDGMENT This work was partially funded by the project I+D+I EDU2012-32644 of the Ministry of Science and Competitivity of Spain. We also receive funds from GREAV-ARCE 2014.
REFERENCES Ainley, J., & Luntley, M. (2007). The Role of Attention in Expert Classroom Practice. Journal of Mathematical Teacher Education, 10, 3-22. Anderson, T. (2001). Teaching in an online learning context. In T. Anderson (Ed.). The theory and Practice of Online Learning. (pp. 343-365). Athabasca, Canada: Athabasca University Press. Bairral, M. & Giménez, J. (2004). Diversity of geometric practices in virtual discussion groups. In Proceedings of PME 28, vol. I, p. 281. Bairral, M & Powell, A. (2013) Interlocution among problem solvers collaborating online: a case study with prospective teachers in Pro-Posições v. 24, 1(70) jan./abr.,1-16. Borba, M., Vilareal, M. (2005) Humans-with-Media and the Reorganization of Mathematical Thinking. New York, NY: Springer. Coll, C., Engel, A. & Bustos, A. (2009). Distributed Teaching Presence and Participants’Activity Profiles: a theoretical approach to the structural analysis of Asynchronous Learning Networks. European Journal of Education, 44(4), 521-538. Coll, C., Mauri, T., & Onrubia, J. (2012). El papel del profesor en las redes asíncronas de aprendizaje. Departamento de Psicología Evolutiva y de la Educación. Facultad de Psicología. Universidad de Barcelona. Cobb, P., Boifi, A., McClain, K., & Whitenack, J. (1997). Reflective Discourse and Collective Reflection. Journal for Research in Mathematics Education, 28(3), 258277. Gravemeijer, K (2002). Emergent modeling as the basis for an instructional sequence on data analysis, In B. Phillips (Ed.), Developing a Statistically Literate Society. Proceedings of the International Conference on Teaching Statistics [CD-ROM]. Cape Town, South-Africa, July 7–12.
94
Jonanssen, D. (2002). Engaging and supporting problem solving in online learning. The quarterly Review on Distance Education, 3(1), 1-13. Mason, J., Graham, A., Pimm, D., & Gowar, N. (1985). Routes to Roots of Algebra. Milton Keynes: The Open University. Murillo, J., & Marcos, G. (2011). Un modelo para potenciar y analizar las competencias geométricas y comunicativas en un entorno interactivo de aprendizaje. Enseñanza de las ciencias: revista de investigación y experiencias didácticas, 27(2), 241-256. Rojano, T. (2003). Incorporación de entornos tecnológicos de aprendizaje a la cultura escolar: proyecto de innovación educativa en matemáticas y ciencias en escuelas secundarias públicas de México. Revista Ibeoramericana de Educación, 33, 135165. Royo, P. (2012). Coconstrucción de conocimiento algebraico en el primer ciclo de la ESO mediante la participación en foros de conversación electrónicos (Unpublished PhD Thesis). Universitat de Girona. Royo, P. & Giménez, J. (2008). The use of virtual environments for algebraic coconstruction. In S. Turnau (Coord.), Handbook of mathematics teaching improvement: professional practices that address PISA (pp. 75-82). Kraków: University of Rzeszów.
95
PRESERVICE HIGH SCHOOL TEACHERS’ CONSTRUCTION AND EXPLORATION OF DYNAMIC MODELS OF VARIATION PHENOMENA Manuel Santos-Trigo*, Matías Camacho-Machín**, Carmen Olvera-Martínez* * Cinvestav – IPN, ** University of la Laguna, Spain
[email protected],
[email protected],
[email protected] This study aims to analyse and document ways of reasoning and sense making activities that prospective high school teachers developed as a result of working on problem solving sessions that enhanced the use of digital tools. To what extent do prospective high school teachers develop knowledge, resources, and a disposition to engage in reasoning and sense making activities in problem solving sessions that foster the use of technology? How does the participants’ tool appropriation process take place and shape their problem solving behaviours and disposition to use the tools? Participants recognized and valued the use of tools affordances to construct and explore dynamically the tasks. Thus, they relied on a set of heuristics (measuring attributes, dragging or finding loci) to explore, and interpret the tasks solution. INTRODUCTION The significant developments and increasing availability of digital technologies have opened up new routes for individuals to participate and reflect on science and society issues. In education, technology is challenging traditional curriculum proposals and ways to foster and assess students’ learning. Dick & Hollebrands (2011) recognize that “technology is an integral part of modern society and the workplace… But while mathematics has been an indispensable tool for advancing research and development of new technologies, the mathematics classroom itself has been slow to take advantages of using technology in the service of advancing mathematics learning” (p. xi). Recently, main institutions in the USA have launched an online-learning experience that includes online courses and a platform to investigate how the use of technology can transform learning (www.edx.org). The core issue in mathematics education is to analyze the extent to which the systematic use of several digital technologies offers learners new opportunities to understand and develop mathematical knowledge. Hoyles & Noss (2008) suggest that the incorporation of technologies in the students’ mathematical learning implies discussing what types of transformations bring their use to the mathematical knowledge: “[The uses of] digital technologies disrupt many taken-for-granted aspects of what it means to think, explain and prove mathematically and to express relationships in different ways (p. 87). Thus, it becomes important to explain what type of mathematical activities including ways of reasoning learners develop as a result of using digital tools during students’ learning experiences. In this study, we focus on analyzing ways in which a group of nine prospective high school 96
Carreira, S., Amado, N., Jones, K., & Jacinto, H. (Eds.) (2014). Proceedings of the Problem@Web International Conference: Technology, creativity and affect in mathematical problem solving. Faro, Portugal: Universidade do Algarve.
teachers develops and uses technological knowledge (tools appropriation) to construct and extend both subject and didactical knowledge. Specifically, we analysed the participants problem solving approaches when they solve a task that involved modelling a variation phenomenon. In this context, they construct cognitive schemata to transform a technological artifact into a useful instrument to represent, explore, and solve mathematical tasks or problems. CONCEPTUAL FRAMEWORK: FOCUS ON REASONING AND SENSE MAKING Prospective high school teachers need to construct a broad conceptualization of mathematics to frame learning activities within contexts that involve dealing with daily problems (mathematics for life); facing and developing problem solving skills (mathematics for the workplace); and developing ways of thinking consistent with mathematics practices and technological developments. The National Council of Teachers of Mathematics (NCTM) (2009) proposes to focus on reasoning and sense making activities as the foundations and cornerstone of the high school mathematics curriculum and its implementation: “…[R]easoning can be thought of as the process of drawing conclusions on the basis of evidence or stated assumptions” (p. 4). It is also recognized that reasoning in mathematics can take many forms ranging from informal or empirical explanations to formal justifications and proofs. Sense making is a key activity for learners to develop conceptual comprehension and problem solving proficiency: “We define sense making as developing understanding of a situation, context, or concept by connecting it with existing knowledge” (NCTM, 2009, p. 4). Thus, reasoning and sense making activities are essential for learners to develop and exhibit interrelated mathematical processes such as problem solving, representations, and communication while they develop mathematical concepts or tasks. Schoenfeld (2009) reviewed the NCTM Focus in High School Mathematics: Reasoning and sense making document, and pointed out that the examples discussed throughout it are useful for teachers to illustrate ways to approach the high school content and to organize the students’ classroom interactions: “…the mathematics that emerges seems reasoned and reasonable, rather than arbitrary”. He goes on to say that the reasoning and sense making approach is consistent with his definition of teaching for problem solving: “The mathematics studied should emerge as a reasoned and reasonable, rather than arbitrary” (p. 170). How can we frame the systematic use of digital technology in mathematics instruction that focuses on a reasoning and sense making approach? Delving into this question involves paying attention to both: The appropriation process shown by learners to transform an artefact or device into an instrument to comprehend concepts and represent and solve problems (Trouche, 2004); and to characterize ways of reasoning that learners develop as a result of using particular tools. “Using technology to display multiple representations of the same problem can aid in making connections…When technology allows multiple 97
representations to be linked dynamically, it can provide new opportunities for students to take mathematically meaningful actions and immediately see mathematically meaningful consequences—fertile ground for sense-making and reasoning activities” (NCTM, 2009, p. 14). Similarly, Dick & Hollebrands (2011) pointed out the importance for students to use technology as a means to foster problem-solving habits during the entire solution process that involves: Analyzing a problem: identifying which technology tools are appropriate to use and when to use them Implementing a strategy: making purposeful use of the technology and monitoring progress toward a solution Seeking and using connections: especially looking across different representations Reflecting on a solution to a problem: considering the reasonableness of technologyderived results, recognizing the limitations of the technology, reconciling different approaches (both with and without technology), and interpreting the results in the con- text of the problem (Dick & Hollebrands, 2011, p. xiii)
Thus, to characterize the participants’ ways to approach the task, we focused on analysing ways of reasoning and sense making activities that emerge or the prospective teachers exhibit when they use systematically the tools in problem solving episodes that include task comprehension, design and implementation of a solution plan, connections and task extension, and looking back at the entire solution process (SantosTrigo & Camacho-Machín, 2009). METHODOLOGICAL COMPONENTS AND PROCEDURES Two main intertwined phases were relevant during the design and development of the study. One in which the research team examined the tasks in detail in order to identify different ways to represent, explore and solve each task. This phase provided information to identify potential questions to orient the participants’ approaches to the tasks (Sacristan et al., 2010). As result of this analysis, an implementation guide for each task was designed. The second phase involves the actual implementation of the tasks. Here, the participants worked on the tasks individually and as group. A. A prior analysis of the tasks. The research team worked on and discussed each task previous to its implementation. The goal was to identify different ways to represent and explore the problem that led us to the design of an implementation guide that was given to the participants. The guide includes ways to introduce the participants in the use of the tool, in this case the appropriation of a dynamic geometry environment (GeoGebra or Cabri-Geometry). The idea was that they could think of the tasks as learning platforms to engage in continuous mathematical reflections and discussions associated with different ways to approach and extend the tasks. Specially, it was important to show that routine tasks could be transformed into a series of problem solving activities that foster mathematical reflection (Santos-Trigo & CamachoMachín, 2009). An example of this task analysis is shown next: 98
Task statement (the rectangle task): ABCD is a rectangle, ̅̅̅̅ 𝐴𝐵 has a length of 6.5 cm, ̅̅̅̅ has a length of 4 cm. M is a point on segment 𝐴𝐵 ̅̅̅̅, N is a point on segment 𝐵𝐶 ̅̅̅̅ , P 𝐵𝐶 is a point on segment ̅̅̅̅ 𝐶𝐷, and Q is a point on segment ̅̅̅̅ 𝐷𝐴. In addition we have that ̅̅̅̅̅ ̅̅̅̅ ̅̅̅̅ ̅̅̅̅ 𝐴𝑀 = 𝐵𝑁 = 𝐶𝑃 = 𝐷𝑄. Where should point M be located in order for the quadrilateral MNPQ to have the minimum area possible? An Implementation Guide A dynamic approach using the GeoGebra or Cabri-Geometry software 1. Read the task statement individually and discuss with your partner (pairs work) key information that helps you make sense of the task. Use a dynamic software to draw the given rectangle by using different commands (perpendicular, rotation, circle, etc.). Construct a ̅̅̅̅ to generate a family of dynamic model in which you can move point M along segment AB inscribed quadrilaterals. 2. What properties do the inscribed quadrilaterals hold? Can point M be located on any point on segment̅̅̅̅̅ AB to draw the inscribed quadrilateral? Explain: what is the domain for M to always construct the quadrilateral? 3. Graph the area inscribed quadrilateral behavior by finding the locus of the point that relates ̅̅̅̅ to the corresponding quadrilateral area? What properties does the position of point M on AB the graphic area representation have? 4. Identify visually at what point on the graph the quadrilateral area reaches its minimum value? Is there any pattern associated with the position of point M, the lengths of quadrilateral sides, and the minimum area? Draw a table showing some values of segment ̅̅̅̅̅ AM and the corresponding quadrilateral area.
On the algebraic model 1. Is there any relationship between the area of the four triangles that appear in the corner of the figure (Figure 1), the area of the given rectangle and the area of the inscribed quadrilateral? Use a proper notation to identify the figures involved in the task representation.
Figure 3. Scheme for the algebraic model.
2. Find an expression for the area of quadrilateral MNPQ. Graph this expression that represents the area of quadrilateral MNPQ and discuss what type of properties it has. 3. Find the position of point M for which the quadrilateral area reaches its minimum. Compare this value with that previously obtained through the use of the software. 4. Change the dimensions of the initial rectangle to sides a & b and find the general model that describe the inscribed quadrilateral area. What is the value of ̅̅̅̅̅ AM for which the area of the inscribed quadrilateral gets its minimum value? What does that value tell you in terms of sides a & b of the rectangle? 5. Explore algebraically and dynamically a case in which the initial rectangle is changed to a parallelogram.
B. The participants and the tasks implementation. Nine prospective high school teachers worked on three hours weekly problem solving seminar during one semester. The seminar was part of master program to prepare high school teachers and involved both activities to extend their mathematical knowledge and to construct basis to teach 99
and to do research at the high school level. The participants’ background included five majors in mathematics and four in engineering and had little experience in the use of technology. The task that we discussed in this report was given to the participants in the last week of the course. A mathematics educator and two doctoral students coordinated the development of each session. In general terms, during the sessions the participants initially worked on each task individually and later in pairs, and some pairs’ work was also presented and discussed within the whole group. In this report, we focus on presenting and discussing what participants exhibited while working on the Rectangle Task discussed previously. The analysis of the participants’ cognitive behaviours was based on processing data that came from their computers’ file sent after each session, individual interviews and class observations. It is important to mention that our initial unit of analysis was to focus on the participants’ contribution as a whole or group; however, a close analysis of two cases (Anna and Daniel) was also included. In general terms, Anna and Daniel’s problem solving behaviours provide robust information regarding difficulties associated with the appropriation process of the tool in one case (Anna) and a clear appropriation in another case (Daniel). ANALYSIS OF THE PROBLEM SOLVING SESSIONS AND RESULTS To present main results found in this study, we first identify main approaches exhibited by the participants following the main points addressed in the implementation guide. A summary of each participant contribution is shown in Table 1. Later, we focus on the work of two participants (Anna and Daniel) who were judged to be representative of the group approaches to the task. In some cases we added some comments to emphasize the participants’ problem solving behaviours. All the participants were able to construct a dynamic model of the task. That is, they drew the rectangle using the compass (or circle) and polygon tools to set the corresponding dimensions. However, they showed differences in situating the mobile point that became the vertex that controls the inscribed quadrilateral. Table 1 shows main resources, strategies, and representations that the participants exhibited during the individual interaction with the task. We focus on the work of Anna and Daniel to address and analyse the group’s problem solving behaviours. ̅̅̅̅ and adjusted its length to 6.5 cm, drew The case of Anna. Anna drew segment 𝐴𝐵 perpendicular lines to segment ̅̅̅̅ 𝐴𝐵 from A and B to draw the rectangle. Then, she chose ̅̅̅̅ ̅̅̅̅̅ as a radius, she drew circles point M on side 𝐴𝐵 and with the length of segment 𝐴𝑀 with centres at B, C, and D. Points N, P, and Q are the vertices of the inscribed quadrilateral MNPQ (Figure 2). At this stage, she realized that when point M is moved to certain position the inscribed quadrilateral disappeared (when the length of segment ̅̅̅̅̅ is longer than 4). Then, she concluded that the domain for moving M must be [0, 𝐴𝑀 4]. However, she never redefined the initial domain for moving point M. She also observed that for different positions of point M the corresponding quadrilateral area changes as well. 100
Based on this information, Anna decided to represent the quadrilateral area variation ̅̅̅̅̅ to the x-axis and graphically. To this end, she transferred via a circle the length 𝐴𝑀 drew a circle with centre the origin and radius the area value. Then, she drew a perpendicular to x-axis passing by the intersection point of the circle with radius the ̅̅̅̅̅ and the x-axis. This perpendicular intersects the circle with radius the length of 𝐴𝑀 area value at K. With the software she traced the locus of point K when point M is moved along segment ̅̅̅̅ 𝐴𝐵 (Figure 3). In her interpretation of the graph, she never explained why she ignored part of the generated locus to affirm that the vertex of the parabola was the position where the inscribed quadrilateral reached minimum value. ̅̅̅̅̅ becomes 2.63 cm. That is, when length of segment 𝐴𝑀 Table 1. Main resources, strategies, and representations exhibited by the participants.
Dynamic model construction
Graphic representation through the locus of a point
Mobile point M on segment ̅̅̅̅ 𝐴𝐵 Daniel, Dalia, Nalleli, Oscar, Yanira Use of circles to transfer lengths and perpendiculars. Correct procedure Dalia, Marco, Yanira
An algebraic approach
Point M on a segment of length 4
Anna, Cesar, Marco
Ruben
Use point (x(M), area of MNPQ)
Transference measure command and perpendiculars
Daniel, Oscar, Nalleli
Ruben
Incorrect Anna, Cesar
Focusing on right triangles Use of Excel
Mobile point M on the rectangle border
Daniel, Marco, Ruben, Anna (with a mistake) Focusing on the area of the four right triangles, maximum area Daniel
Area of inscribed quadrilateral expressed algebraically Cesar, Dalia, Oscar, Nalleli, Yanira Representing the area of parallelogram MNPQ by subtracting the area of the four right triangles from the rectangle area (finding the minimum) Anna, Dalia, Cesar, Oscar, Marco, Nalleli, Ruben, Yanira.
Comment: To some extent, Anna showed some level of appropriation of the software that led her to represent the task; however, she lacks sense-making behaviours to initially relate the domain for moving point M (which she found it correctly) to the construction of the inscribed quadrilateral. The part of the graph that she does not interpret is generated when M is moved along the border instead of focusing on the particular domain [0, 4]. Then, she made a mistake to associate point K (intersection of circle with radius the area of the inscribed quadrilateral) as a point that relates the position of point M and the corresponding area of the inscribed quadrilateral. It is clear that the use of the tool requires that learners become engaged in monitoring or metacognitive behaviours to constantly interpret what is observed numerically and graphically.
101
Figure 2. Drawing the rectangle and the inscribed quadrilateral.
Figure 3. Representing the inscribed quadrilateral area variation graphically.
̅̅̅̅̅ and by Anna also approached the problem with Excel by assigning some values to 𝐴𝑀 finding the lengths of the hypotenuses of four right triangles formed at rectangle vertices. She found the area of the inscribed quadrilateral; however, she erroneously assumed that the quadrilateral was a rectangle (Figure 4). It seems that she visualized this figure in the representation she got through the software and never looked for its geometric properties. It is important to mention that Anna, in general terms, took important decisions based on what she thought the figures or graphs obtained through the use of the tools held; rather than reflecting on their actual mathematical properties. That is, the use of the tool provided her the means to affirm, for instance, that the inscribed quadrilateral in Figure 2 was a rectangle. It is interesting to observe that when Anna approached the task algebraically, she relied on Figure 5 to correctly express the area of the inscribe quadrilateral in terms of the areas of the initial rectangle and the area of the four right triangles. That is, she expressed the area of the inscribed quadrilateral as: AMNPQ = AABCD − 2AQAM − x(4−x)
x(6.5−x)
2AMBN . This led her to write: AMNPQ = 26 − 2( ) − 2( ) and AMNPQ = 2 2 2x 2 − 10.5x + 26. Then, she applied calculus procedures to get the minimum value of the function area. That is, she calculated 𝐴′𝑀𝑁𝑃𝑄 = 4𝑥 − 10.5 and she solved the 10.5
21
391
equation 0 = 4𝑥 − 10.5 to get 𝑥 = = and 𝑦 = ≈ 12.21. Similarly, she 4 8 32 approached the general case for a, b the rectangle dimensions to obtain the area 𝑎+𝑏 expression 𝐴𝑀𝑁𝑃𝑄 = 2𝑥 2 − (𝑎 + 𝑏)𝑥 + 𝑎𝑏 and the value of 𝑥 = in which the 4 function gets its minimum value. Comment: Anna’s participation and ways she worked on previous sessions let us to observe that she was fluent in working with the algebraic model of the tasks; however, even in this domain she did not reflect on what the results she got meant. For example, she never graphed the algebraic model to identify the minimum point on the graph and 102
more importantly to make sense of her results by contrasting her results with what she had done with the use of the software and Excel. In terms of the tool appropriation, it is important to mention that Anna was able to use proper commands to dynamically represent the task; however, she did not reflect on the position of point M to always generate the inscribed quadrilateral. Neither she was able to realize that the point used to generate the area locus did not correspond to the area value associated with the position of point M. That is, in accordance to the conceptual framework, Anna needs to focus on the development of ways to monitor her work and to constantly make sense of results, obtained through the use of the software, in terms of analysing its mathematical properties and pertinence. For example, she was not interested in explaining why the graph representation of the area variation achieved through the software differs from that obtained through Excel.
Figure 4. Approaching the problem with Excel.
Figure 5. Scheme used for the algebraic approach.
The Case of Daniel. Daniel initially constructed the dynamic model (using GeoGebra software) of the task by selecting on the plane the four vertices of the rectangle. He did this by directly writing on the input bar the coordinates ̅̅̅̅ and 𝐷(0,0), 𝐶(6.5,0), 𝐵(6.5,4) 𝑦 𝐴(0,4). Then, he chose point M on segment 𝐴𝐵 located the vertices M, N, P and Q of the inscribed quadrilateral. He transferred the ̅̅̅̅̅ to the other sides of the rectangle, and with the command Polygon, he drew length 𝐴𝑀 the inscribed quadrilateral. He defined point E (in the input bar) as (𝑥(𝑀), 𝑝𝑜𝑙𝑦𝑔𝑜𝑛2) which represents a point on the plane with coordinates the length of AM and its corresponding quadrilateral area. Then, he traced the locus of point E when point M is moved along segment ̅̅̅̅ 𝐴𝐵 (Figure 6). He reported that based on the graph of the function area there is a minimum value close to 2.6 with an area of 12.22 squared units. He identified and made explicit the segment that represent the domain for moving point M was 0 ≤ 𝑥 ≤ 4; and also provided an argument to affirm that the inscribed quadrilateral was a parallelogram. He also 103
constructed a table to explore the behaviour of the sum of areas of the right triangles formed at the rectangle vertices. Based on the table data, he identified the position of 𝑥 where such sum of the areas reaches its maximum value (Figure 7). The last column of table also showed when the inscribed quadrilateral gets its minimum area.
Figure 6. Daniel’s dynamic model of the task.
Figure 7. Approaching the problem with Excel (Daniel).
Daniel also approached the task algebraically in terms of finding where the area of the four right triangles formed on the rectangle got its maximum value. It is interesting to observe that Daniel focused his attention to finding the maximum area of the four right triangles rather than finding the minimum area of the inscribed quadrilateral. Both approaches are equivalent. To this end, he wrote: 𝐴𝑟𝑒𝑎 𝑜𝑓 𝑡ℎ𝑒 𝑡𝑟𝑖𝑎𝑛𝑔𝑙𝑒𝑠 = 𝑥(6.5−𝑥) 𝑥(4−𝑥) 2 +2 = 6.5𝑥 − 𝑥 2 + 4𝑥 − 𝑥 2 = 10.5𝑥 − 2𝑥 2 ; then, he calculated the 2 2 derivative of this expression 𝐴′ (𝑥) = 10.5 − 4𝑥 and he solved A’(x)= 0 to get 𝑥 = 2.625 as a critical point. Using the argument that 𝐴′′ (2.625) < 0, he concluded that the maximum value of the area function was at (2.625,13.78125). It is important to mention that Daniel graphed the algebraic model of the task and concluded that this graphic representation coincided with the one he obtained with the tool. Similarly, he approached the case where the dimensions of the initial rectangle were 𝑎 & 𝑏. Here, he found the area of the inscribed parallelogram by calculating the area of the rectangle (ab) and subtracting the area of the four right triangles, that is 𝐴𝑝 (𝑥) = 2𝑥 2 − (𝑎 + 𝑏)𝑥 + 𝑎𝑏. Then by using calculus procedures, he found the value x where 𝑎+𝑏 𝑎+𝑏 this function reaches its minimum value 𝑥 = whose area value is: 𝐴𝑝 ( ) = 6𝑎𝑏−(𝑎2 +𝑏2 )
4
4
. He also explored the case where the initial figure was a parallelogram and with the software found that shown in Figure 8. Daniel showed several cognitive behaviours through the development of the sessions and a clear disposition to go beyond particular results. 8
104
Figure 8. Case where the initial figure was a parallelogram.
Comment: Daniel’s approach to the task shows how the use of the tool becomes important to constantly analyse what is generated with the tool and the task conditions or statement. For example, focusing on the domain of the area function helped him generate the graphic representation of the area function within the context of the problem. Likewise, he shows an efficient use of the tools’ affordances to initially construct a point to generate the locus area and later to explore its behaviour through a table and algebraically. That is, he shows a robust and coordinated use of the tool to make sense of the tasks and to explain, contrast, and support results that emerge from dynamic, algebraic and empirical approaches to the task solution. In addition, the dynamic model of the tasks became for him an instrument to explore connections and general cases associated with the initial task. DISCUSSION OF RESULTS How can we interpret the participants’ work in terms of the reasoning and sense making conceptual framework sketched previously? Specifically, how did the finding or results of the study respond to initial research questions? It is observed that there appear differences in reasoning about the tasks when representing it dynamically and algebraically. Thus, reasoning with the tool involved focusing on ways to control the movement of a vertex of the inscribed quadrilateral to generate a family of them holding the required conditions. A key software affordance was dragging a point to generate a family of inscribed quadrilaterals. This let the participants to decide the dragging domain for the movable point and to analyse the interval in which the inscribed quadrilateral could be drawn. Then, the focus was on generating a graphic representation of the area variation of the family of inscribed quadrilaterals. This was achieved by relating the position of the moving point and the corresponding area of the inscribed quadrilaterals. That is, the area behaviour of this family of quadrilaterals was represented and explored geometrically without relying on the algebraic model. At this stage, the participants thought of the problem in terms of the software affordances since they relied on measuring distance between a vertex and the movable point, area of the corresponding quadrilateral, and the locus command to generate the graphic representation of the inscribed quadrilaterals. To complement the software 105
approach to the task, some students relied on a table to record the area behaviour of the inscribed quadrilateral. On the other hand, the construction of an algebraic model demanded that initially the participants focused on ways to express the area of the inscribed quadrilateral. The algebraic model of the task led them to use calculus procedures to find the point where the model reached its minimum value. Based on this model, some of the participants sketched its corresponding graphic representation. In general terms, the construction of a dynamic model of the problem provided the participants an opportunity to initially visualize the behaviour of embedded objects without having the corresponding algebraic model. Making sense of such objects behaviours requires paying attention to specific elements of the representation (domain of movable points, interpretation of the area graph, etc.) that later can be related to the algebraic model. That is, both approaches (software and paper and pencil) offered distinct opportunities for the participants to explore and interpret results. Regarding the second research question, the cases of Anna and Daniel showed different level of the tool appropriation which is manifested through what sense they made of the achieved representations and exploration of the task and results. For example, Anna tended to focus her attention to the use of the software commands without examining or interpreting what she gets in terms of the task conditions. For example, she didn’t even mention why the locus generated in Figure 3 included more elements than the graph of a parabola. She never questioned the domain for moving point M in her dynamic representation of the task. In general terms, she lacks resources to activate conceptual information to interpret and make sense of what she achieved through the software. That is, in order for her to efficiently use the software, she needed to constantly reflect on the extent to which the generated object was consistent with, for example, the results she got through the algebraic model. On the other hand, Daniel seemed to constantly monitor not only the task representation he obtained through the tool, but also contrasted his results with the algebraic and Excel approaches. In addition, he shows a robust appropriation of the tool when he showed a coordinated used of the software affordance throughout the representation, exploration of the task including ways to extend the initial task. The findings in this report provide useful information on how the learners’ tool appropriation goes hand in hand with their interpretation of software outcomes and the analysis of the algebraic model of the tasks. Thus, prospective teachers need to direct their attention not only to different ways to construct dynamic representations of mathematical tasks; but also to the development strategies that help them monitor and analyse the consistency and pertinence of results. CONCLUSIONS The systematic use of a dynamic geometry environment provides an opportunity for prospective teachers to develop resources and strategies to construct dynamic 106
representations of the task. Thus, dragging objects within the model, measuring object attributes, and finding objects loci became crucial affordances to identify invariants or to analyse loci behaviours. The participants recognized that the graphic representation of the phenomenon achieved through the tool offers visual and empirical information that later can be contrasted with the analysis of the corresponding algebraic model. In addition, the diversity of approaches shown to construct a dynamic model became important to contrast different levels of appropriation of the tools. For example, using sliders to represent the quadrilateral sides or to use the side bar to construct a point on the plane that represents the position of the movable vertex offers clear advantages to explore other family of quadrilaterals. In conclusion, all the participants recognized that the use of the tool to represent and explore the task not only demands to think of the task in terms of the software affordances; but also complement the ways of reasoning involved in algebraic approaches. ACKNOWLEDGEMENTS This report is part of the activities associated with two research projects: Plan Nacional I+D+I del MCIN, Ref. EDU2011-29328 and Conacyt-Mexico, Reference 168543. REFERENCES Dick, T. P. & Hollebrands, K. F. (2011). Focus in high school mathematics: Technology to support reasoning and sense making. Reston, VA: The NCTM. Hoyles, C. & Noss, R. (2008). Next steps in implementing Kaput’s research program. Educational Studies in Mathematics, 68, 85-97. NCTM (2009). Focus in high school mathematics reasoning and sense making. Reston, VA: NCTM. Sacristán, A.I., Calder, N., Rojano, T., Santos-Trigo, M., Friedlander, A. & Meissner H. (2010). The Influence and Shaping of Digital Technologies on the Learning and Learning Trajectories of Mathematical Concepts. In C. Hoyles & J. Lagrange (Eds.), Mathematics Education and Technology – Rethinking the Terrain: The 17th ICMI Study, (pp. 179-226). NY: Springer. Santos-Trigo, M. & Camacho-Machin, M. (2009). Towards the construction of a framework to deal with routine problems to foster mathematical inquiry. PRIMUS, 19(3), 260-279. Schoenfeld, A. H. (2009). An essay review of the NCTM high school curriculum project. Mathematics Teacher, 103(3), 168-171. Trouche, L. (2004). Managing the complexity of human/machine interactions in computerized learning environments: Guiding students’ command process through instrumental orchestrations. International Journal of Computers for Mathematical Learning, 9, 281–307.
107
THE ROLE OF USING TECHNOLOGY AND CREATIVITY IN DEVELOPING POSITIVE DISPOSITIONS TOWARD MATHEMATICAL PROBLEM SOLVING Mehmet Türegün, Luis Conde Barry University
[email protected],
[email protected] In this paper the connections among technology, creativity, and attitudes towards mathematical problem solving are examined. The perceptions of a group of in-service teachers regarding a creative mathematical problem solving activity with a particular application to estimating the area of irregularly shaped polygons are investigated. PURPOSE OF STUDY AND RESEARCH QUESTIONS The purpose of this study was to examine the individual perceptions that in-service teachers have regarding the use of tangrams, geoboard and graph paper activities in teaching mathematical problem solving and geometry. In order to gain a broader and deeper insight into our research questions, we gathered and analyzed qualitative data including, but not limited to, teachers’ reflective journal entries, questionnaires, and group discussions which took place during a semester-long graduate course focusing on early and middle school mathematical problem solving. The study aimed at answering the following research questions: What are the perceptions of in-service teachers’ regarding the use of tangrams and geoboard activities in teaching mathematical problem solving and geometry? More specifically, this study addressed the following question: What role, if any, does creativity and use of technology play in developing positive dispositions toward mathematical problem solving? BACKGROUND AND THEORETICAL FRAMEWORK In order to investigate and establish the connections among creativity, technology, and mathematical problem solving, we start out by examining several goals delineated by the National Council of Teachers of Mathematics (NCTM), and the mathematical practice standards described by the Common Core State Standards (CCSS) for mathematics education. Helping students develop skills in using proper geometric and mathematical vocabulary, in orienting, recognizing and identifying various shapes, and in discovering relationships among the 2-dimensional geometric shapes is considered to be an important goal of teaching early childhood mathematics (NCTM, 2003). The NCTM focal points based on various grade bands can be found at http://standards.nctm.org/document/chapter5/index.htm for grades 3-5, and http://standards.nctm.org/document/chapter6/index.htm for grades 6-8.
Carreira, S., Amado, N., Jones, K., & Jacinto, H. (Eds.) (2014). Proceedings of the Problem@Web International
108 Conference: Technology, creativity and affect in mathematical problem solving. Faro, Portugal: Universidade do Algarve.
The CCSS mathematical practices are listed at http://www.corestandards.org /Math/Practice. The NCTM focal points and the CCSS include, but not limited to, fluency, flexibility, uniqueness, precision, persistence, recognition of patterns, structures and geometric shapes, intuition, and imagination. Our framework is based on the NCTM Standards for Mathematics Education, which has the following strands: Number and Operations, Algebra, Geometry, Measurement, Data Analysis and Probability, Problem Solving, Reasoning and Proof, Communication, and Connections and Representation. Although the particular strand addressed in this paper is Geometry, which provides a means for describing analyzing and understandings shapes and structures, there are several connections of Geometry to other strands, such as Numbers and Operations, Measurement, Problem Solving, and Communication. The NCTM Standards for Mathematics Education do not list creativity explicitly as one of the strands of focus. Since the mid 1950s there has not been a unanimously agreed definition for creativity among the researchers in the field. However, the elements listed in the NCTM focal points and the CCSS are considered by many researchers as some of the fundamental components of creativity. As expected, intuition and imagination are intertwined with creativity. Imagination is especially powerful in solving problems involving shapes and forms. Even though teachers realize that creativity plays an important role in educating students, most teachers, over the years, have indicated to us that they need guidance and support in understanding how to systematically incorporate creativity into their mathematics classrooms and lesson plans. Over the years the NCTM Standards have been a strong advocate for the use of technology in teaching mathematics. Technology, especially with the advent of various mobile device features and numerous apps, has become an indispensible part of our daily lives. Since most of the students in our classrooms today have used the internet, smart phones, and various forms of social media from early on in their lives, they tend to process information, solve problems, interact with their surroundings, and, in essence, learn quite differently (Prensky, 2001). In order to keep the interest and accommodate the needs of our “Digital Native” students, we, as educators, may need to change the way we used to teach, which, for the most part, is based on how we were taught in a slow, sequential, linear, algorithmic, and prescriptive fashion. Generally speaking, our educational system in the United States has a relatively slow pace of change. However, advances in technology have enabled many educators, even the ones considered by Prensky (2001) as “Digital Immigrants”, to at least attempt to model the use of technology as a problem solving tool by increasingly using dynamic, interactive, and visual simulation/applet activities as effective instructional tools to facilitate explorations of concepts in their classrooms at all grade levels. As observed by the authors, as well as indicated by many researchers, attempts made by in-service teachers, especially the ones at the initial career stages, to use technology as a problem solving tool are, for the most part, limited to be haphazard approaches. In-service
109
teachers are in need of guidelines for planning and implementing activities using various forms of technology in teaching mathematical topics and concepts. In the next section, we describe, along with its historical background, a particular activity designed specifically with a focus on weaving a single curricular thread by using technology, infusing creativity and imparting positive dispositions toward mathematical problem solving among in-service teachers. METHODOLOGY A total of 13 in-service teachers, who were enrolled in a graduate level course focusing on early and middle school mathematical problem solving, participated in the study. The years of teaching experience for this group of 12 female and one male teacher ranged from three to 25 years at various grade levels from kindergarten to middle school grades. The ages of the group varied from 26 to 58 years. Although one or two of the teachers in the group were somewhat familiar with and have heard of tangrams, most of the teachers in the group had very little to no previous experience in incorporating tangrams into teaching mathematics and geometry in their respective classrooms. The particular activity, in which we developed to engage this group of in-service teachers, was based on one of the oldest Chinese puzzles/games known. Tangrams, as they are known in the West, are still used today by adults, as well as children. In our efforts to establish the connections among creativity, technology, and mathematical problem solving, we deemed the choice of tangrams to be an appropriate fit for the creativity component of the activity. The word tangram may have come from the Tang Dynasty (AD 618-906), which is one of the ruling families whose rule spanned three centuries of Chinese history. It is regarded by the Chinese as one of their most glorious periods, when the country was a single unified empire. It was an era of cultural refinement, territorial expansion and great prosperity. The word gram indicates a drawn or written message. A tangram originates from a large square, typically a four-inch by four-inch one, which is dissected into seven pieces of only three distinct shapes in various sizes (Bohning & Althouse, 1997). The seven pieces consist of two small triangles, one medium triangle, two large triangles, one square, and one parallelogram. Each piece is called a tan. In creating a picture, a figure, or different shapes of humans and animals, all seven pieces must be used. The pieces must touch, but not overlap. In using a tangram activity, we aim to foster creativity in school mathematics with an emphasis on critical thinking, and ability to analyze and detect patterns. As we articulate in this paper, the use of tangrams also may allow teachers to explore ways in which students can be encouraged to re-invent or learn a theoretical result, or a theorem by way of discovery. Since one can arrange the seven pieces of the tangram in infinitely many different ways, the number of shapes one can create using the tangram is infinite. This particular feature of tangrams can provide an opportunity for educators to develop a creative activity for students in different levels of mathematics classes.
110
The medium triangle, the square, and the parallelogram are all twice the area of one of the small triangles. Each of the large triangles is four times the area of one of the small triangles. All the angles in these pieces are either right angles or angels of 45 or 135 degrees. All of the seven individual pieces of the tangram are convex polygons. However, one can easily use the seven pieces to create concave polygons with at least one angle being greater than a 180 degree angle. Although, as stated earlier, the number of different shapes that one can create by using the tangram is infinite, the number of convex polygons that one can create is only thirteen. In their paper, Wang and Hsiung (1942) provided an outline of a mathematical proof for this result, and listed all thirteen convex polygons. According to the Chinese tradition, when tangrams are used in telling stories, the storyteller arranges the seven pieces to create the shapes of particular characters in the story. As new characters or figures emerge in the story, the seven pieces are rearranged to represent the new characters or figures, as demonstrated in Grandfather Tang’s Story by Tompert (1990). The fox fairies in Grandfather Tang’s Story are an integral part of Chinese folklore. They are believed to not only have magical or supernatural powers of transformations, but also to live for eight hundred to a thousand years (Tompert, 1990). The story is geared specially toward elementary school students. However, it can easily be modified to be used in middle school mathematics or geometry classes. Although the popularity of tangrams has never rivaled the popularity levels of other more established Chinese puzzles/games, such as checkers and tic-tac-toe, arranging the tans into letters, numbers, various shapes for different animals, humans, or other creatures and figures can be fun, thought provoking, and a creative activity for students in all grade levels, and people in all ages (Read, 1965). Since tangrams provide a concrete way to learn physical knowledge in order to understand geometric concepts, they are considered to be a very useful manipulative in teaching mathematics and geometry (Bohning & Althouse, 1997). Several researchers concluded that the use of tangrams as a teaching tool to inspire observation, imagination, creativity and logical thinking among school children was a worthwhile effort, as well as to help school children develop skills in using proper geometric and mathematical vocabulary, in orienting, recognizing and identifying various shapes, and in discovering relationships among the 2-dimensional geometric shapes (NCTM, 2003; Olkun, Altun, & Smith, 2005; Russell & Bologna, 1982). For the infusion of technology into the activity, we considered many pieces of software and several applets. A wide variety of applets is available for the use of tangram puzzles. The two most commonly used such applets can be easily located at the following web sites: http://www.nctm.org/standards/content.aspx?id=25008, and http://www.cs.grinnell.edu/~kuipers/statsgames/Tangrams/. Taking into consideration a suggestion made by Chance & Rossman (2006) regarding the use of simulation activities, we decided to initially use a hands-on Geoboard model and graph paper for the tangram activity and directly involved in-service teachers in the process. Not only does the initial use of a hands-on, concrete Geoboard model provide participants and 111
students with an increased chance of ownership by allowing them to internalize the model, but it also lays a foundation for a better understanding of the process as we transition subsequently to using technology in the form of a Tangram applet. The ownership component plays an important role in teaching. When a student creates or helps create a task, or an activity, or a problem to be solved, the subsequent ownership component potentially may contribute to the students’ intrinsic motivation. It is also important to note here that using hands-on models, such as the Geoboards and other concrete materials, help students, who are especially in the lower grade levels, improve their dexterity. Similarly, several research studies have indicated that hands-on models and activities also provide best practices and learning experiences for students with learning disabilities. Through a Concrete-Representational-Abstract (CRA) instructional approach, students can experience the concrete stages of working with Tangrams. Learning Disabled (LD) students, who learn basic mathematical facts with the CRA instructional approach, show improvements in acquisition and retention of mathematical concepts (Miller & Mercer, 1993). CRA also supports conceptual understanding of underlying mathematical concepts before learning “rules,” that is, moving from a model with concrete materials to an abstract representation. Even though the CRA approaches are geared toward LD students, they proved to be effective for non-LD students in helping them gain an understanding of the mathematical concepts/skills that they are in the process of learning. Teaching mathematics through the CRA sequence of instruction has abundant support for its effectiveness for students with LD (Harris, Miller & Mercer, 1995; Mercer, Jordan, & Miller, 1993; Mercer & Mercer, 1998; Peterson, Mercer, & O’Shea, 1988) as well as for non-LD students (Barrody, 1987; Kennedy & Tipps, 1998; Van DeWalle, 1994). When LD students are allowed to first develop a concrete understanding of a mathematical concept and skill, they are more likely to perform that mathematical skill and develop the conceptual understanding of the mathematical topic at the abstract level. In light of recommendations to initially use a concrete model, a geoboard model along with graph paper was used as an aid in teaching basic geometric concepts and in developing conceptual understanding of area and perimeter, as well as improving communication skills, sharing ideas, and using mathematical vocabulary. Next, we would like to establish a connection between the Tangram puzzle and Geoboard model in order to combine the two together in creating one cohesive unit/activity to let inservice teachers discover Pick’s Theorem. Georg Alexander Pick was born in 1859 in Vienna, and according to Grünbaum and Shepard (1993), died around 1943 in Theresienstadt. The theorem was first published in 1899, but according to Steinhaus (1999), was not brought to broad attention until 1969. The theorem yields a very simple, yet elegant, formula for the area of polygons without self-intersection. The theorem is applicable to polygons with vertices located at the nodes of a square grid or on a lattice, as in the case of a geoboard model. The nodes are spaced at a unit distance from their immediate neighbors in all four main directions, except the diagonals. 112
Although the resultant formula from Pick’s Theorem does not require mathematical proficiency beyond the middle school grade levels, Pick’s formula can be shown to be equivalent to the Euler’s formula in complex analysis using trigonometric and exponential functions (Funkenbusch, 1974). The proof of the theorem is beyond the mathematical sophistication of early and middle school students. It is, therefore, more appropriate to lead the early and middle school students to discover the result of the theorem, rather than having them construct a proof of the theorem. A statement of the Pick’s Theorem can be given as follows. Let P be a lattice polygon. Assume that there are I(P) lattice points in the interior of the polygon P. Let B(P) be the number of lattice points on the boundary of the polygon P. Furthermore, let A(P) denote the area of the polygon P. Then, the area of the polygon P can be expressed by the following equation. A(P) = I (P) + B(P)/2 – 1 The result can be verified by using a geoboard model or an Applet. For example, one can use an online variant of a geoboard applet located on the NCTM website at http://www.nctm.org/standards/content.aspx?id=25008 to verify the above formula. Figure 1 renders a picture of Geoboards and Tangrams as they are superimposed over each other from the NCTM Geoboard applet at http://www.nctm.org/standards/ content.aspx?id=25008.
Figure 1. Creating polygons using the NCTM’s Geoboard Applet.
Table 1 was constructed by using the NCTM Geoboard Applet in Figure 1, or using a concrete Geoboard model, with one square grid corresponding to an area of a unit square. The values given in Table 1 can be identified by examining Figure 1 for the triangles, square, and the parallelogram. Table 1. The relationship among the number of interior points, boundary points, and the area. Polygon P Small Triangle Medium Triangle Large Triangle Square Parallelogram
I(P) 0 0 1 1 0
B(P) 4 6 8 4 6
B(P)/2 2 3 4 2 3
A(P) 1 2 4 2 2 113
Examining the examples used in constructing Table 1, one may observe certain patterns emerging. Once the relationships among the number of interior points, number of boundary points, the number of boundary points divided by two (if necessary), and the area are examined, the re-discovery of the formula resulting from Pick’s Theorem can become possible. Depending on the level of students, helpful suggestions during the re-discovery process may include using Geoboard to create and explore all possible areas for polygons that contain only 3 boundary points. Then, one may want to start by investigating polygons that have 3 boundary points and no interior points, followed by 3 boundary points and 1 interior point, 3 boundary points and 2 interior points, and so on. Subsequently, one can move onto investigating polygons having 4, 5, and 6 boundary points in a similar fashion. Once the findings are organized in a table similar to Table 1, then, one may look for patterns in the table to help calculate the areas of other polygons. If students have trouble finding a formula that works for all polygons, the teacher may encourage them to consider the patterns formed by the data, and the types of numbers (i.e., integer, rational, etc.) that appear in the different columns of the tables created.
Figure 2. Creating figures or irregularly shaped polygons using the NCTM’s Tangram Applet.
In order to foster creativity, teachers can ask students to arrange the tans into letters, numbers, human figures, shapes of different animals, and other creatures or figures of their own creations. Such a guided example is given in Figure 2. The application of Pick’s Theorem to these different irregularly shaped polygons provides a means for students not only to verify the resultant formula further, but also encourages them to describe, analyze and understand shapes and structures, and allows an opportunity to make connections to other NCTM strands, such as Numbers and Operations, Measurement, Problem Solving, and Communication. Inspiring observation, encouraging fluency, flexibility, uniqueness, precision and persistence, developing ability to recognize patterns, structures and geometric shapes, and fostering intuition and imagination are also attended during the processes we described above. As an extension, one may obtain an estimate for the area of an irregularly shaped portion of a map by using Pick’s Theorem. This extension initially involves drawing a grid on a transparent paper to scale, and then superimposing the grid over the map. One can 114
count the number of nodes inside and on the boundary of the map region, and then apply Pick's formula with the previously selected scale to obtain an estimate for the area. This particular application of Pick’s Theorem to estimating irregularly shaped areas comes from a real word application used in the forest industry (Grünbaum & Shepard, 1993). Based on the above described activities, we examined the in-service teachers’ reactions, dispositions, and reflections regarding the creativity and the use of technology in teaching of mathematical problem solving and geometry. To be used as the sources of our data, in addition to the reflective journal entries, questionnaires, and group discussions, several open-ended response prompts were given to the in-service teachers for their written feedback on the above described activities. These open-ended response prompts included, but not limited to, the following questions: “What did you learn from the activities using Tangrams and Geoboards?”; “What was your experience like?” and “What were your thoughts after participating in the Tangram and Geoboard activities?” This particular study analyzed the responses of the in-service teachers, and the results are reported in the next section. Techniques such as triangulation of a variety of data sources were employed in order to ensure and increase validity of the interpretation of the data. A form of simultaneous triangulation was achieved by using in class group discussions, feedback from collaborative activities, weekly journals of in-service teachers, and my own reflective journal (Murphy, 1989). These items were regular components of the course assessment and used to solicit in-service teachers’ thoughts, understandings, and experiences in various ideas, topics, and activities including, but not limited to, mathematical problem solving, discussed and used throughout the course. The analysis of qualitative data involved an ongoing, iterative process of constant comparison of data with an open coding technique as suggested by Glaser & Strauss (1967). This ongoing process of data analysis and emerging theme searching is nicely aligned with the reflection-action-reflection cycle, which is inherent in teacher education, and an important element of being a reflective practitioner, as described by Schön (1983). Initially a number of different categories of responses were assigned for the data generated from different data sources. Based on further analysis, common characteristics among categories were identified resulting in a consolidation of categories into fewer and more general categories of responses. RESULTS As a result of the analysis described above, several emergent categories, such as developing positive dispositions toward geometry and mathematical problem solving, cognitive dissonance, collaborative learning, and adaptability for different grade levels were identified. For example, the following comments by one of the in-service teachers indicated a typical observation of the positive dispositions developed by using the activity:
115
I found the experience very rewarding. We were motivated to keep going and challenge ourselves to complete complicated tangram shapes. Overall, I learned a tremendous amount in our last class. The most important thing I learned was that we can motivate our students in math by using manipulatives and activities like these. They promote critical thinking, motivate our students, and foster creativity in math.
The above comments of this particular in-service teacher also reflected the fact that these activities were useful in fostering creativity in teaching of mathematics, as well motivating students. Additionally, many in-service teachers realized the potential for interdisciplinary connections which can be explored, and subsequently established for their students. One of the in-service teachers stated: Tangrams are great manipulatives and have multiple purposes that can be used in all subject areas to create literary images. In Language Arts it can be used to create characters of a story and also to create scenes as well. They can be used in mathematics to depict geometry, calculate angles, fraction concepts, calculate area, perimeter, spatial awareness, construct polygons, and used to solve mathematical problems.
Most of the in-service teachers found the activities to be quite challenging and difficult. We, as educators, need to be aware of how much cognitive dissonance an individual student can withstand before disequilibrium becomes, as Dewey (1938) put it, a miseducative experience to eventually bring the educational process and development of students to a halt. We need to be attentive to establishing this delicate balance between dissonance and perseverance. The cognitive dissonance experienced by many in-service teachers was articulated often. For instance, one of the in-service teachers commented as follows: I learned a lot from doing the tangram activity. I learned about problem solving and perseverance. I wanted to quit so many times. It was frustrating and it took a lot of brain power to solve it. My experience during the tangram activity was challenging yet helpful. I am usually good at puzzles so I thought that it would be easy but it turned out to be hard. My experience during geoboard activity was actually very enjoyable. This was very difficult for me to wrap my head around. It was truly a battle of perseverance.
The socially constructed and negotiated meaning via group activities was another emergent theme. The comments similar to the following were widespread: I enjoyed trying to come up with the area vs. perimeter formula. While I was working with my partner I was able to eliminate operations that would not work, without testing. We bounced ideas off one another and hypothesized.
The comments regarding collaborative learning, as well as the following comments, reflected the value of engaging students and active learning approach, as opposed to a lecture-and-listen format. The Tangrams, is an amusing activity. This activity will keep students engaged as well as intrigued as to how rubber bands could make pictures. 116
Many in-service teachers recognized the suitability and adaptability of these activities for different grade levels. For example, the following comments by one of the inservice teachers indicated such a typical observation: The tangram and geoboard activities provided me with valuable insight on how I could tailor activities to suit my mathematical learners on all levels. I discovered that I can create activities that span the elementary classroom to that of college levels.
Another in-service teacher shared a similar sentiment and made the following comments regarding modifying the activities to make them kindergarten friendly. In addition to the figures, I learned mathematical equations that were useful to me. This activity was more exciting to me and it is something I would introduce to my kindergarten class. I would have to redirect the mathematical equations to make them kindergarten friendly and appropriate for the grade level. In order to do that I would ask, “How many pegs are touching the rubber band?”, “How many pegs are inside of the figure that are untouched?”, “How many pegs are in total on the board?”, and “How many pegs are on the board that were not used?” These questions can be used for counting in sequence, addition and subtraction.
One of the kindergarten teachers made the following comments on using these activities to help kindergarten students recognize and identify different shapes, number of sides and vertices of two-dimensional objects: I can incorporate the use of geoboards to teach shapes in my classroom. Students would be able to create the shapes with the use of the board and rubber bands. Students could also identify how many sides and corners shapes have.
In general, the results of the data analysis indicated that this group of in-service teachers recognized and appreciated the connections between fostering creativity and infusing technology in their classrooms in order to help students develop positive dispositions toward mathematical problem solving. CONCLUSIONS This study investigated the connections among technology, creativity, and attitudes toward mathematical problem solving. The perceptions and reflections of a group of in-service teachers regarding a creative mathematical problem solving activity with a particular application to estimating the areas of irregularly shaped polygons were examined. Although the conclusions from the study are based on a single, small group of in-service teachers, the study revealed some possible common preconceptions which should be examined closely and taken into consideration in order to promote creativity in mathematical problem solving. Aligned with the Five Core Propositions from National Board for Professional Teaching Standards from their website at http://www.nbpts.org/five-core-propositions, this particular group of in-service teachers was committed to think systematically about their practice and learn from experience to improve and enhance the way they teach. 117
As members of learning communities, in-service teachers showed a great interest in taking these activities back to their classrooms to their students, as well as to their fellow teachers and colleagues. As a sequel to this paper, we plan to develop a manuscript describing the implementation of these activities by this group of in-service teachers in their respective classrooms. The processes described in this study encourages teachers and students to describe, analyze and understand shapes and structures, and allows an opportunity to make connections to NCTM strands, such as Numbers and Operations, Measurement, Problem Solving, and Communication. Inspiring observation, encouraging fluency, flexibility, uniqueness, precision and persistence, developing ability to recognize patterns, structures and geometric shapes, and fostering intuition and imagination are also attended during the processes we described above. In general, the results of the analysis of responses produced supporting evidence for the need to provide environments rich in opportunities for in-service teachers to engage in creative activities in mathematical problem solving. Teaching methodologies more open to creative problem solving and supporting student construction of knowledge should be used in teaching of mathematics. REFERENCES Baroody, A. (1997). Children’s mathematical thinking. New York: Teachers College Press. Bohning, G., & Althouse, J. K. (1997). Using tangrams to teach geometry to young children. Early Childhood Education Journal, 24(4), 239-242. Chance B. L., & Rossman, A. J. (2006). Using simulation to teach and learn statistics. Paper presented at the 7th International Conference on Teaching Statistics (ICOTS7), Salvador, Bahai, Brazil. Retrieved from http://www.stat.auckland.ac.nz/~iase/ serj/publications/17/7E1_CHAN.pdf. Dewey, J. (1938). Experience and education. New York: Teachers College Press. Funkenbusch, W. W. (1974). From Euler’s Formula to Pick’s Formula Using an Edge Theorem. The American Mathematical Monthly, 81, 647-648. Glaser, B. G., & Strauss, A. L. (1967). The discovery of grounded theory: Strategies for qualitative research. New York: Aldine De Gruyter. Grünbaum, B. & Shepard, G. C. (1993). “Pick’s Theorem”. The American Mathematical Monthly, 100, 150-161. Harris, C. A., Miller, S. P., & Mercer, C.D. (1995). Teaching initial multiplication skills to students with disabilities in general education classrooms. Learning Disabilities Research & Practice, 10, 180-195 Kennedy, L. M., & Tipps, S. (1998). Guiding children’s learning of mathematics. Belmont, CA: Wadsworth. 118
Mercer, C. D., & Mercer, A.R. (1993). Teaching students with learning problems. Upper NY, NY: Macmillan Publishing Co. Mercer, C. D., Jordan, L., & Miller, S.P. (1994). Implications of constructivism for teaching math to students with moderate to mild disabilities. Journal of Special Education, 28, 290-306. Mercer, C.D., Jordan, L., & Miller, S.P. (1996). Constructivism math instruction for diverse learners. Learning Disabilities Research and Practice, 11, 147-156. Muller, S.P., & Mercer, C.D. (1993). Using data to learn about concrete-semi-concreteabstract instruction for students with math disabilities. Learning Disabilities Research and Practice, 8, 89-96. Murphy, S. A. (1989). Multiple triangulation: Applications in a program of nursing research. Nursing Research. 38(5), 294-297. NCTM. (2003). Developing Geometry-Understandings and Spatial Skills through Puzzlelike Problems with Tangrams. 4.4.2 Tangram Challenges. Retrieved from http://www.nctm.org/standards/content.aspx?id=25015. Olkun, S., Altun, A., and Smith, G. (2005). Computers and 2D geometric learning of Turkish fourth and fifth graders. British Journal of Educational Technology, 36(2), 317-326. Peterson, S. K., Mercer, C. D., & O’Shea, L. (1988). Teaching learning disabled students place value using the concrete to abstract sequence. Learning Disabilities Research, 4, 52-56. Prensky, M. (2001). “Digital Natives, Digital Immigrants Part 1”. On the Horizon, 9(5), 1-6. Read, R. C. (1965). Tangrams 330 Puzzles. New York, NY: Dover Publications, Inc. Russell, D.S., & Bologna, E.M. (1982). Teaching Geometry with Tangrams. Arithmetic Teacher, 30(2), 34-38. Tompert, A. (1990). Grandfather Tang’s Story. New York, NY: Crown Publishers, Inc. Schön, D. A. (1983). The reflective practitioner: How professionals think in action. New York, NY: Basic Books. Steinhaus, H. (1999). Mathematical Snapshots. New York, NY: Dover Publications, Inc. Wang, F. T., & Hsiung, C. (1942). “A Theorem on the Tangram”. American Mathematical Monthly, 49(9), 596-599.
119
HOW TO FOSTER CREATIVITY IN PROBLEM POSING AND PROBLEM SOLVING ACTIVITIES Cinzia Bonotto*, Lisa Dal Santo** * Department of Mathematics, University of Padova ** Istituto Comprensivo G. Ciscato, Malo (VI)
[email protected],
[email protected] The exploratory study presented here begins to investigate the relationship between problem-posing activities, supported by problem-solving activities, and creativity, when problem-posing process is implemented in meaningful situations involving the use of suitable real-life artifacts. The study is part of an ongoing research project based on teaching experiments consisting of a series of classroom activities in primary school, using suitable artifacts and interactive teaching methods in order to create a substantially modified teaching/learning environment. The focus is on fostering a mindful approach toward realistic mathematical modelling and problem solving, as well as a problem-posing attitude. INTRODUCTION In mathematics education, after over a decade of studies which have focused on problem solving, researchers have slowly begun to realize that developing the ability to pose mathematics problems is at least as important, educationally, as developing the ability to solve them (Stoyanova & Ellerton, 1996). Problem formulating should be viewed not only as a goal of instruction but also as a means of instruction. The experience of discovering and creating one’s own mathematics problems ought to be part of every student’s education. Instead, it is an experience few students have today – perhaps only if they are candidates for advanced degrees in mathematics (Kilpatrick, 1987, p.123).
The most frequently cited motivation for curricular and instructional interest in problem posing is its perceived potential value in assisting students to become better problem solvers. To explore the potential value of problem posing in assisting students to become better problem solvers, several studies have been set up to investigate the relationship between solving word problems and posing word problems (e.g., Cai & Hwang, 2002; Ellerton, 1986; Silver & Cai, 1996). In these studies students were typically asked to generate one or more problems (sometimes of different levels of difficulty) starting from a given situational description, a picture, or a number sentence, and, afterwards, the quality of the mathematical problems generated by the students was compared with their problem-solving capacities (Verschaffel et al., 2009). Besides ascertaining studies revealing the existence of a relationship between problem posing and solving, some design experiments have been realised wherein new 120 Carreira, S., Amado, N., Jones, K., & Jacinto, H. (Eds.) (2014). Proceedings of the Problem@Web International Conference: Technology, creativity and affect in mathematical problem solving. Faro, Portugal: Universidade do Algarve.
instructional approaches have been designed, implemented, and evaluated, in which problem posing is incorporated into the mathematics curriculum and used as a vehicle to improve students’ problem-solving ability (English, 1998; Verschaffel et al., 2000). In general, these latter studies revealed that having students engage in some activities related to problem posing (e.g., making up word problems according to mathematical stories) may have a positive influence not only on their word problem-posing abilities but also on their problem solving skills and their attitudes towards mathematical problem solving and mathematics in general (Verschaffel et al, 2009). From the studies on problem posing, we can conclude that this activity has a potential value in assessing and improving children’s problem-solving capacities. However, an important feature of the problem-posing research up to now is that it has investigated the relationship between problem posing and solving especially, and even almost exclusively, for standard word problems that can be unproblematically modelled by one or more operations with the numbers given in the problem statement (Verschaffel et al., 2009, p.149).
Stated differently, no research investigated this relationship for problematic situations, wherein students have to use their commonsense knowledge and real-world experience when trying to model and solve the problem (Verschaffel et al, 2000). Furthermore, problem posing is a form of creative activity that can operate within tasks involving structured “rich situations” in the Freudenthal sense (1991), including situations involving real-life artifacts and human interactions. However, also the nature of this relationship still remains unclear. For the previous reasons, the exploratory study presented here begins to investigate the relationship between problem-posing activities, supported by problem-solving activities, and creativity, when problem-posing process is implemented in situations involving the use of real-life artifacts, with their embedded mathematics. The study is part of an ongoing research project based on teaching experiments consisting of a series of classroom activities in upper elementary school, using suitable artifacts (Saxe, 1991) and interactive teaching methods in order to create a substantially modified teaching/learning environment. The focus is on fostering a mindful approach toward realistic mathematical modelling and problem solving, as well as a problem-posing attitude (Bonotto, 2009). The project aimed at showing how an extensive use of cultural or social artifacts and interactive teaching methods could be useful instruments in creating a new dialectic between school mathematics and the real world, by bringing students’ everyday-life experiences and informal reasoning into play. THEORETICAL FRAMEWORK Problem posing has been defined by researchers from different perspectives (Silver & Cai, 1996). The term problem posing has been used to refer both to the generation of new problems and to the reformulation of given problems (e.g. Dunker, 1945; Silver, 1994). Silver (1994) classified problem posing according to whether it takes place before (pre-solution), during (within-solution) or after (post-solution). In particular, the process of problem posing can be considered as a problem-solving process in which 121
the solution is ill defined, since there are many problems that could be posed (Silver, 1995). In this paper we shall consider mathematical problem posing as the process by which, on the basis of mathematical experience, students construct personal interpretations of concrete situations and formulate them as meaningful mathematical problems (Stoyanova & Ellerton, 1996). This process is favoured if suitable social or cultural artifacts are used in classroom activities. Problem posing, therefore, becomes an opportunity for interpretation and critical analysis of reality since: i) the students have to discern significant data from non significant data; ii) they must discover the relations between the data; iii) they must decide whether the information in their possession is sufficient to solve the problem; and iv) they have to investigate if the numerical data involved are numerically and/or contextually coherent. These activities, quite absent from today’s Italian school context, are typical also of mathematical modelling processes and can help students to prepare to cope with natural situations they will have to face out of school (Bonotto, 2009). Furthermore, there is a certain degree of agreement in recommending problem-posing and problem-solving activities to promote creative thinking in the students and assess it. Silver and other authors (Cai & Hwang, 2002; Silver, 1994; Silver & Cai, 2005; Yuan & Sriraman, 2010; Kontorovich et al., 2011) have linked problem posing skills with creativity, citing flexibility, fluency, and originality as creativity categories. In particular, Silver argued that creativity lies in the interplay between problem posing and problem solving: It is in this interplay of formulating, attempting to solve, reformulating, and eventually solving a problem that one sees creative activity. Both the process and the products of this activity can be evaluated in order to determine the extent to which creativity is evident. Among the features of this activity that one might examine [could be] the novelty of the problem formulation or the problem solution [...] (Silver, 1997).
Creativity has received much attention in the literature, particularly in relation to distinctions between two types of thought: productive (divergent thinking) and reproductive (convergent) thinking (Guilford, 1950). One of the main lines of research on creativity concerns exactly the distinction between these two types of thought. First, Guilford dealt with creativity and noted that IQ and creativity could not be overlapped. He therefore hypothesized that a person could be creative without exceptional intelligence and vice versa. Thus, creativity began to be recognized as an asset, even if present in different degrees and shapes, of each person. Guilford saw creative thinking as clearly involving what he categorized as divergent production. He broke down it into nine skills: sensitivity to problems, ideational fluency, flexibility of set, originality, the ability to synthesize, analytical skills, the ability to reorganize, span of ideational structure, and evaluating ability. All these skills influence each other and represent the related aspects of a dynamic and unified cognitive system. The main models that describe the mathematical creative process emphasize the importance of sensitivity to the problems (problem finding) and their resolution (problem solving). Problem 122
finding, in particular, may be associated with mathematical problem posing. Problemposing and problem-solving activities are therefore used by several authors to promote and evaluate creativity (Leung, 1997; Silver, 1997; Silver & Cai, 2005; Siswono, 2010; Sriraman, 2009; Torrance, 1966; Yuan & Sriraman, 2010). Silver (1997) argued that inquiry-oriented mathematics instruction, which includes problem-solving and problem-posing tasks and activities, could assist students to develop more creative approaches to mathematics. It is claimed that through the use of such tasks teachers can increase their students’ capacity with respect to the core dimensions of creativity, namely, fluency, flexibility, and originality. In a recent study, Kontorovich, Koichu, Leikin, and Berman (2011) used these parameters as indicators of creativity in students’ problem posing. Moreover, the authors suggest that students’ considerations of aptness, implied in the problem posing process, could serve as an other useful indicator of their creativity. We believe that the creative process in mathematics may be encouraged by the presence of particular situations, for example of semi-structured type. Semi-structured problemposing situations refer to ones in which students are provided with an open situation and are invited to explore the structure of that situation and to complete it by using knowledge, skills, concepts and relationships from their previous mathematical experiences (Stoyanova & Ellerton, 1996). The use of appropriate real life artifacts can help realize these situations that can become also “rich contexts” in the Freudenthal sense (1991). These artifacts, with their incorporated mathematics, can play a fundamental role in bringing students’ out-of-school reasoning experiences into play, by creating a new tension between school mathematics and everyday-life knowledge (Bonotto, 2009). The artifacts we introduced into classroom activities, for example supermarket bills, bottle and can labels, a weekly TV guide, the weather forecast from a newspaper, some menus of restaurants and pizzerias (see e.g. Bonotto 2005 and 2009), are materials, real or reproduced, which children typically meet in real-life situations. In this way we can offer the opportunity of making connections between the mathematics incorporated in real-life situations and school mathematics, which although closely related, are governed by different laws and principles. These artifacts are relevant and meaningful to children because they are part of their real life experience, offering significant references to concrete, or more concrete, situations. In this way we can enable children to keep their reasoning processes meaningful and to monitor their inferences (Bonotto, 2009). These artifacts may contain different codes, percentages, numerical expressions, and different quantities with their related units of measure, and hence are connected with other mathematical concepts and also other disciplines (chemistry, biology, geography, astronomy, etc.). It could be said that the artifacts are related to mathematics (and other disciplines) as far as one is able to find these relationships. From our experience, children confronted with this kind of activity also show flexibility and creativity in their reasoning processes by exploring, comparing, and selecting among different strategies. These strategies are often sensitive to the context 123
and number quantities involved and closer to the procedures emerging from out-ofschool mathematics practice (Bonotto, 2005). We believe that immersing students in situations which can be related to their own direct experience, and are more consistent with a sense-making disposition, allows them to deepen and broaden their understanding of the scope and usefulness of mathematics as well as learning ways of thinking mathematically that are supported by mathematizing situations (Bonotto, 2009). Furthermore, by asking children to select other cultural artifacts from their everyday life, to identify the embedded mathematical facts, to look for analogies and differences (e.g., different number representations), to generate problems (e.g., discover relationships between quantities), we can encourage children to recognize a great variety of situations as mathematical situations, or more precisely as mathematizable situations, since a great deal of mathematics is embedded in everyday life. Besides the use of suitable artifacts the teaching/learning environment designed and implemented in this study and present in other studies we have conducted (e.g. Bonotto, 2005 and 2009), is characterized by (i) the application of a variety of complementary, integrated and interactive instructional techniques (involving children’s own written descriptions of the methods they use, in pair work, whole-class discussion, and the drafting of a text by the whole class), and (ii) an attempt to establish a new classroom culture also through new socio-mathematical norms, in the sense of Yackel and Cobb (1996). THE STUDY The overall aim of this exploratory study was to examine the relationship between problem-posing and problem-solving activities and creativity, when problem-posing process is implemented in situations involving the use of real-life artifacts, with their embedded mathematics. In this study, Guilford’s characterization of creativity has been adopted. In particular the study sought to investigate:
124
the role of suitable artifacts as sources of stimulation for the problem posing process in semi-structured situations, the primary school students’ capacity to create and deal with mathematical problems (including open-ended problems), the potential that the problem posing activity has for identifying and stimulating creative thinking in mathematics, the potential that the problem solving activity has for fostering a reflection on a previous problem posing activity and on the nature of problems created by students themselves, the primary school students’ capacity to solve mathematical problems, to discuss their structure and to describe the reasoning behind the solutions they offered,
a method for analyzing the products of problem posing that the teacher could use in the classroom to identify and assess both the activity of problem posing itself and the creativity of the students.
This exploratory study involved four fifth-grade classes (10-11 years old) from two primary schools in northern Italy, for a total of 71 pupils. The study was carried out by Lisa Dal Santo in the presence of the official logic-mathematics teacher. The first primary school was located in an urban area situated within a few miles of the centre of a city. The children were already familiar with activities using cultural artifacts, group work and discussions. The second primary school was located in a mountainous area. The children were not already familiar with these types of activities, even though the teacher had once proposed a problem-posing activity where the situation was a drawing of the prices of different products in a shop. The average marks in mathematics of the students were classified into three categories: high, medium, and low. On the basis of this classification the two schools were not uniform; in particular, the average marks in mathematics of the second school’s pupils were mainly medium-high while the average marks obtained by pupils from the other school were medium-low. The artifact used was the page of a brochure containing: the special rates for groups visiting the Italian amusement park “Mirabilandia”, the menu and discounts applied, the cost for access to the beach, etc. This artifact was chosen considering that all students were already familiar with an amusement park because they had been to one. This page was full of information, including prices (some expressed by decimal numbers), percentages, and constraints on eligibility for the various offers. We wanted to motivate students by offering them a semi-structured situation as rich and contextualized as possible in order to permit them to use their extra-scholastic experience in the creation and resolution of problems. TEACHING EXPERIMENT The experiment consisted of three phases: (1) the presentation of the artifact used; (2) a problem-posing activity; (3) a problem-solving activity. The activities took place in three different days, a few days apart. The students worked individually for part (2); for part (3) they at first were divided in couples or in groups of three students and then participated in a collective discussion. Students could use the artifact and its summary during all three activities. The first phase, of about two hours, consisted in the analysis and synthesis of the artifact. This phase was preparatory to the problem-posing activity. After presenting the whole brochure, a copy of one of the pages was given to each student and then he/she was invited to write down everything they could see on that page. Following that, there was a discussion on the observations: the aim was to verify students’ understanding of the artifact and to create a summary of the mathematical concepts involved.
125
The second phase, lasting about an hour, consisted of an individual problem-posing activity in which the children had to create the greatest number of solvable mathematics problems (in a maximum time of 45-50 minutes), preferably of various degrees of difficulty, to bring to their partners in the other classroom. The children were not informed of the time limit in order to avoid them from experiencing anxiety. Rather, they were told that they would have plenty of time to do this activity and that problems would be collected when the majority of the students had finished. To allow for the pupils’ self-assessment, they were given a sheet of paper for their calculations and solutions to the problems they had invented. Then, four problems for the next problemsolving activity were selected from among all the problems that had been created. In every class the problems chosen were problems with insufficient data, problems with an incorrect data or articulated problems in order to favor a discussion amongst the students. The third phase, lasting about two hours, consisted of a problem-solving activity by students and ended with a collective discussion. The students were asked to solve problems, to write the procedure that they had used and to write considerations on the problem itself. Different problem solutions and ideas about problems structure that emerged during the discussion were compared and, at the end of the activity, a collective text summarizing the students’ conclusions was written. So at this phase, a reflection on the previous problem posing activity and on the nature of problems invented was favoured by problem solving activity. METHODOLOGY AND DATA ANALYSIS Data from the teaching experiment included the students’ written work, fields’ notes of classroom observations and audio recordings of the collective discussions. All of the problems created by the students were analyzed with respect to their quantity and quality. To analyze the type of problems invented we followed the methodology proposed by Leung and Silver (1997); as regards to the analysis of the text of the problems we referred to the research of Silver and Cai (1996) and Yuan and Sriraman (2010). The plausible mathematical problems (in the sense that they can apparently be solved, with no discrepant information, and with respect the conditions in the artifact) with sufficient data were analyzed with respect to their complexity, and were assessed from two perspectives: the first assessed the complexity of the solution and the second assessed the complexity of the text of the problem. With regard to the complexity of the solution, these mathematical problems were divided into multi-step, one-step and zero-step problems. With regard to the complexity of the text of the problems, plausible mathematical problems with sufficient data were divided into problems with a question and problems with more than one question. The latter, were divided in concatenated questions and non-concatenated questions. Furthermore, only the plausible mathematical problems with sufficient data were re-analyzed, this time, to evaluate their creativity. The criteria used to classify them were: the number and type of details 126
extrapolated from the artifact, the type of questions posed, and the added data included by the students. To evaluate their creativity in mathematics, three categories were taken into consideration— fluency, flexibility, and originality—as proposed by Guilford to define creativity, and as used in the tests by Torrance and in other studies such as that by Kontorovich, Koichu, Leikin, and Berman (2011). When considering the fluency of a problem, the total number of problems invented by the pupils of each school in a given time period, as well as the average number of problems created by each student, were taken into account. Flexibility, instead, refers to the number of different and pertinent ideas created in a given time period. In order to evaluate the flexibility of the students, the mathematical problems were categorized considering both the number of details present in the brochure (e.g., entrance fee, price of lunch, etc.) which were incorporated into the text of the problem posed, and the additional data introduced by the students (e.g., calculating the change due after a payment). Once the problems had been categorized in the above way, the various types of problems that occurred in each class were counted. The originality of the mathematical problems created by the students took into consideration the rareness of the problem compared to the others posed in each school. In order to evaluate the originality of a problem, it was considered original if it was posed by less than 10% of the pupils in each school (Yuan and Sriraman, 2010). SOME RESULTS AND COMMENTS A total of 63 students in both schools participated in the problem-posing phase and they created a total of 189 problems. Students from the first school invented 58 problems (57 were mathematical problems), while students from the second school invented 131 (all mathematical problems). More than half of the problems that were invented by the students are solvable mathematical problems (64% of the problems created by the pupils of the first school and 60% of those created by the pupils of the second school). Table 1 shows the main quantitative results of both schools: Table 1. The main quantitative results of both schools.
Category
First School
Second School
Non mathematical problem
1,72 %
0%
Implausible mathematical problem
18,97 %
29%
Plausible mathematical problem with insufficient data
8,62 %
10,69%
Plausible mathematical problem with sufficient data
63,79 %
60, 31%
127
Most of the problems created were similar to the standard ones used in schools, although there were some cases of creative and open-ended problems. Then, analyzing these solvable mathematical problems we have found that i) the 81% of the first school and the 75% of the second school are multi-step problems; ii) the 78% of the first school and the 73% of the second school are problems with a question. Regarding problems with more than one question, in the first school the 62% have concatenated questions, and about 43% in the second school. As far as creativity is concerned, the second school was more successful in all three categories used to assess performance (fluency, flexibility and originality). With regard to fluency, each student in the first school invented 2 problems on average, while each pupil of the second school invented 3 problems on average. With regard to flexibility, the problems created by the classes of the first school were divided into 11 categories, those of the second school into 16 categories. In evaluating originality, it was found that 3 original problems were created in the first school and 10 in the second school. Original problems include inverse problems, and problems containing almost all the information of the artifact. It was thus found that the students of the second school demonstrated better performance on the suggested problem-posing task, in terms of creativity indicators, than the students of the first school, even though the students from the first school were familiar with posing problems from artifacts from their past study. It should, however, be noted that the second school had more students with averages in the medium-high range in mathematics. This might suggest that there is a correlation between the creativity and the performance in mathematics; this aspect deserves to be investigated in a subsequent study. With regard to the problem-solving phase, this appears to be important and helpful in allowing a better understanding of the initial situation, fostering quality control of the problems created by the students themselves, and giving a starting point for analyzing the structure of problems. By solving the problems created by their peers, the students become able to analyze them in a more detached and critical way. For example, students reflected on what information was really important and what was not, and discovered that numerical information is not always the most important information contained in the text of a problem, as the following discussion illustrates: It’s Giulia’s birthday and she invited 9 people to her birthday party, but she didn’t benefit from the “pacchetto festa” (party package), how much did Giulia pay for her entrance?
Almost all of the students did not read the words of the problem question carefully, because a lot of students calculated the total and not only Giulia’s entrance cost. In fact the total number of people (9) in the problem was superfluous. The problems solved by the children of the first school allowed them to make estimate: the children have thought about what happens in everyday life in order to estimate the 128
possible solution of the problem. Presenting children problems with insufficient data has allowed them to better understand the artifact and the text of the problem itself. The results obtained, checked also in another study we conducted (see e.g. Bonotto, 2005 and 2009), show that an extensive use of suitable cultural artifacts, with their associated mathematics, can play a fundamental role in bringing students’ out-ofschool reasoning and experiences into play by creating a new dialectic between school mathematics and the real world. With regard to the artifact utilized, on the one hand it was particularly attractive inasmuch as it referred to an amusement park known to the children, while on the other hand it was also very dense with information. The latter aspect was desirable because it furnished conditions allowing students to formulate hypotheses regarding the various possibilities offered. Students were therefore able to create diverse problems with differing degrees of difficulty. However, the artifact also revealed some weak points: it was rather complicated in its language and presented some information only implicitly. Students, in fact, did not know some terms of everyday language (for example lunch voucher, one free entry every 10 entries) and several mathematical terms (for example minimum, at least). Despite the richness of variables and linguistic limits of the artifact, the majority of the pupils nevertheless succeeded in understanding it and in carrying out both the problemposing and problem-solving activities. Moreover, the brochure’s complexity improved lexical enrichment, favoured the development of interesting discussions (which we did not report here), and stimulated the students to ask themselves questions and formulate hypotheses, that is to “problematize the reality”. However, in order to have better performance on the problem-posing task in terms of the greater number of plausible problems, with more complex tests and concatenated questions, it proved to be important to structure, organize, and summarize the information present in the brochure. In fact, students who had previously performed this type of analysis outperformed the others in the problem-posing activity. With regard to this aspect, the first school students, who were already familiar with this type of activity, have done better analysis and synthesis of the artefact by producing fewer implausible problems. Instead, about one-third of the problems produced by the second school students were implausible problems. CONCLUSION AND OPEN PROBLEMS The real life artifact (also the computer, as well as other more recent multimedia instruments) reflects the complexity of reality and so it offers a rich setting for raising issues, asking questions and formulating hypotheses. When choosing an artifact it is necessary to evaluate its complexity, including the number of constraints and variables that arise. In fact, these factors can stimulate discussions, questions and the formulation of hypotheses, or can inhibit them.
129
It is interesting to reflect on the fact that in the study here presented there were good results for students accustomed to using real life artifacts (the classes from the first school) as well as those who have used them for the first time (the classes from the second school). This indicates that an artifact provides a useful context for the creation of problems and the mathematization of reality as a result of its accessibility to all students. As was shown in the research conducted by Lowrie (2002), during an open task such as a problem-posing activity, the responses of students reflect the kind of teaching practiced and classroom experiences. In fact, many mathematical problems invented by the students involved in the study were similar to those found in their textbooks. Nevertheless some students also produced some original problems, open problems, or problems that allowed for more than one solution. This highlights the fact that pupils are able to deal with open-ended tasks. Here two questions arise: how the teaching influences these results? How could we change the mathematics teaching in order to encourage the process to invented non-standard problems and to favour the creativity? Meanwhile, this experience shows the importance of combining the problem posing activity with the problem solving activity: the problem-solving phase, in fact, combined with group discussions, allowed students to reflect on different types of problems and explore new possibilities (e.g. suggesting that mathematical problems do not always require a numerical answer or a unique solution, and that there are problems which are not solvable). Furthermore, the results of the classroom discussion suggest that asking students to analyze the problems they have created facilitated their critical thinking because students felt free to discuss the validity of the problem, to consider different assumptions, and to decide whether a problem had been solved or not. In future research, we would like to investigate through further studies: i) the correlation between students’ academic performance in mathematics and their performance in the three categories considered to assess creativity (fluency, flexibility, and originality), ii) how classroom teaching practices and experiences influence the creativity processes, and iii) if the method to identify and assess the creativity in problem posing situations, developed in this study, could be exported (fully or in part) in problem solving situations. REFERENCES Bonotto, C. (2005). How informal out-of-school mathematics can help students make sense of formal in-school mathematics: the case of multiplying by decimal numbers. Mathematical Thinking and Learning. An Intern. Journal, 7(4), 313–344.
130
Bonotto, C. (2009). Working towards teaching realistic mathematical modelling and problem posing in Italian classrooms. In L. Verschaffel, B. Greer, W. Van Dooren, and S. Mukhopadhyay (Eds.), Words and worlds: Modelling verbal descriptions of situations (pp. 297–313), Rotterdam: Sense Publishers. Cai, J., and Hwang, S. (2002). Generalized and generative thinking in US and Chinese students’ mathematical problem solving and problem posing. Journal of Mathematical Behavior, 21(4), 401–421. Dunker, K. (1945). On problem-solving. Psychological Monographs, 58 (5, Whole No.270). Ellerton, N. F. (1986). Children’s made-up mathematics problems - a new perspective on talented mathematicians, Educational Studies in Mathematics, 17(3), 261–271. English, L. D. (1998). Children’s problem posing within formal and informal contexts. Journal for Research in Mathematics Education, 29(1), 83–106. Freudenthal, H. (1991). Revisiting mathematics education. China lectures. Dordrecht: Kluwer. Guilford, J. P. (1950). Creativity. The American Psychologist, 5(9), 444–454. Kilpatrick, J. (1987). Problem formulating: where do good problems come from? In A. H. Schoenfeld (Ed.), Cognitive science and mathematics education (pp. 123–147). Hillsdale, NJ: Lawrence Erlbaum Associates. Kontorovich, I., Koichu, B., Leikin, R., and Berman, A. (2011). Indicators of creativity in mathematical problem posing: How indicative are they? In M. Avotina, D. Bonka, H. Meissner, L. Sheffield, and E. Velikova (Eds.), Proceedings of the 6th International Conference Creativity in Mathematics Education and the Education of Gifted Students (pp. 120–125). Latvia: Latvia University. Leung, S. S. (1997). On the role of creative thinking in problem posing. Zentralblatt für Didaktik der Mathematik, 97(3), 81–85. Leung, S. S., and Silver, E. A. (1997). The role of task format, mathematics knowledge, and creative thinking on the arithmetic problem posing of prospective elementary school teachers. Mathematics Education Research Journal, 9(1), 5-24. Lowrie, T. (2002). Designing a framework for problem posing: young children generating open-ended tasks. Contemporary Issues in Early Childhood, 3(3), 354– 364. Saxe, G.B. (1991). Culture and cognitive development. Mahwah, NJ: Erlbaum. Silver, E.A. (1994). On mathematical problem posing. For the Learning of Mathematics, 14(1), 19–28. Silver, E.A. (1995). The nature and use of open problems in mathematics education: mathematical and pedagogical perspectives. Zentralblatt für Didaktik der Mathematik, 27(2), 67-72. 131
Silver, E. A. (1997). Fostering creativity through instruction rich in mathematical problem solving and problem posing. Zentralblatt für Didaktik der Mathematik, 29(3), 75–80. Silver, E. A., and Cai, J. (1996). An analysis of arithmetic problem posing by middle school students. Journal for Research in Mathematics Education, 27(5), 521–539. Silver, E. A., and Cai, J. (2005). Assessing students’ mathematical problem posing. Teaching Children Mathematics, 12(3), 129-135. Siswono, T.Y.E. (2010). Leveling students’ creative thinking in solving and posing mathematical problem. Indonesian Mathematical Society Journal on Mathematics Education, 1(1), 20–41. Sriraman, B. (2009). The characteristics of mathematical creativity. Zentralblatt für Didaktik der Mathematik, 41(1-2), 13–27. Stoyanova E., and Ellerton N. F. (1996). A framework for research into students’ problem posing in school mathematics. In P. C. Clarkson (Ed.), Technology in mathematics education (pp. 518–525), Mathematics Education Research Group of Australasia: The University of Melbourne. Torrance, E. P. (1966). Torrance tests of Creative Thinking. Princeton N.J.: Personal Press. Verschaffel, L., De Corte, E., Lowyck, J., Dhert, S., and Vandeput, L. (2000). Supporting mathematical problem solving and posing in upper elementary school children by means of Knowledge Forum. Deliverable of project No. 2017 CL-Net: Computer Supported Collaborative Learning Networks in Primary and Secondary Education. Verschaffel, L., Van Dooren, W., Chen L., and Stessens K. (2009). The relationship between posing and solving division-with-remainder problems among flemish upper elementary school children. In L. Verschaffel, B. Greer, W. Van Dooren, and S. Mukhopadhyay (Eds.), Words and worlds: Modelling verbal descriptions of situations (pp. 143–160), Rotterdam: Sense Publishers. Yackel, E., and Cobb, P. (1996). Classroom sociomathematical norms and intellectual autonomy. Journal for Research in Mathematics Education, 27(4), 458–477. Yuan X., and Sriraman B. (2010). An exploratory study of relationships between students’ creativity and mathematical problem posing abilities. In B. Sriraman, and K. Lee (Eds.), The elements of creativity and giftedness in mathematics (pp.5-28), Rotterdam: Sense Publishers.
132
MATHEMATICAL PROBLEMS IN BASIC EDUCATION Virginia Furlanetto, Maria Madalena Dullius, Italo Gabriel Neide Centro Universitário UNIVATES
[email protected],
[email protected],
[email protected] A major concern with respect to Basic Education in Brazil currently is how to improve the quality of teaching and learning. Aiming to contribute in this aspect, in the area of mathematics, we developed a research with the goal to investigate the possible influence of using distinct strategies to solve problems. This was applied with students of Basic Education when facing mathematical situations with the purpose to contribute for a satisfactory result. As a main result, we observed that the students started to make use of diversified problem solving strategies. INTRODUCTION Improving the quality of teaching and learning of Brazilian students is a recurring concern of teachers. Furthermore, mathematics courses are generally considered difficult by the students. The view of a perfect science, with equations and unique solutions, where memorization and mechanization in solving exercises predominates could be the cause of disappointment and evasion of the students. This factors can cause them to fail in mathematics courses, which seems to be so connected to our daily life and most professions. Thus, it becomes necessary to revise this process and discuss how problem solving can help in this issue. The National Curriculum Parameters (Parâmetros Curriculares Nacionais – PCNs) (Brasil, 1998, p. 40) indicate that, “in the processes of teaching and learning, concepts, ideas and mathematical methods should be approached by problems exploration”. The solution of these problems is presented in the PCNs as a purpose related to most of the suggested content for different stages of Basic Education. Considering that solving a problem involves understanding of what was proposed and the presentation of solutions, applying appropriate procedures, it is noteworthy that there are several ways to achieve a distinct result, i.e., numerous are the strategies that students can use in this process. In this context, we conducted the research presented here with the main goal “to explore the use of different strategies for solving mathematical problems with students of Basic Education and analyzing how these affect this process”. For this purpose, initially, several classes of 8th grade (students with approximately fourteen years old), from six public schools were invited to solve a selection of eight problems, whose solutions were analyzed from the perspective of different strategies that can be used. The intent of the initial data collection was to identify how students solve problems, which strategies they use and what is the amount of correct answers. Then, in one of the schools, meetings with students of 7th and 8th grades of elementary Carreira, S., Amado, N., Jones, K., & Jacinto, H. (Eds.) (2014). Proceedings of the Problem@Web International Conference: Technology, creativity and affect in mathematical problem solving. Faro, Portugal: Universidade do Algarve.
133
school were conducted. They faced mathematical problems and were encouraged to use different strategies for solving problems and sharing them. At the end, participants solved a new set of problems and participated in a semi-structured interview, which showed their opinions regarding the problem solving process and the use of differentiated strategies. In this paper we discuss the results of the intervention performed. THEORETICAL FRAMEWORK The theoretical assumptions guiding the development of this research are based on the approach of mathematics through problem solving focusing on the use of different strategies. The approach of mathematics through problem solving can contribute to the formation of more autonomous and critical citizens as the student becomes agent of their own learning, creating their methods and strategies for resolution in contrast to traditional methodologies, dominated by memorization and mechanization. According to the PCN's (Brasil, 1998), problem solving can be seen as the starting point of mathematical activity in comparison to the simple resolution procedures and the accumulation of information, since it enables the mobilization of knowledge and information management that are at reach of the students. Mathematics educators agree that the ability to solve problems is one of the main objectives of the teaching and learning process of mathematics. Dante (2000) points out that the working with mathematical problem solving can be the main way to achieve the goals of mathematics in the classroom, among them, “to make students think productively”. The author also mention that: More than ever we need active and participant people who must make quick decisions and, as far as possible, accurate. Thus, it is necessary to form mathematically literate citizens, who know how to solve, intelligently, their problems of commerce, economics, business administration, engineering, medicine, weather and other of daily life. And, for this, it is necessary that children have in their elementary mathematics curriculum problem solving as a substantial part, to develop in an early stage the ability of facing problem situations (Dante, 2000, p. 15).
As for problem solving, D'Ambrosio (1989) points out that often, students abandon the solving of a mathematical problem because they have not learned how to solve this type of question, i.e., they do not know the solution algorithm or the process that the teacher expects them to develop for that problem. According to the author, “students are missing a flexible solution and the courage to try alternatives, different ones proposed by teachers”. This kind of attitude can demonstrate apprehension on the part of those students to try different solutions from the proposed in the classroom, which inhibits the development of relevant features to civic education and to challenges of professions previously cited, such as creativity, autonomy and critical thinking. In this regard, Cavalcanti (2001, p. 126) points out that the appreciation of the strategies used: 134
[...] inhibits inappropriate attitudes toward problem solving, for example, quickly abandon a problem when the technique is not identified, expect anyone to solve, keep asking what is the operation that solves the situation, or to believe that it is not worth to think deeply to solve a problem.
In the understanding of Musser and Shaughnessy (1997, p. 188), the emphasis of the curriculum of mathematics in the old school was spent in the learning of algorithms, due to the strong dominance of arithmetic existing at the time; however, in the electronic age we live in, the priority should be the development and the use of algorithms to solve problems. The authors cite five strategies to solve problems that they deem appropriate to be addressed in schools: • Trial-and-error: application of relevant operations to the given information. Inferences and tests are performed to reach at a satisfactory result. • Patterns: resolution of particular cases, finding patterns that can be generalized. • Solve a simpler problem: resolution of a particular case or a temporary shift of a complicated problem for a short version, and may be accompanied by the use of a pattern. • Working in reverse: starting from the result of what must be proved, perform operations that undo the original or search propositions to deduce the goal. • Simulation: used when the solution of the problem involves conducting an experiment and to perform it is not practical. Dante (2009, p. 61) presents some of these strategies and also the “Reduce to the unit”, similar to “Solve a simpler problem”, which relates to calculate initially different units from those presented in the problem statement, not necessarily reducing the unit 1, but the one that the resolver think is most convenient. Cavalcanti (2001, p. 127) also cites the use of drawing “as a resource for interpretation of the problem and as a record of the solution strategy”, and the utilization of the conventional algorithm, i.e., the calculation related to the content involved in the problem as “one more possibility of resolution” (p. 143). Stancanelli (2001) introduced the use of tables as another possible strategy to organize data and solving problems. Solving problems using differentiated strategies may also be related to aspects involving creativity, defined by Gontijo (2006, p. 4) as: The ability to present numerous possibilities for appropriate solutions to a problem situation, so that they focus on distinct aspects of the problem and / or different ways to solve it, especially unusual ways (originality), both in situations requiring resolution and elaboration of problems as in situations that need the classification or organization of objects and / or mathematical elements in function of their properties and attributes, either textually, numerically, graphically or as a sequence of actions.
Research shows that one of the strategies most used by students in problem solving is the formal calculus (Dullius et al, 2011). However, the approach of mathematics 135
through problem solving, allowing the student to choose the path that he desires to achieve the solution, allows to go beyond the linearity of traditional education as the resolver can mobilize different knowledge to arrive at an answer. METODOLOGY The research was developed through a predominantly qualitative approach, because we believe that in addition to the view of the researcher, the necessity and importance of studying reality from the perspective of the researched subject. According to the technical procedures adopted for its development, the research was constituted of a study case that allows researchers, according to Yin (2010, p. 24), in retaining “the holistic and meaningful characteristics of real life events” and it was conducted by obtaining data from different sources of evidence. The context of research and development of the proposal were five public state schools, all members of the Projeto Observatório da Educação (Observatory of Education Project) in which this investigation is inserted, and a public municipal school, in which the first author teaches. Students from 8th grade in these schools were asked to solve eight problems extracted from the Matriz de Referência da Prova Brasil (Reference Matrix of Test Brazil) evaluative quality system of Basic Education in Brazil. The students were also instructed to describe the procedures and reasoning employed in order to analyze the most used strategies. The classification was developed from the categories: Drawing, Formal calculus, Tables, Trial and error, Organization of patterns, Working in reverse, Reduce to the unit. It was necessary the creation of an eighth category, which we called Elimination, with potential to be used in multiple-choice problems, wherein after the interpretation of the situation, the student can analyze the possible answers and discard, according to criteria established by him, some alternatives. We note that the categorization of the solutions submitted by students, both in the initial data collection, and in other stages of the research was based on our experience as teachers and researchers and in the interpretation from the theoretical framework studied. It is possible that another researcher use other forms of classification. We also emphasize that some resolutions were grouped into more than one category, because they consist of a mix of strategies. For analysis and illustration of the resolutions, the written material produced by the students was enumerated using A1 to designate the student 1, A2 for student 2 and so on. With this instrument of initial data collection we detected the predominance of Formal calculus as principal method of resolving most of the eight problems and, in some cases, associated with high rates of inefficiency, even exceeding 90%. Furthermore, it was also large the number of students who only marked the final answer, without no method development of solving problems. It was not possible to identify the reason. Concerned with this result, we were motivated to elaborate the second stage of the research. We developed an educational intervention aimed to stimulate students to 136
learn, create and use diverse strategies to solve mathematical problems, in the attempt to provide a possibility of to raise the level of success when students are facing mathematical problems. The educational intervention involved classes of 7th and 8th grades of a public school, a total of eleven students who voluntarily joined the proposal developed in extracurricular school time in a ten weekly meetings. Two of these students were considered dropouts because they have not participated in all meetings. The choice of the school was mainly because of the possibility of performing the intervention in extracurricular school time, not interfering in this way in the registry of content of the school curriculum. The educational intervention consisted of a teaching practice based on the use of different strategies for problem solving by students of Basic Education to verify if it has potential to contribute to the improvement of the process and, consequently, the quality of teaching and learning at this level of education. During these classes, where problems were proposed from Prova Brasil (Test Brazil), math olympics, textbooks, websites, etc.., we used the steps for solving problems posed by Polya (1995), stressing the importance of careful reading and identifying the unknown variable for a correct interpretation of the proposed situations. In this part of the process, discussions were held about the data problems and inquiries were also made to students in order to assist them in the interpretation. However, the focus of research was on the step corresponding to the establishment of a plan where we encourage the use of diverse strategies, sharing those that have been used by students in other classrooms/schools, or even those that arise in the class itself and also among researchers who assisted in developing the proposal. In the implementation phase of the plan, the idea was that students could still improve the strategy outlined, would add details and had examined carefully each step. Regarding to retrospect, it occurred in order to share and discuss the strategies used for each problem, leading the participants to detect which of the forms was demonstrated more effective. It is worth noting that during the meetings, were not introduced or explained contents involved, considering the intention of stimulating the search for alternative resolution strategies. In most of the meetings, students were organized in groups of two or three, sometimes chosen by themselves, sometimes through for technical or activity proposed by the teacher who led the pedagogical practice. In the next section we present some of the issues explored with examples of resolutions developed by students or groups, with considerations regarding the same. DATA ANAYSIS The problem shown in Figure 1 was solved by the group formed by A6 and A7 and generated several questions. The first difficulty was the interpretation of the problem, but after questions, students understood that the sequence of pieces should continue. 137
They noticed that the increase was four tiles for each piece, then they wrote beside each piece the number of tiles. After, they added all parts to reach 330 tiles, erasing the annotations concerning surplus parts they had written. When they exposed the resolution, I suggested the use of a table, where they could write, in the 3rd column, the total amount of tiles that make each piece in the sequence.
Figure 1. Problem proposed to A6 and A7 and solution using the strategy of Trial and error (Problem extracted from Haetinger et al (2008)).
In research performed about the strategies used by participants in a Math Olympiad, Dullius et al (2011) also detected the predominance of the same strategy in the resolutions presented to the same problem. The second problem (Figure 2) with the resolution proposed by A9 involved comparing fractions. It was correctly solved by the majority of students utilizing the strategy of drawing.
138
Figure 2. Problem two: solution and strategy of drawing utilized by A9 (Problem extracted from Brasil (2008a))
In the proposed solution the students transcribed the fractions, but they did not simplify it, they just drew them in the same sequence, confirming that the paths of “João” and “Pedro” were equal. Only two of them used the calculation, succeeding too. During the discussion it was mentioned to the students that, when solving each new problem, we can also use knowledge and strategies already used in old problems. Polya (1995, p. 40) suggests that “recalling previously resolved issues, which have the same or a similar unknown […], we have a good chance of starting in the right direction and we can devise a plan for a resolution”. In Figure 3, we show problem fifteen and the resolution proposed by A9. The chosen strategy was Trial and error and it was used correctly by all students. Some students associated this strategy with another one, the drawing, used to assist in the interpretation. According to Cavalcanti (2001), this is another possible strategy.
Figure 3. Problem fifteen and solution by A9 using the strategy of Trial and error (Problem extracted from IMPA/OBMEP 2012).
139
The student chose to test all alternatives. First subtracting all by one and multiplying each of them by four, representing in this way the participants who arrived after “Dido”. Finally adding this result to the respective value of the main character. The fact that they started trying with the number 403 reveals a more thorough analysis of this group, compared to others who have tested all possibilities. The student reported in its resolution: “we started with 403 because 105 is too low”, which shows that he estimated the possible outcome for each option before performing tests and verifying the answer. One group had started testing with other numbers, not seeming to realize that there were alternatives and that the response should be one of them. When I questioned them and was sure that they were testing random possibilities, I just pointed the alternatives, the time in which its components concluded that there was no need to test so many numbers, but only those five representing the alternatives. No group mentioned or tried to organize an equation to solve this problem. This problem generated many questions, because most of the students could not understand the statement “arrived ahead of the quadruple number of people who came before him”. It was necessary to read several times and some realized that drawing a simplest situation could help in the interpretation of this data. It was the case of A6, which drew Figure 4 and questioned: Student A6: So this is it, this is “Dido”: Four people came in front of him, sixteen came back?
Figure 4. Drawing by A6 used to assist in the interpretation of problem fifteen.
In the solution proposed for problem nineteen we evidenced that one pair of students associated recognition patterns to drive reduction strategy. This solution can be seen in Figure 5.
140
Figure 5. Resolution by A4 for problem nineteen using the strategies of organize patterns and reduce to the unit.
Students who developed this resolution had also started using the rule of three as if the situation were directly proportional, but when alerted to check the answer, they detected the impossibility of that solution and devised a new plan. They realized, as detailed in their solution that every four days worked with the reduced workload would require one day to work harder to compensate: Student A4: every 4 days it should 'use' 1 more day.
Then, they made the next relationships based on the later, as it can be seen in the example, concluding that it would take thirty more days of work. This strategy has surprised us because we had not seen this possibility of resolution, which comes once again to demonstrate the ability of students to think about creative solutions when allowed to test their ideas. At the end of the experience time and the contact of the students with the use of diverse strategies, they solved a selection of problems again. The responses were analyzed and categorized, noting that the investigation participants started using the strategies presented or discussed during the classes effectively. FINAL CONSIDERATIONS With the development of the research presented here we can state our quest as to encourage students to use and share different ways of problem solving, since formal calculation can not always achieve the correct answer or leads to the understanding of what they are doing. Concerning about the initially data collected in order to investigate the different strategies used by students in solving mathematical problems, we found a predominance of formal calculation as a way of solving problems, leading, in some cases, to a low rate of success.
141
During the educational intervention, analyzing the material produced by the participating students, we found that students were able to use, effectively, a variety of strategies for solving problems such as: trial and error, drawing, tables, working in reverse, reduction to the unit, organization patterns and elimination. Some of them where not even thought for us teachers, thus demonstrating the stimulation of creativity and autonomy provided by this form of work. We attribute the fact that they used a wide range of problem solving strategies to the stimulus offered directly for this purpose and this has been one of the objectives pursued since the beginning of the research. The students used mixed strategies, especially drawing, including to help in the interpretation of certain situations. This difference with respect to the initial data collection may be related to the fact that it was never demanded the utilization of formal algorithms, also never discussed or presented content of mathematics. Thus, therefore, they managed to extend the repertoire of strategies that can be used in solving problems We emphasize that we do not intend to suggest the elimination of the teaching of formal content of school mathematics, but we consider important that the students can also have the opportunity to learn the various strategies that can be used. Hence the students may choose, when elaborating a solution plan for solving problems, a convenient strategy that they judge to be the most appropriate to act as a facilitator process. When faced, for example, with problems involving contents of an entire year or more, students may forget details that make all the difference in achieving correct answers by using the formal calculation, whereas knowing problem solving strategies can adapt them to different contexts and succeed. REFERENCES Brasil, S. de E. F. (1998). Parâmetros Curriculares Nacionais: Matemática. Secretaria de Educação Fundamental. Brasília: MEC/SEF. Brasil, M. da E. (2008). PDE: Plano de Desenvolvimento da Educação: Prova Brasil: Ensino Fundamental: matrizes de referência, tópicos e descritores. Brasília: MEC/SEB; Inep. Cavalcanti, C. (2001). Diferentes formas de resolver problemas. In K. S. Smole & M. I. Diniz (Orgs.). Ler, escrever e resolver problemas: Habilidades básicas para aprender matemática (pp 121-149). Porto Alegre: Artmed. D’Ambrosio, B. S. (1989). Como ensinar matemática hoje? Temas e Debates. SBEM. Ano II. N2 (p. 15-19). Brasilia. Dante, L. (2000). Didática da resolução de problemas de matemática: 1ª a 5ª series (12. ed.) São Paulo: Ática. Dante, L. (2009). Formulação e resolução de problemas de Matemática: teoria e prática (1. Ed.) São Paulo: Ática.
142
Dullius, M. M. et al. (2011). Estrategias utilizadas en la resolución de problemas matemáticos. Revista chilena de educación científica,1, 23-32. Gontijo, C. H. (2006). Resolução e Formulação de Problemas: caminhos para o desenvolvimento da criatividade em Matemática. In Anais do Sipemat. Recife, Programa de Pós-Graduação em Educação-Centro de Educação – Universidade Federal de Pernambuco. Haetinger, C, et al. (2008) Anais da XI Olimpíada Matemática da UNIVATES, 10 de setembro de 2008. Lajeado, RS: UNIVATES. IMPA/OBMEP (2012). Banco de Questões 2012. Rio de Janeiro: IMPA. Musser, G. L.; Shaughnessy, J. M. (1997). Estratégias de resolução de problemas na matemática escolar. In S. Krulik, & R. E. Reys (Orgs.) A resolução de problemas na matemática escolar (pp. 188 – 201). Tradução de Hygino H. Domingues e Olga Corbo. São Paulo: Atual. Onuchic, L. de L. R.; Allevato, N. S. G. (2004). Novas reflexões sobre o ensinoaprendizagem de Matemática através da Resolução de Problemas. In M. A. V. Bicudo, & M. C. Borba (Orgs.). Educação matemática: pesquisa em movimento (pp. 213-231). São Paulo: Cortez. Polya, G. (1995). A arte de resolver problemas: um novo aspecto do método matemático. Tradução e adaptação de Heitor Lisboa de Araújo. Rio de Janeiro: Interciência. Stancanelli, R. (2001) Conhecendo diferentes tipos de problemas. In K. S. Smole & M. I. Diniz (Orgs.). Ler, escrever e resolver problemas: Habilidades básicas para aprender matemática (pp 103-120). Porto Alegre: Artmed. Yin, R. K. (2010). Estudo de caso: planejamento e métodos. (4. ed.) Tradução de Ana Thorell. Porto Alegre: Bookman.
143
DIMENSIONS OF MATHEMATICALLY CREATIVE PROCESSES IN EARLY CHILDHOOD Melanie Münz University of Frankfurt/IDeA Center
[email protected] The paper deals with mathematically creative processes in early childhood. Therefore the concept of the interactional niche in the development of mathematical creativity is introduced, which combines interactionistic theories of socio-constructivism with sociocultural theories and a psychoanalytically based attachment theory to describe mathematically creative processes of children under the specific perspective of early childhood development. Data are collected in the interdisciplinary project MaKreKi (mathematical creativity of children), in which researchers from mathematics education and psychoanalysis examine the development of mathematical creativity of children in the age range of 4-8 years. INTRODUCTION Definitions of mathematical creativity differ in several assumptions. On the one hand creativity referred to as the individual ability of a person in the sense of divergent thinking (Guilford, 1967), the abilities to produce fluent, flexible, novel and elaborated solutions to a given problem (Torrance, 1974) or the ability to produce unexpected and original work, that is adaptive (Sternberg & Lubart, 2000). On the other hand creativity is seen as embedded in a social process (e.g. Csikszentmihalyi, 1997; Sriraman, 2004; Vygotsky, 2004), in which creativity is not solely located in a person’s cognition, but is also accomplished in the social interaction among interlocutors. My research interest is the examination of mathematical creativity in early childhood under the specific perspective of early childhood development. In this contribution I focus on the social and sociocultural approach to creativity. The first section presents a theoretical approach that deals with the question in which forms of social interactions these early mathematically creative interactions of children are caused and supported. Afterwards I define what is understood as a mathematical creative process in early childhood. Finally I clarify which cultural and sociocultural dimensions should be considered in a theory of mathematical creativity in early childhood, and in what way. After that an overview of data collection and methods is given. Next an empirical case follows. The paper ends up with summary and prospect. THEORETICAL APPROACH In many fundamental works on children’s creativity, play has been regarded as a location in which creative actions arise and eventually are fostered (e.g. Bateson & Martin, 2013; Vygotsky, 2004,). Also from a psychoanalytical perspective play has been 144 Carreira, S., Amado, N., Jones, K., & Jacinto, H. (Eds.) (2014). Proceedings of the Problem@Web International Conference: Technology, creativity and affect in mathematical problem solving. Faro, Portugal: Universidade do Algarve.
regarded as a location where children’s creativity is formed (Winnicott, 2012). According to Winnicott play is neither part of the personal inner reality nor part of the actual external reality but of a third dimension, that he indicates as “potential space” (Winnicott, 2012, p.144). As soon as a child experiences his or her mother no longer as part of his or her own, a “playground” (Winnicott, 2012, p. 64) emerges, that the child can use for playful creation. This is a complex process and it depends highly on a mother, who is willing to participate and to reciprocate. Winnicott calls her the “good enough mother” (p.109), who is sensitive and reacts appropriate to her child’s needs in opposition to the “not good enough mother” (p.109). Developing a theory of mathematical creativity in the early years one has also to consider the development of mathematical thinking as well. From a sociocultural perspective children’s play is also considered as location of the development of mathematical thinking (e.g. Carruthers & Worthington, 2011; van Oers, 2002) and for this reason the development of mathematical creativity, too, is at least implicit. Mathematics comes into play through articulation by more knowledgeable people, “their companions in the cultural community” (van Oers 2002, p. 30). If play involves other more knowledgeable persons like children or adults, opportunities for scaffolding (Bruner, 1986) or guided participation (Rogoff, 2003) emerge. Besides the aspect of children’s play with competent partners, children are dealing with mathematics in their free self-initiated play as well as in play situation with peers (e.g. Carruthers & Worthington, 2011). Mathematical creative processes in early childhood In several publications of the MaKreKi-project we have shown that “non-canonical” (e.g. Münz, 2014) solving processes can be seen as mathematically creative processes. They include the following aspects (Krummheuer, Leuzinger-Bohleber, MüllerKirchof, Münz, & Vogel, 2013; Sriraman, 2004): Combinational play: Under this aspect the accomplishing of unusual combinations of insights and experiences and the sense of playfulness in the manipulation of procedures and its transfer to new areas are understood. With reference to Finke (1990) these activities are summarized with the “combinational play” (p. 3) of framing a mathematical situation. Non-algorithmic decision-making: According to Ervynck (1991), mathematical creativity articulates itself when a unique and new way of problem solving emerges. For the age group of interest, processes of problem solving can be new, creative and unique, although they are not new for the mathematical community. Uniqueness can be seen as the “divergence from the canonical” (Bruner, 1990, p. 19) way of solving a mathematical problem in early childhood, that adult mathematicians would not necessarily expect. Adaptiveness: Sternberg and Lubart (2000) characterize creativity as the ability to create an unexpected and original result that is also adaptive to the given real situation. 145
We have redefined this concept to our specific needs. Adaptiveness in MaKreKi describes children’s ability to accomplish unusual definitions of situations and to convince their partners by their alternative framing of the situation. So a mathematical creative action has to be reasonable, which mean there are arguments, why the chosen combination or unusual definition of the situation leads to a mathematically correct solution (e.g. Lithner, 2008). Additionally these arguments have to be somehow mathematically funded (e.g. Lithner, 2008; Münz, 2014). Social and sociocultural dimensions As already mentioned a theory of mathematical creativity has to consider social and sociocultural dimensions of creativity, because creative behavior is a complex personsituation interaction. I introduce a framework, which stresses these interactive structures and in which the emerging creative process between children is regarded as an aspect of interactive process of negotiation of meaning between the involved persons. Developing a theory of mathematical creativity in the early years one has also to consider the development of mathematical thinking as well. According to my research focus, the “concept of the interactional niche in the development of mathematical thinking (NMT)” of Krummheuer (2012) seems appropriate for several reasons. For a start the NMT describes the situational aspect in the development of mathematical thinking as a process of negotiation of meaning between the involved persons. So it allows the description of this negotiation of meaning in a creative process as well and is able to capture insights about this creative process. Additionally another procedural aspect is described in the form of the cooperation of the involved persons and the individual scope of action of a child. The NMT is a further development of the original components of the “developmental niche” of Super and Harkness (1986), who describe it … as framework of studying cultural regulation of the micro-environment of the child, and it attempts to describe the environment from the point of view of the child in order to understand processes of development and acquisition of culture. (p. 552).
Additionally Krummheuer added the aspect of interactively local production of such processes, which includes besides the aspect of allocation (under which the provided mathematical activities of a group are summarized, see table 1) the aspect of situation (situationally emerging accomplishment occurring in the process of meaning making) and the aspect of action (which covers the individual contributions to the actions as well as the individual participation profile of a child), which can be adopted to the theory of mathematical creativity in early childhood to examine the mathematical creative process. To describe a mathematical creative process in early childhood, in the following the fourth line of Krummheuer’s NMT “aspect of action” (Krummheuer & Schütte, 2013) is renamed as the aspect of individual’s creative action. It highlights the used mathematical concepts by the individual child, which can be regarded as
146
combinational play, divergence from canonical and adaptive, as well as the individual profile of participation of the child (see table 2). Table 1. The NMT of Krummheuer (Krummheuer & Schütte, 2013). Component: Content
Component: Cooperation
Aspect of allocation
Mathematical domains; Bodies of tasks
Institutions of education; Settings of cooperation
Scientific theories of mathematics education
Aspect of situation
Interactive negotiation of the theme
Leeway of participation
Folk theories of mathematics education
Aspect of action
Individual contributions to actions
Individual profile of participation
Component: Impartation
Competency theories
Krummheuer has furthermore divided these aspects into three components: content, cooperation and impartation (Krummheuer & Schütte 2013), which I briefly summarize and emphasize their relevance to a theory of mathematical creativity in early childhood: Content: The following data are collected in the MaKreKi-project, in which on the level of allocation mathematical topics are usually designed as mathematical situations of play and exploration (Vogel, 2013), regarding the children’s assumed mathematical competencies. They offer opportunities for children to demonstrate their mathematical creative potential. An accompanying adult, who can be seen as a more knowledgeable person, presents the situations. On the situational level this presentation generates processes of negotiation. The presentation of the mathematical situations of play and exploration and the processes of negotiations lead to individual mathematically creative actions. Cooperation: Children participate in culturally specific social settings, which are variously structured as in peer-interaction or small group interaction guided by a more knowledgeable person. These social settings do not succeed immediately. They need to be accomplished in the joint interaction. Depending on each event, a different “leeway of participation” (Brandt, 2004) of the children will come forward. By embellishing these possibilities of participation every child has an individual profile of participation, which can be relatively stable over a given time (see Brandt, 2004). In the limited frame of the paper I will not focus on the component Impartation, but for the sake of completeness, in this column Krummheuer investigates the influence of scientific as well as folk theories of mathematics education on the development of mathematical thinking (Krummheuer & Schütte, 2013). Psychoanalytical dimensions in mathematically creative processes To integrate psychoanalytical insights about creativity in early childhood I add another column, the component interpersonal relations, that derives from Winnicott’s concepts 147
of the “good enough mother” (Winnicott, 2012, p.109) as a requirement for the “potential space” (p. 64, p. 135) as the origin of creativity in human life, which I added in a third column (see table 2). Interpersonal relations: According to Winnicott the initiation of playing is associated with the life experience of the baby who has come to trust the mother figure (Winnicott, 2012), which is given when she reacts sensitively and warmly to the child’s needs. In the first years of life the child develops an ‘inner working model’ through childparents-interactions (Bowlby, 1969). This ‘inner working model’ contains the early individual bonding experiences as well as the expectations, which a child has towards human relationships, derived from these experiences. They induce the child to interpret the behavior of the caregiver and to predict his or her behavior in certain situations. After the first year of life this ‘inner working model’ becomes more and more stable and turns into a so-called “attachment pattern” (Bowlby, 1969, p.364). The quality of the child-caregiver relationship in sense of the attachment patterns can be measured (Ainsworth, Blehar, Waters & Wall, 1978). A rough distinction can be made between two types: The secure and the insecure attachment pattern. Children with a secure attachment pattern have, thanks to their sensitive mothers, a chance to build up secure relationships to them in which the whole spectrum, of human feelings in the sense of communication with each other can be perceived, experienced and expressed. Children with insecure attachment patterns experiences a mother who shows no intense affects and behaves in a distanced controlled manner or who sometimes reacts appropriately, and at other times is rejecting and overprotective, on the whole, inconsistent in a way that is unpredictable for the child. Empirical observations of infant’s exploratory behavior as well as children’s play behavior point out, that children with a secure attachment pattern show more exploratory behavior more positive affect, and are more cooperative in their play than children with an insecure pattern (e.g. Creasy & Jarvis, 2003). Also the quality of the play seems to depend on the attachment pattern. Following Crowell and Feldman (1988), parents of children with insecure attachment pattern are focusing on basic task completion rather than on learning processes. On the level of allocation this attachment pattern can be regarded as stable (Bowlby, 1969), nevertheless Bowlby suggests that these attachment patterns may change as the child begins to interact with other attachment figures e.g. siblings, peers, teachers (Bowlby, 1969). So on the level of situation a child with an insecure attachment pattern may meet other children or adults who show sensitivity to his or her needs in the sense of being a “good enough” partner (Winnicott, 2012, p. 109), which enhances his or her potential for cooperation during the interactive process and potential in mathematical activities. The reverse conclusion is also conceivable. Regarding the aspect of individual creative action, the “good enough partner” will accept the contributions of the child to the mathematical process. This acceptance has not only to be understood as a shared meaning, it can also be seen as an interim, in which the involved persons have squared their framings of the situation and concluded that there is more than one possibility of framing. If this is not the case, the creative process somehow fails in the 148
concrete situation. The following table summarizes the additions to the concept of NMT, which I term as the “interactional niche of the development of mathematical creativity” (NMC): Table 2. The NMC. Content
Cooperation
Interpersonal Relations
Aspect of allocation
Mathematical domains; Bodies of tasks; mathematical potentials
Institutions of education; Settings of cooperation
Attachment Patterns of the involved persons
Aspect of situation
Interactive negotiation of the theme
Leeway of participation
Situational emerging of attachment patterns
Aspect of individual’s creative action
Individual mathematically creative actions
Individual profile of participation
Acceptance in form of shared meaning or interim
EMPIRICAL APPROACH & METHODOLOGY The sample of MaKreKi is based on the original samples of two projects that are conducted in the “Center for Individual Development and Adaptive Education of Children at Risk” (IDeA) in Frankfurt, Germany. One project is a study of the evaluation of two prevention programs with high-risk children in day-care centers (EVA). It examines approximately 280 children. The second project is a study of early steps in mathematics learning (erStMaL). This project includes approximately 150 children. Thus the original sample contains 430 children. We asked the nursery teachers of the two original samples, whether they knew children in their groups who show divergent and unusually sophisticated strategies while working on mathematical tasks. We could identify 37 children, who seem to work creatively on mathematical problems. For the examination of the development of mathematical creativity in the selected children, we introduced mathematical situations of play and exploration (Vogel, 2013) constructed in the erStMaL-project. They are designed in a way that the children can demonstrate their mathematical potential in the interactive exchange with the other participants. An accompanying adult presents the material by sparingly giving verbal and gestural impulses. To ensure that the implementations of these mathematical situations are independent of the participating individuals and proceed in comparable ways, the mathematical situations of play and exploration are explicitly described in design patterns of mathematical situations (Vogel, 2013). With respect to the longitudinal perspective, the children are observed every six months while they work on two mathematical situations of play and exploration. All these events are video taped with two cameras. For the diagnosis of the attachment pattern we apply the Manchester Child Attachment Story Task, so-called MCAST (Green, Stanley, Smith & Goldwyn, 2000). This is a story telling test that has good reliability and validity. 149
Regarding the theoretical considerations and the attempt to identify mathematically creative moments in mathematical interactions of preschool children, in the following there is an analysis of interaction conducted, which is based on the interactional theory of learning mathematics (Brandt & Krummheuer, 2001). It focuses on the reconstruction of meaning and the structure of interactions. Therefore it is proper to describe and analyze topics with regard to contents and the negotiation of meaning in the course of interactional processes. The negotiation of meaning takes place in interactions between the involved people. These processes will be analyzed by an ethnomethodologically based conversation analysis, in which it is stated that the partners co-constitute the rationality of their action in the interaction in an everyday situation, while the partners are trying constantly to indicate the rationality of their actions and to produce a relevant consensus together. This is necessary for the origin of their own conviction as well as for the production of conviction with the other participating persons. This aspect of interaction is described with the term “accounting practice” Lehmann, 1988, p. 169). To analyze these “accounting practices” of children in mathematical situations, the reconstruction and analysis of argumentation of Toulmin (1969) have proved to be successful. VICTORIA AND SINA IN THE “SOLID FIGURE-SITUATION” Information about the girls and the “Solid figure-Situation” Victoria (4;10 years old) and Sina (4;6 years old), both have a secure attachment pattern, participate in the “Solid-figure-Situation”. They are close friends. In the mathematical situation of play and exploration “Solid-figure” the attending children deal with geometrical solids: Cube, square column, pyramid, triangular prism, cone, cylinder and sphere, each of them is duplicated. The material and the designed impulses of the accompanying person provide a geometrically mathematical content for the children in whom they are getting to know these solids and their properties. To enable the children to focus their attention more easily on the geometric figures, a little bag in which the children feel them is used. “…because this is a gyroscope” At first the female accompanying person (abbreviated B in the following) calls on both girls to handle the cone and describe what they have touched. Afterwards she puts a red cube, a red pyramid and a blue cylinder on the table. The children grab and term each solid unrequested: The cone has been designated as “castle” by Victoria and “hat” by Sina, the cube as “cube”, the cylinder as “gyroscope” and the pyramid has been identified as “cornflake” by the group. In this context Sina inquires if they have to build a castle and begins to put some solids on top of each other. B negates and presents a little bag, in which she has put a cylinder, what the children have not seen. She invites the girls to find out, which solid is located in this bag only by touching and gives the clue that the solid in the bag is also arranged on the table. Therefore every girl has to feel the unknown solid in the little bag. Victoria starts and says: “A gyroscope. Next 150
Sina follows and says: “A gyroscope, too”. After validating their conclusion initiated by B the girls are adding together some solids to build towers. First they put two cylinders on top of each other and place the pyramid on the cube to see which one is the tallest tower. Then Victoria asks: “Should I fetch the yellow one?” and Sina answers: “Okay. Good. Come on.” and Victoria continues: “Then we can look which one is bigger”. Victoria places the cone and the pyramid side by side. Immediately thereafter Sina puts the pyramid on top of the cylinders and the cone on the cube and then interchanges cone and pyramid (Figure 3).
Figure 3. Towers
B asks: “Which one was the biggest Victoria? Have you seen it so fast?” And Victoria puts her right hand on the pyramid and says: “This one.” Whereupon B responds: “Put them down again. Than you can look again which one is bigger”. But Victoria looks at Sina’s towers and says by grabbing the cube-pyramid-tower: “Or Sina no. Do you know what? These ones belong to these ones“. And by touching the cone on top of the cylinders she notes: “And these to these ones”. Sina moves the double cylinder-conetower towards the cube-pyramid-tower and tells: “Bigger”. B looks to Victoria and wants to know why these solids belong together whereupon Victoria shrugs her shoulders and Sina responses: “This is red and red”, by touching the pyramid and the cube. And Victoria continues: “Yes because and look and this belongs to the gyroscope because this is a gyroscope”, she points at the double cylinder-cone-tower. Then she holds both hands at the cube-pyramid-tower, “because it“, and turns her hands and shows her palms. Analysis of the episode of Victoria and Sina in the “Solid figure-Situation” Regarding the component content on the level of allocation B provides a geometrically mathematical content for the children in whom they are getting to know solids and their properties. The task is to find identical solids. On the situational level this content is extended to build castles or towers (Sina), to find out which solid is the biggest one by direct size comparisons (Victoria) and to find similar solids, which belong together (Victoria). These extensions lead to the mathematical creative action of Victoria by grouping pyramid and cube as well as cylinder and cone together. Her combinational play in matching cylinder and cone is interpreted as the assignment of the solids regarding similar properties. This similar properties are expressed in Victoria’s terming of both solids as “gyroscope” (in German “Kreisel”). The german word “Kreisel” includes the word “Kreis” which is translated in English “circle”. Cylinder and cone have both circular base areas. In an analogous manner Victoria matches cube and 151
pyramid, which she constitutes in showing her palms, which can be portended as a nonverbal addressing of the base areas of the solids, because like cylinder and cone, cube and pyramid have also same base areas. Victoria’s assignment of the solids can be regarded as a conclusion, divergent from the canonical, because the intended task of B was to find identical solids. Her conclusion seems adaptive to the group, because no one disagrees. However B invites her to explain her findings, which she does by using a plausible and mathematical underpinned warrant in emphasizing the same base areas of the solids, which has also a plausible and mathematical backing (solids with one equal property can be grouped together). Regarding the topic cooperation, Victoria and Sina are paired in a dyad together with an accompanying person in their day-care center. They have to work on a task consecutively, because B addresses first Victoria and then Sina to feel the unknown solid. Summarizing B has the role of an initiator of tasks and evaluator of solutions while the girls have to process that task as processors. They are not allowed to build a castle. The polyadic changes to a more dyadic interaction structure between B and one girl, whereas Sina’s referring to Victoria’s solution “A gyroscope, too” focuses a maintaining of the polyadic interaction. B’s initiation of an evaluation of the solution addresses both girls. After completing B’s task the roles of the girls change. They are focusing Sina’s idea of building towers and they initiate new tasks autonomously like the comparison of sizes. They realize a dyadic interaction between each other. B behaves more reserved her role shifts to a facilitator, who inquires, like her inviting of Victoria to say which solid is the biggest one. It seems somehow as she is one step behind the girls. At that time Victoria is able to conduct two dyadic discourses simultaneously between her and B and her and Sina. In the second one Sina puts cone and cylinder together as well as cube and pyramid. Victoria comments these activities with the idea that these solids belong together. Again B inquires further information, she asks Victoria for an explanation of these groupings. Sina’s expression “Bigger” may refers to B’s first question concerning the size comparison and her explanation of the grouping “This is red and red” answers B’s second question, so again she focuses a maintaining of the polaydic interaction. In the polyadic discourse Victoria extends Sina’s explanation with the evidence of the same base areas of the matched solids. So she can be seen as the initiator of this explanation why the matched solids belong together. Summarizing the girls’ role changes from a processor to an initiator and the dyadic interaction structure turns to a polyadic ones. Concerning the component interpersonal relations both girls have a secure attachment pattern, which mean that they show high exploratory behavior and cooperative strategies in their play. This has also been showed in the presented episode. In the concrete situation Sina shows endeavors in maintaining a polyadic interaction. Furthermore she supports Victoria in her idea of comparison of sizes (“Okay. Good. Come on.”). Also Victoria supports Sina’s idea of building castles or towers although B has rejected it. In terms of Winnicott Victoria has in Sina a “good enough” partner. B can also be seen as a good “enough partner”, because she shows interest in Victoria’s 152
conclusion and invites her to explain her findings. In the polyadic interaction a mathematical “playground” (ibid., p. 64) emerges, that enables Victoria to accomplish a mathematically creative process. The conclusion of grouping pyramid and cube as well as cone and cylinder together can be interpreted as a shared meaning between the three persons. But both girls have different explanations: Sina argues with the same colour, Victoria with the same base area. But Victoria understands and bears her explanation as an extension of Sina’s one, she starts with “Yes because and …”. So both explanations do not be mutually exclusive, but have equal rights. SUMMARY AND PROSPECT Understanding mathematical creativity in early childhood as a cooperative process, that emerges in the situational negotiations of meanings in social interactions the concept of the niche of the development of mathematical creativity has been introduced and demonstrated on an empirical case. It highlights the allocative and situational terms of a mathematically creative process as well as the individual mathematically creative action. Victoria and Sina have extended the mathematical content “geometrical solids and their properties” and “finding identical solids” to “build towers“, “size comparison” and “finding similar solids”. These changes in the mathematical content are linked to a changing of their social participation structure. The girls’ roles alter from processor to initiator. From a psychoanalytic point of view both girls show high cooperative strategies in supporting each other’s ideas, which may be linked to their attachment patterns. Also B’s role changing as response to the children’s needs seems to support the mathematical creative process of Victoria in grouping the mentioned solids together because of their same base area. This conclusion occurs in the polaydic interaction, when Victoria has to explain her grouping in a deep mathematically funded argumentation. It will be interesting to analyze how Victoria’s mathematically creative processes develop when she gets older and enters school. Concerning children with insecure attachment patterns, the question arises how they behave in mathematical situations of play and exploration. How develop their mathematically creative processes and do they have different profiles of participation due to their attachment patterns? Additional analysis and niches may give some answers. The niche of the development of mathematical creativity has not been completed by now. Additional analysis of scientific and folk pedagogy’s concepts about mathematical creativity and mathematics education arising in the social setting can give further insights about the conditions of the development of mathematically creative processes. REFERENCES Ainsworth, M. D., Blehar, M. C., Waters, E. & Wall, S. (1978). Patterns of attachment. Hillsdale, NJ: Erlbaum.
153
Bateson, P., & Martin, P. (2013). Play, playfulness, creativity and innovation. Cambridge: Cambridge University Press. Bowlby J. (1969). Attachment. Attachment and loss (Vol. 1). New York: Basic Books. Brandt, B. (2004). Kinder als Lernende: Partizipationsspielräume und - profile im Klassenzimmer [Children as learners. Leeway of participation and profile of participation in classroom]. Frankfurt a. M.: Peter Lang. Brandt, B., & Krummheuer, G. (2001). Paraphrase und Traduktion: Partizipationstheoretische Elemente einer Interaktionstheorie des Mathematiklernens in der Grundschule [Parphrase and traduction]. Weinheim und Basel: Beltz Verlag. Bruner, J. (1986). Actual minds: Possible worlds. Cambridge, MA: Harvard University Press. Bruner, J. (1990): Acts of meaning. Cambridge, London: Harvard University Press. Carruthers, E., & Worthington, M. (2011). Understanding children’s mathematical graphics beginnings in play. New York: Open University Press. Creasy, G., & Jarvis, P. (2003). Play in children. An attachment perspective. In O.N. Saracho & B. Spodek (Eds.), Contemporary perspectives on play in early childhood education (pp. 133-153). Charlotte, NC: Information Age Publishing. Crowell, J., & Feldman, S. (1988). Mother’s internal models of relationships and children’s behaviour and developmental status: A study of mother-infantinteraction. Child Development, 59, 1273-1285. Csikszentmihalyi, M. (1997). Creativity: Flow and the psychology of discovery and invention. New York: Harper Perennial. Ervynck, G. (1991): Mathematical creativity. Advanced mathematical thinking. In D. Tall (Ed.), Advanced mathematical thinking (pp. 42–53). Dordrecht: Kluwer. Finke, R. (1990): Creative imagery. Discoveries and inventions in visualization. Hillsdale, NJ: Lawrence Erlbaum. Green, J., Stanley, C., Smith, V., & Goldwyn, R. (2000). A new method of evaluating attachment representations in the young school age children: The manchester child attachment story task (MCAST), Attachment and Human Development, 2, 48-70. Guilford, J. P. (1967). The nature of human intelligence. New York: McGraw-Hill. Krummheuer, G. (2012). The “non-canonical” solution and the “improvisation” as conditions for early years mathematics learning processes: The concept of the “interactional niche in the development of mathematical thinking” (NMT). Journal für Mathematik-Didaktik, 33(2), 317–338. Doi: 10.1007/s13138-012-0040-z Krummheuer, G., Leuzinger-Bohleber, M., Müller-Kirchof, M. Münz, M., & Vogel, R. (2013). Explaining the mathematical creativity of a young boy: An interdisciplinary venture between mathematics education and psychoanalysis.
154
Educational Studies in Mathematics, 84(2), 183-200. Doi: 10.1007/s10649-0139505-3 Krummheuer, G. & Schütte, M. (2013). Das Wechseln zwischen mathematischen Inhaltsbereichen – Eine Kompetenz, die nicht in den Bildungsstandards steht [The changing between mathematical domains – A competence that is not mentioned in the educational standards]. Manuscript submitted for publication. Lehmann, B. E. (1988). Rationalität im Alltag? Zur Konstitution sinnhaften Handelns in der Perspektive interpretativer Soziologie [Rationality in everyday life? Construction of meaningful acting in the perspective of interpretative sociology]. Münster, New York: Waxmann. Lithner, J. (2008). A research framework for creative and imitative reasoning. Educational Studies in Mathematics, 67, Issue 3, 255-276. Doi: 10.1007/s10649007-9104-2 Münz, M. (2014). Non-canonical solutions in children-adult interactions: A case study of the emergence of mathematical creativity. In C. Benz, B. Brandt, U. Kortenkamp, G. Krummheuer, S. Ladel, & R. Vogel (Eds.), Early mathematics learning. New York: Springer. Rogoff, B. (2003). The cultural nature of human development. Oxford: Oxford University Press. Sriraman, B. (2004): The characteristics of mathematical creativity. The Mathematics Educator, 14 (1), 19–34. Sternberg, R. J. & Lubart, T.I. (2000): The concept of creativity: Prospects and paradigms. In R. J. Sternberg (Ed.), Handbook of creativity (pp. 03-15). Cambridge, UK: Cambridge Univ. Press. Super, C. M., & Harkness, S. (1986). The developmental niche: a conceptualization at the interface of child and culture. International Journal of Behavioural Development, 9, 545–569. Torrance, E.P. (1974). Torrance tests of creative thinking. Bensenville, IL: Scholastic Testing Service. Toulmin, S. E. (1969): The uses of argument. Cambridge, UK: Cambridge Univ. Press. Van Oers, B. (2002). The mathematization of young children’s language. In K. Gravenmeijer, R. Lehrer, B. van Oers, & L. Verschaffel (Eds.), Symbolizing, modeling and tool use in mathematics education (pp. 29-58). Dordrecht: Kluwer. Vogel, R. (2013). Mathematical situations of play and exploration. Educational Studies in Mathematics, 84(2), 209-226. Doi: 10.1007/s10649-013-9504-4. Vygotsky, L. (2004). Imagination and creativity in childhood. Journal of Russian and East European Psychology, 42(1), 7–97. Winnicott, D. W. (2012). Playing and reality. Retrieved from http://www.eblib.com. 155
CREATIVE ADVANTAGES OF VISUAL SOLUTIONS TO SOME NON-ROUTINE MATHEMATICAL PROBLEMS Norma Presmeg Illinois State University
[email protected] Although affect is inevitably implicated in problem solving of all types, and is especially memorable in visual mental processing, this paper concentrates on the creative advantages of visual solutions to certain mathematical problems presented in words. After discussion of some theoretical constructs associated with creativity, examples of the power of visual processing are presented, drawn not only from papers written by members of the Algarve group taken from the Sub12 and Sub14 competitions, but also from my research on visualization over the last three decades. These examples illustrate also the richness of individual representations in several stages of problem solving—involving fluency, flexibility, and originality, which are often taken as core dimensions of creativity. INTRODUCTION The goal of this paper is to highlight the potential power and creativity of visual solutions to some non-routine problems drawn from the vast database of problem solutions of the Algarve Sub12 and Sub14 project, and from the problem bank I used in my own research on visualization over a period of more than three decades. In reading eight of the many papers written about the mathematical problem solving web-based competitions organized and promoted by scholars at the University of Algarve, I was particularly impressed by the potential for variety in the outstanding collection of problems used in these competitions. I do not know the sources used by the organizers of the competitions in constructing this collection, but I was reminded of the problem bank of several hundred non-routine problems that I collected in the early 1980s. The purpose of my problems was different from the purpose of those used in the competitions: I needed a source for a “mathematical processing instrument” (MPI) that could be used to identify preference for visual thinking amongst senior high school students and their mathematics teachers. Thus one initial criterion for including a word problem (no pictures, since these might pre-empt a visual way of thinking) was that I should be able to solve the problem both visually and non-visually. The sources for my problems were varied, but many of them came from the rich collections made by Krutetskii (1976), and by Kordemsky (1981) in his Moscow Puzzles. After fieldtesting the instrument in two countries (England and South Africa), I followed Krutetskii in classifying the problems themselves as more or less visual, and according to their difficulty—based on analysis of the solutions presented by hundreds of students—and discarding those that were at the extremes of the scale. The result was an 156 Carreira, S., Amado, N., Jones, K., & Jacinto, H. (Eds.) (2014). Proceedings of the Problem@Web International Conference: Technology, creativity and affect in mathematical problem solving. Faro, Portugal: Universidade do Algarve.
instrument that consisted of Section A, 6 relatively easy problems; Section B, 12 problems of intermediate difficulty; and Section C, 6 problems that were more difficult. Sections A and B were used to determine the visual preferences of high school (and later, college) students, and Sections B and C were intended for their mathematics teachers. In this way, preferences of teachers and students could be compared, leading to classroom research that investigated the interplay of teaching and learning and the difficulties and affordances of visual thinking in mathematics over a whole school year (Presmeg, 1985). Creativity and affect were both important considerations in interpreting the results of this research over several decades (Presmeg & BalderasCañas, 2001). However, in this paper I shall concentrate on the creative aspects. A powerful visual solution In the account given by Jacinto, Carreira, and Amado (2011) of Leonor solving problem # 10, Cat and Mouse, the creative ingenuity of Leonor stands out. Here is the problem as it was given: A hungry cat surprises a mouse. Immediately the mouse starts running and the cat follows in pursuit. When the mouse starts its escape, it has a lead of 88 mouse’s little steps on the attacker. It turns out that 2 steps of the cat are equivalent, in distance, to 12 little steps of the mouse. Moreover, while the mouse takes 10 little steps, the cat takes 3 steps. How many steps must the cat take to catch the mouse? (p. 4)
Leonor devised a visual solution to the problem, which effectively synchronizes distance and time in a computer representation using color coding and ‘chunking’ of steps of a cat and mouse. The color coding enables her to impose a time element on the chunking of six little mouse steps for the distance of one cat step. The originality and power of Leonor’s solution is evident: her visual representation serves both to organize the very complex distance and time relationships that are given, and to enable a solution that is elegant and certain. Before examining Leonor’s solution, I tried to solve the problem myself, using algebraic equations—and I struggled to reconcile the two ratios given, those of 12 mouse steps being equivalent (in distance) to 2 cat steps, and of 10 mouse steps being equivalent (in time) to 3 cat steps. And the mouse had a head start of 88 little steps! Leonor’s visual solution does not eliminate the need for reasoning: logic is certainly involved in her analysis of the 6:1 distance ratio, and in the superposition of a colourful 10:3 time ratio. This use of strong logic in an effective visual solution is consonant with the theoretical position I adopt (following Krutetskii, 1976) that strong logic is involved in all effective mathematical thinking, whether visual or non-visual: visualization and logic are not opposed, but are orthogonal in this model (Presmeg, 2006; Nardi, 2014). My further research through the decades showed again and again the effectiveness of alternating or combining visual modes and nonvisual reasoning in solving mathematical problems at all levels, from elementary to college-level mathematics. In this paper I present some solutions to problems on my MPI instrument that illustrate, similarly to Leonor’s work, the power and elegance of visual creativity in this regard. 157
I illustrate also how certain problems (not necessarily from my MPI, since these would have been eliminated as being at the extreme of the scale) can be regarded as “visual” problems, because for these a non-visual solution is much more difficult—as Leonor’s solution to the cat-and-mouse problem shows. But first I discuss some theoretical elements concerning creativity, in the next section. WHAT IS CREATIVITY? Despite the perception that mathematical creativity is an important ingredient in furthering the discipline of mathematics, there is no generally accepted definition of what constitutes mathematical creativity (Sriraman & Lee, 2011). Hadamard’s (1945) influential account of mathematical creativity stressed the need for stages of absorbed attention and incubation before the Aha! moment that gives a sense of certainty that the way to a solution is clear. Even at this moment in mathematical problem solving, it is still necessary to verify that in fact a valid solution does result. Not specifically addressing mathematical creativity, Torrance (1972) considered the question of whether children can be taught to think creatively, and his influential tests for creative thinking using words and pictures (1966) set a means by which many researchers judged work to be creative according to its fluency, flexibility, originality, and richness of elaboration. In mathematics education, several researchers have elaborated on this early work (Yuan & Sriraman, 2011, Presmeg, 1981). Yuan conducted interesting doctoral research in China and the USA, using the theoretical lens of Guilford’s Structure of Intellect model, and Torrance’s tests. It does not seem necessary to limit creativity to divergent thinking (as opposed to convergent thinking) as some have done (e.g., de Bono, 1970). However, novelty and usefulness are considered to be key elements by some researchers (Yuan & Sriraman, 2011), resonating with the requirement of originality in Torrance’s formulation. It seems clear to me that solutions such as that of Leonor, discussed in the first section, contain these essential elements of creative thinking in mathematics, and her solution can serve as a paradigm case. CREATIVE MATHEMATICAL PROBLEM SOLVING It seems to me that the openness of acceptable means of arriving at a correct solution in both the Qualifying and the Competition stages of the Sub12 and Sub14 competitions should be a strong catalyst for creative thinking in these young learners. And indeed, many of the solutions presented in the group’s publications do give evidence of such thinking. For instance, the solutions of four grade 8 students to the problem about the three daughters of Mr. José, Joana, Josefina, and Júlia, are both novel and useful, using arithmetic and algebraic means or a combination of the two (Amado, Carreira, Nobre, & Ponte, 2010). The problem statement is as follows: Mr José has three daughters who love to eat sweets: Joana, Josefina, and Júlia. In the summer as they went to the beach they started to worry about their figure. So they decided to go on a diet and the three of them regularly weighed on a big scale their father keeps in his store. Before starting on diet they stepped on the scale in pairs. Joana and Josefina both 158
weighed 132 kg. Josefina and Júlia both weighed 151 kg. Júlia and Joana both weighed 137 kg. How much did each of the sisters weigh? (Vol. 2, p. 140)
Solutions to such problems do not always involve visual means of representation. Amado et al. (2010) report that 40% of the students solved the problem correctly, and that arithmetic solution were those most commonly used. The purpose of my MPI instrument was to investigate the mathematical visuality (MV) of individuals—defined as preference for visual thinking—when the solution methods available provide a reasonable choice. It is useful to define visual means of solution as including not only inscriptions in the form of pictures, but also more abstract spatial depictions involving arrows, charts, and patterns (Presmeg, 2006). In this paper I confine my examples to those involving visual representations, because I hope to show the power of visual creativity in solving nonroutine mathematical problems. In my research I asked participants to tell me about their mental visual imagery as well, and often this imagery was vivid and striking, but that is another story. Problems that are of a ‘visual’ nature As explained, such problems were not included in my instrument for measuring preference for visual thinking in mathematical problem solving, in which the purpose was to see how individuals approached problems when both visual and non-visual solutions were approximately equally facilitative of finding a solution. However, it is instructive to consider how potent visuality can be in solution of problems that may be classified as ‘visual’, such as the following.
Figure 1. The altar window, showing construction of the gilded area.
159
This classic problem by Wertheimer (1966) concerns a circular Altar Window. The area around the window is being gilded by workmen, as in Fig. 1, surrounding the window with a square and two semicircles as shown. The problem is to work out the size of the gilded area, in terms of the diameter of the circle. People who attempt a piecewise solution using formulae may find this problem to be difficult, particularly if the construction square is not shown. However, a dynamic visual solution is to slide the two semicircles mentally into the centre circle. Then it is almost trivially apparent that the gilded area is the same as the area of the square, that is, the diameter squared. What makes such a solution creative is that it may be necessary to break the mental set that suggests formulae when the word “area” is presented, in order for a more fruitful visual solution method to become apparent. It is notable that as in the Altar Window example, dynamic or moving inscriptions are often powerfully effective in solving non-routine mathematical problems (Presmeg, 2006)—and the affordances of technology now are likely to enhance this aspect of visualization, as recognized by the Algarve group, and as illustrated in research using various forms of dynamic geometry software (e.g., Yu, Barrett, & Presmeg, 2009). Problems that are neither ‘visual’ nor ‘non-visual’ In order to allow preference for visual methods to become apparent, the MPI had to consist of problems that had the potential for visual and nonvisual solutions. In many cases, visual solutions manifested creativity. Sometimes metaphors were implicated in such visual solutions (Presmeg, 1992, 1998), as in the following problem, C-3 from the MPI, in which Mr. Green (pseudonym of a college student) used the metaphor of a clockface in his solution. C-3. A boy walks from home to school in 30 minutes, and his brother takes 40 minutes. His brother left 5 minutes before he did. In how many minutes will he overtake his brother?
Visual symmetry was an important element in Mr. Green’s solution (Fig. 2). This symmetry immediately yielded the solution that the boy would overtake his brother in 15 minutes. Boy leaves at 10:00 (reference point) Brother leaves at 9:55
*Boy overtakes brother at 10:15.
Brother arrives at 10:35 Boy arrives at 10:30 Figure 2. A unified ‘clock’ image for problem C-3, using Mr. Green’s metaphor. 160
A solution by a different student was as follows: Because the boy takes 30 minutes and his brother 40 minutes, to walk the same distance, the ratio of their times for equal distances is 3:4. Consider the unit of distance for which the boy takes 3 minutes and his brother 4 minutes. 1
1
1
1
1
1
Boy’s time:
0
3
6
9
12
15
Brother’s time:
-5
-1
3
7
11
15
Thus the boy will overtake his brother in 15 minutes.
Logic is clearly evident in both of these solutions. However, different elements of creativity are involved, although both manifest originality: symmetry is less evident in the second solution, which is nevertheless also elegant and fluent. In non-routine problem solving, the intricacies of coordinating distance and time often involve challenges for students, as recognized by Carreira (2012), and as overcome so brilliantly by Leonor, as illustrated earlier (Jacinto et al., 2011). I present problem C-6 from the MPI (one of Kordemsky’s Moscow Puzzles), as another illustration of the power of visual thinking in this regard. C-6. A train passes a telegraph pole in 14 minute and in 34 minute it passes completely through a tunnel 540 metres long. What are the train’s speed in metres per minute and its length in metres?
This problem elicits non-visual problem solving means for many people: algebraic equations are then a first resort, and the solution can be attained, but it is complicated. An elegant and creative visual solution is to imagine the telegraph pole placed at the entrance to the tunnel, as in Figure 3. Pole .
1
.
1
.
The first segment of the journey is where the train is before it enters the tunnel. Each segment takes the train a quarter minute. It takes the front of the train half a minute to go the length of the tunnel. Thus the speed of the train is 540 x 2 = 1080 metres/minute, and the length of the train is half the length of the tunnel, i.e., 270 metres. Figure 3. A creative visual solution for C-6, the Train in Tunnel problem.
Some people use the basic thinking illustrated in Fig. 3, but they actually draw the train, usually in the first segment before it enters the tunnel, complete with engine, carriages, and smoke emerging from the stack! Such an iconic illustration adds nothing to the problem solution, but it has an aesthetic function. Such drawings were also identified in the solutions of problems in the Sub12 and Sub14 competitions, as in the Cages and Parrots problem (Jacinto & Carreira, 2012); and Jacinto, Amado and Carreira (2009) recognized the nature of such illustrations. This phenomenon also 161
resonates with the advantages of pattern imagery over concrete imagery, which was a striking result of my research (Presmeg, 2006). Pattern imagery strips away unnecessary details, as in the inscription in Fig. 3: it is unnecessary to draw the train! However, as Carreira points out (email communication), the affordances of technology may blur the distinction between concrete and pattern imagery. In solving the Train in Tunnel problem, Carreira brilliantly copied from the internet, images of a train, a telegraph pole, and a bridge (a tunnel was not available), and made a collage that adapted these to correspond exactly to the solution in Fig. 3. Her solution was clearly a concrete picture of the situation. But there is a pattern-like aspect. As she wrote in her email message, “the situation has itself a pattern.” This is one further instance of how the affordances of technology change conclusions from earlier research. Yu, Barrett, and Presmeg (2009) reported that use of Shapemaker software with middle grades students reversed the order of the van Hiele stages in learning the properties of geometric shapes. One more problem from section C of the MPI illustrates the contrast between visual and nonvisual solutions. C-4. An older brother said to a younger, “Give me eight walnuts, then I will have twice as many as you do.” But the younger brother said to the older one, “You give me eight walnuts, then we will have an equal number.” How many walnuts did each have? C-4. Solution 1: I used symbols and equations, e.g., Let the younger brother have x walnuts and the older, y walnuts. y + 8 = 2(x – 8) and y – 8 = x + 8. Solve simultaneously: x = 40 and y = 56. The younger brother has 40 walnuts and the older 56 walnuts. C-4. Solution 2: I drew a diagram to represent the number of walnuts. Older brother’s number of walnuts
Younger brother’s number of walnuts
a
b
From the conditions of the problem, the top half of line b is divided into 4 equal parts, each representing 8 walnuts. Thus 7 of these parts represents the older brother’s number of walnuts and 5 parts represents the younger brother’s. Thus the younger brother had 40 and the older brother 56 walnuts. 162
It is apparent that the visual solution to the problem in this case, Solution 2, is conceptually complex. In fact in this instance the easier solution for many people would be Solution 1. This problem illustrates that it is not always the case that a visual solution provides an easier method, although for some problems that is the case. Nevertheless, Solution 2 for the Walnuts problem is certainly creative, and it was the preferred method for many people. CONCLUSION How prevalent is the preference for visual thinking in mathematical problem solving? Contrary to the conclusion of Eisenberg (1994) that students are reluctant to visualize in mathematics, my research provided ample evidence (Presmeg, 2006) that for some students—the visualizers—there is no other way! However, it is clear that sociocultural considerations, including the value placed on this mode of thinking in classrooms, may hinder students from using or expressing their preferred mode. This aspect points to the advantage of accepting and valuing all attempts at solution, irrespective of the mode, that is evident in the Sub12 and Sub14 competitions. The requirement in these competitions that students should explain their thinking in solving the Sub12 and Sub14 problems gives the organizers a window into creative elements in the students’ thinking and presentation of their work. Considering the core elements of fluency, flexibility, originality, and elaboration, it is apparent that fluency and elaboration would be manifest in creative solutions spelled out in these competitions. Because only one method of solution is required in the competitions, it is more difficult to judge flexibility. However, despite the fact that students could work collaboratively and get help from various sources in the Qualifying round, it seems reasonable to expect that originality (even for a group solution) could be apparent. It is hard to imagine that a majority of students would come up with the solution to the Cat and Mouse puzzle submitted by Leonor! This solution certainly appears to manifest originality. Thus the potential for identifying creativity is high in these competitions. In particular, I would be interested to know how prevalent visually creative solutions were. I elaborate on the identification of various preferences for visuality in the next section. Preference for visual representations when there is a choice In the MPI, individuals first solved the 18 problems (either 6 from A and 12 from B— students, or 12 from B and 6 from C—teachers) in any way that was comfortable for them, and after they had completed their solutions, they selected from a questionnaire the solution that was closest to theirs for each problem. For problem C-3 (the boy and his brother going to school), for instance, the following were the choices. C-3. Solution 1: I drew a diagram representing the times: 5 mins Time to overtake Brother Boy
Total time 40 mins 30 mins 163
From the diagram: the boy will arrive at school 5 minutes before his brother; thus the two halves of the figure must be symmetrical, so he will overtake his brother halfway, i.e., after 15 minutes. C-3. Solution 2: As in solution 1, but I imagined the diagram. C-3. Solution 3: I used symbols and equations, e.g., Let distance to school be d units, and let the boy overtake his brother in x minutes. Then his brother has walked for (x+5) minutes. The boy’s speed is 30d units per minute, and his brother’s is 40d . When he overtakes, they have gone the same distance. Thus 30d x = 40d (x+5), and thus x = 15. The boy overtakes his brother in 15 minutes. C-3. Solution 4: I solved this problem by calculating their times to reach the halfway point. It takes the boy 15 minutes and his brother 20 minutes. But the brother left 5 minutes earlier; thus they will reach the halfway point together. The boy overtakes his brother in 15 minutes. C-3. Solution 5: I drew a graph: School Distance
0
5
35
40
Time in minutes
By symmetry the graphs intersect midway. Thus the boy overtook his brother in 15 minutes.
Solutions 1, 2 and 5 count as visual solutions for this problem, and these would be scored as 2 points towards a Mathematical Visuality score (MV). Solutions 3 and 4 would score 0, and there was the option of checking a box “none of these”, which would score 1. Thus for the 18 problems, the possible MV total is 36 points. It was found through multiple administrations of the MPI in England, South Africa, Sweden, and the USA, that MV scores for the general population follow a standard Gaussian distribution. For most people, it depends on the problem whether or not they employ visual means; however, there are visualizers who always, or almost always, need to work visually. And at the other end of the scale, some people seldom or never have such a need. It is not that visualization is necessary in order for a solution to be creative: many of the solutions involving numbers and algebraic thinking described by Amado et al. (2010) manifest characteristics of creativity. However, when an elegant visual solution shortcuts the difficulties of using equations and numerical methods—as in
164
Leonor’s solution at the beginning of this paper—then the potential power and creativity of visual thinking are revealed. Using the MPI provided quantitative data that showed no significant difference between the MV scores of boys and girls in grade 11, near the top of the high school. However, there was a significant difference between the scores of students and their mathematics teachers: the students needed more visual methods than did their teachers. However, there was only a weak correlation (Spearman’s rho = 0.4) between the teachers’ MV scores and the visuality of their teaching (TV scores—obtained by triangulation of observations by researcher and students, and teachers’ self-report). A good teacher knows the needs of the students. The use of non-parametric statistical methods was offset by the rich details provided also by qualitative research. The qualitative interview methodology of my research over many decades revealed also different kinds of visualization in problem solving. What I called pattern imagery was far more effective in many cases than concrete imagery—corresponding roughly to the spatial and iconic types identified by Carreira (2012). Pictures are not always useful: in fact there is evidence in my data that some kinds of pictures, or too much attention to unproductive aspects, may in fact hinder problem solving (Presmeg, 2006). But I agree totally with Carreira (2012) that when imagery and visual inscriptions are used with fluency and flexibility—enhanced by the affordances of technology—they are powerfully creative modes of problem solving. A final word In this paper I have made no distinction amongst the various stages of problem solving. These stages might be classified according to Polya’s (1954) well-known stages, namely, understanding the problem, constructing a plan, carrying out the plan, and checking the solution. Certainly it is evident in the problems presented in this paper, as well as others described by members of the Algarve group, that a visual inscription in the form of a diagram, a chart, or anything that depicts a spatial layout can be useful to students in understanding and setting out the conditions of a problem. And often such activity leads to the construction of a plan for solving the problem, or in some cases directly to the solution itself, as in Mr. Green’s clockface summary of the conditions of the Boys Going to School problem, or indeed in Leonor’s solution of the Cat and Mouse problem. If one were investigating the affect associated with each stage of problem solving, breaking down solutions into stages is productive (as reported by Presmeg & Baldero-Cañas, 2001). Such research is enriched by qualitative interview methodology. However, with the rich database provided by the Sub12 and Sub14 competitions, if creativity is the focus of the research, it would appear that it is unnecessary to separate the process of finding a solution into stages, which in any case are reflexively related and collapsed in many instances, particularly if the solution process is a visual one.
165
REFERENCES Amado, N., Carreira, S., Nobre, S., & Ponte, J. P. (2010). Representations in solving a word problem: The informal development of formal methods. In M. F. Pinto & T. F. Kawasaki, (Eds.), Proceedings of the 34th Conference of the International Group for the Psychology of Mathematics Education (Vol. 2, pp. 137-144). Belo Horizonte, Brazil: PME. Carreira, S. (2012). Mathematical problem solving beyond school: Digital tools and students’ mathematical representations. Paper presented at the 12th International Congress on Mathematical Education, 8-15 July, 2102, Seoul. De Bono, E. (1970). Lateral thinking: A textbook of creativity. Middlesex: Pelican. Hadamard, J. (1945). The psychology of invention in the mathematical field. Princeton, NJ: Princeton University Press. Jacinto, H., Amado, N., & Carreira, S. (2009). Internet and mathematical activity within the frame of “Sub 14”. In V. Durand-Guerrier, S. Soury-Lavergne, & F. Arzarello (Eds.), Proceedings of the Sixth Congress of the European Society for Research in Mathematics Education (pp. 1221-1230). Lyon, France: Institut National de Recherche Pédagogique. Jacinto, H., & Carreira, S. (2012). Problem solving in and beyond the classroom: Perspectives and products from participants in a web-based mathematical competition. Paper presented at the 12th International Congress on Mathematical Education, 8-15 July, 2102, Seoul, South Korea. Jacinto, H., Carreira, S., & Amado, N. (2011). Home technologies: How do they shape beyond-school mathematical problem solving activity. Proceedings of the 10th International Congress for Technology in Mathematics Teaching. Portsmouth, UK: July, 2011. Kordemsky, B. A. (1981). The Moscow puzzles. Middlesex, England: Penguin. Krutetskii, V. A. (1976). The psychology of mathematical abilities in schoolchildren. Chicago, IL: University of Chicago Press. Nardi, E. (2014). Reflections on visualization in mathematics and in mathematics education. In M. Fried (Ed.), Mathematics and mathematics education: Searching for common ground. New York: Springer. Polya, G. (1954). Mathematics and plausible reasoning. Putnam: Princeton University Press. Presmeg, N. C. (1981). Parallel threads in the development of Albert Einstein’s thought and current ideas on creativity: What are the implications for the teaching of high school mathematics? Unpublished M.Ed. dissertation, University of Natal, South Africa.
166
Presmeg, N. C. (1985). The role of visually mediated processes in high school mathematics: A classroom investigation. Unpublished Ph.D. dissertation, University of Cambridge, UK. Presmeg, N. C. (1992). Prototypes, metaphors, metonymies and imaginative rationality in high school mathematics. Educational Studies in Mathematics, 23(6), 595-610. Presmeg, N. C. (1998). Metaphoric and metonymic signification in mathematics. Journal of Mathematical Behavior, 17(1), 25-32. Presmeg, N. C. (2006). Research on visualization in learning and teaching mathematics: Emergence from psychology. In A. Gutierrez & P. Boero (Eds.), Handbook of research on the psychology of mathematics education (pp. 205-235). Rotterdam: Sense Publishers. Presmeg, N. C. & Balderas-Cañas, P. (2001). Visualization and affect in nonroutine problem solving. Mathematical Thinking and Learning, 3(4), 289-313. Sriraman, B., & Lee, K. H. (2011). The elements of creativity and giftedness in education. Rotterdam: Sense Publishers. Torrance, E. P. (1966). Thinking creatively with words, A and B; Thinking creatively with pictures, A and B. Princeton, NJ: Personnel Press. Torrance, E. P. (1972). Can we teach children to think creatively? The Journal of Creative Behavior, 6(2), 114-143. Wertheimer, M. (1966). Productive thinking. London: Tavistock Publications. Yuan, X, & Sriraman, B. (2011). An exploratory study of relationships between students’ creativity and mathematical problem-posing abilities: Comparing Chinese and U.S. students. In B. Sriraman & K. H. Lee (Eds.), The elements of creativity and giftedness in education (pp. 5-28). Rotterdam: Sense Publishers. Yu, P., Barrett, J. & Presmeg, N. (2009). Prototypes and categorical reasoning: A perspective to explain how children learn about interactive geometry objects. In T. Craine (Ed.), Understanding geometry for a changing world, 71st NCTM Yearbook (pp. 109-125). Reston, VA: NCTM.
167
THE BORROWERS: USING TRANSPORTATION, ADDRESSES, AND PARALELEPÍPEDOS TO PROMPT CREATIVITY USING ETHNOMODELING Daniel Clark Orey, Milton Rosa Centro de Educação Aberta e a Distância, Universidade Federal de Ouro Preto, Minas Gerais, Brasil
[email protected],
[email protected] It is our pleasure to share with readers a bit about our journey and our developing perspective in relation to the creative potential we have encountered in California, New Mexico, Nepal, Guatemala, and Brasil in relation to ethnomathematics and mathematical modeling and distance education. We conclude this discussion with a few brief examples of how ethnomodeling works in Brasil. INTRODUCTION The starting point of this discussion is related to the question, what does it take to make a mathematical mind? By answering this question, it is necessary to outline factors regarding: a) Number sense; b) Numerical ability; c) Algorithmic ability; d) Ability to handle abstraction; e) A sense of cause and effect; f) Ability to construct and follow a causal chain of facts or events; g) Logical reasoning ability; h) Relational reasoning ability; i) Spatial reasoning ability (Devlin, 2000). We have encountered these abilities in a diversity of cultural manifestations. For example, as a teacher in Guatemala in the early 80’s, Professor Orey first encountered mathematics in the context of culture. While purchasing an item in a highland Maya market, he bartered with a woman who took a hand-held calculator from inside her huipil[1]. Neither of them could speak the other’s language, so she quickly punched in the price she wanted and handed it back to him. Shaking his head, he then entered a new price and handed it back to her. This process continued until both were met with satisfaction. It was not until a few hours later while returning home on the bus that Orey asked himself: What just happened? Over the years he has become increasingly interested in how diverse people incorporate new ideas and technologies; in novel and creative ways, and how these interactions, often enabled by technologies, are increasingly affecting all of our thinking and learning processes. In this regard, we need to take special effort to open our eyes to the dynamic histories and technological sophistication of indigenous cultures (Eglash et. al, 2006). Mathematical thinking is influenced by the diversity of human environments and their elements such as language, religion, mores, economics, and social-political activities. These same forces influence and encourage creativity. Historically, human beings have 168 Carreira, S., Amado, N., Jones, K., & Jacinto, H. (Eds.) (2014). Proceedings of the Problem@Web International Conference: Technology, creativity and affect in mathematical problem solving. Faro, Portugal: Universidade do Algarve.
developed logical processes related to quantification, measurement, and modeling in order to understand and explain their socio-cultural-historical contexts (Rosa & Orey, 2010). These processes allow each cultural group to develop its own way to mathematize[2] their own realities. According to this perspective, the purpose of this paper is to provide a discussion on ethnomodeling, which aims to show through a series of examples how mathematics can be understood and used as way of translating mathematical practices in diverse cultural contexts. However, before discussing our work in Ouro Preto, a brief discussion of ethnomathematics and ethnomodeling is necessary in order to assist in contextualizing aspects of mathematical creativity, which may be described as a multifaceted construct involving both “divergent and convergent thinking, problem finding and problem solving, self-expression, intrinsic motivation, a questioning attitude, and selfconfidence” (Runco, 1993, p. ix). In this direction, students need to see how mathematics is developed and realize that creative individuals help the evolution of mathematical knowledge. ETHNOMATHEMATICS Ethnomathematics is the application of mathematical ideas and practices to problems that confronted people in the past or are encountered in present day culture (D’Ambrosio, 2001). Much of what we call modern mathematics came about as diverse cultural groups sought to resolve unique problems such as commerce, art, religion, exploration, colonization and communications, along with the construction of railroads, census data, space travel, and other problems-solving techniques that arose from particular communities. For example, the Mayans invented the number zero and the positional value that are often attributed to the Hindus around the 9th century. These concepts were transmitted to the Arabs from the Hindus by means of exchanges of commercial activities (Rosa & Orey, 2005). Cultural variables have strongly influenced how students how came to understand their world and interpret their own and others experiences (D’Ambrosio, 1990). In attempting to create and integrate mathematical materials related to different cultures and that draw on students’ own experiences in an instructional mathematics curriculum, it is possible to apply ethnomathematical strategies in teaching and learning mathematics. These strategies include, but are not limited to the historical development of mathematics in different cultures, which means that: (…) people in different cultures which use mathematics (e.g. an African-American biologist, an Asian-American athlete). Mathematical applications can be made in cultural contexts (e.g. using fractions in food recipes from different cultures). Social issues can be addressed via mathematics applications (e.g. use statistics to analyze demographic data) (Scott, 1992, p. 3-4).
169
The challenge that many communities face today is in determining how to shape a modernized, national culture, which integrates selected aspects and where its diverse ideas coexist in an often delicate balance with those of westernized science. Increased cultural, ethnic, and racial diversity while not homogenizing the whole, providing both opportunities for, as well as challenges to, societies and institutions, with many questions related to schooling forming an integral part of this question. Indeed the most creative dynamic and productive societies do this well (Florida, 2004). ETHNOMATHEMATICS AS A PROGRAM The inclusion of moral consequences into mathematical-scientific thinking, mathematical ideas, procedures, and experiences from different cultures around the world is vital. The acknowledgment of contributions that individuals from diverse cultural groups make to mathematical understanding, the recognition and identification of diverse practices of a mathematical nature in varied cultural procedural contexts, and the link between academic mathematics and student experiences should all become central ingredients to a complete study of mathematics. This is one of the most important objectives of an ethnomathematics perspective in mathematics curriculum development. Within this context, ethnomathematics can be described as: The prefix ethno is today accepted as a very broad term that refers to the sociocultural context, and therefore includes language, jargon, and codes of behavior, myths, and symbols. The derivation of mathema is difficult, but tends to mean to explain, to know, to understand, and to do activities such as ciphering, measuring, classifying, ordering, inferring, and modeling. The suffix tics is derived from techné, and has the same root as art and technique. In this case, ethno refers to groups that are identified by cultural traditions, codes, symbols, myths and specific ways used to reason and to infer (D’Ambrosio, 1990, p. 81).
In this regard, ethnomathematics forms the intersection between cultural anthropology and institutional mathematics that uses mathematical modeling to solve real-world problems in order to translate them into modern mathematical language systems. In so doing, mathematical modeling is a creative tool, which provides a translation from indigenous knowledge systems to Western mathematics. This perspective is crucial in giving minority students a sense of cultural ownership of mathematics, rather than a mere gesture toward inclusiveness (Eglash et. al, 2006). An essential aspect of the program includes an ongoing critical analysis of the generation and production of mathematical knowledge as well as the intellectual processes of this production (Rosa & Orey, 2010). This program seeks to explain, understand, and comprehend mathematical procedures, techniques and abilities through a deeper investigation and critical analyses of students’ own customs and cultures. In Brasil, the use of Bakairi body painting in Bakairi schools facilitates the comprehension of spatial relations such as form, texture, and symmetry; which are 170
excellent for the construction and the systematization of geometrical knowledge by allowing students to experience academic mathematical language through a cultural lens (Rosa, 2005). In this context, the use of artifacts from cultural groups in educational settings that can raise students’ self-confidence, enhance and stimulate their creativity, and promote their cultural dignity (D’Ambrosio, 2001). The use of ethnomathematics as pedagogical action restores a sense of enjoyment or engagement and can enhance creativity in doing of mathematics. ETHNOMODELING Studies conducted by Urton (1997) and Orey (2000) have shown us “sophisticated mathematical ideas and practices that include geometric principles in craft work, architectural concepts, and practices in the activities and artifacts of many indigenous, local, and vernacular cultures” (Eglash et. al, 2006, p. 347). Mathematical concepts related to a variety of mathematical procedures and cultural artifacts form part of the numeric relations found in universal actions of measuring, calculation, games, divination, navigation, astronomy, and modeling (Eglash et. al, 2006). The term translation is used here to describe the process of modeling local cultural systems, which may have a Western academic mathematical representation (Eglash et. al, 2006; Orey & Rosa, 2006). Indigenous designs may be simply analysed as forms and the applications of symmetrical classifications from crystallography to indigenous textile patterns (Eglash et. al, 2006). On the other hand, ethnomathematics uses modeling to establish the relations found between local conceptual frameworks and mathematical ideas embedded in numerous designs. We define this relationship as ethnomodeling because “the act of translation is more like mathematical modeling” (Eglash et. al, 2006, p. 348). In some cases, translation into Western-academic mathematics is “direct and simple such as that found in counting systems and calendars” (Eglash et. al, 2006, p. 347). For example, the mathematical knowledge that lace makers in the northeast of Brasil use to make geometric lace patterns, (Figure 1) have mathematical concepts that are not associated with traditional geometrical principles, which may be modeled through the techniques of ethnomodeling.
Figure 1. Geometric lace patterns.
171
Ethnomodeling takes into consideration diverse processes that help in the construction and development of scientific and mathematical knowledge, which includes collectivity, and overall sense of and value for creative invention. It may be considered as the intersection region of cultural anthropology, ethnomathematics, and mathematical modeling (Figure 2).
Figure 2. Ethnomodeling as the intersection region of three knowledge fields.
The processes and production of scientific and mathematical ideas, procedures, and practices operate as a register of the interpretative singularities that regard possibilities for symbolic constructions of the knowledge in different cultural groups. In this context, mathematics is not a universal language after all, because its principles, concepts, and foundations are not always the same around the world. By using ethnomodeling as a tool towards pedagogical action of the ethnomathematics program, students can be shown to learn how to find and work with authentic situations and reallife problems (Rosa & Orey, 2010, p. 60). GENERAL ASSERTION Ethnomathematics is a contemporary pedagogical trend in education (Scientific American-Brasil, 2005). The world’s economy is globalized, yet, traditional mathematics curricula neglects, indeed often rejects contributions made by nondominant cultures. An ethnomathematical perspective offers new and expanded definitions of a given society’s particular scientific contributions. Pedagogically, ethnomathematics allows school mathematics to be seen “as the process of inducting young people into mathematical aspects of their culture” (Gilmer, 1990, p. 4). An ethnomathematics perspective reshapes cultural identity in a positive way by requiring the inclusion of a greater representation of practices and problems of a student’s own community (D’Ambrosio, 1995).
172
Ethnomathematics helps both educators and students alike to understand mathematics in the context of ideas, procedures, and practices used in their day-to-day life. It further encourages an understanding of professional practitioners, workers, and academic or school mathematics. Such depth is accomplished by taking into account historical evolution and the recognition of natural, social and cultural factors that shape human development (D’Ambrosio, 2001). SOME PRACTICAL IDEAS AND EXAMPLES So, how to go about doing this? How does this relate to creativity and mathematics? Toliver (2008) has for years offered an interesting tool she named a Math Trail by which we considered connecting our thinking to the mathematics found in the cultural context of a neighborhood school. She has said that in this activity, she saw a way to get her students working with each other, in a way to have them become active learners, and to increase their respect for their own community. Together with mathematical modeling we have used this perspective in Nepal, Guatemala, United States, and Brasil. We have shared here examples that engendered a great deal of creativity in groups of learners. An exploration of Addresses in Ouro Preto In 2005, Prof. Orey was invited to participate as a visiting professor with the mathematics education group at UFOP. During that time he began working with a group of elementary school children attending one of the municipal schools in Ouro Preto, Minas Gerais, Brazil. That pilot study became the basis for the Ouro Preto Math Trail[3]. Prof. Orey visited the school and worked with the kids over a period of 8 months.
Figure 3. Students doing research in front of the school in Ouro Preto.
When a group of nine year old students were asked why the first house number on Rua Alvarenga began with a number 7 (Figure 3), automatically, the responses were “it is 7 meters from the bridge”. Upon exploration and discussion we found that it was not 7 meters.
173
Figure 4. Number 7 on Rua Alvarenga.
After some research we found that measurements in the historic center of Ouro Preto were once based on the old imperial units such as barras[4]. We took the distance from the end of the bridge to the door divided it by seven and found it closely resembled the barra unit and then realized that all the address were showing distances along the street. For example, my apartment building was at 130 Rua Alvarenga (130 barras from the beginning of the street). Kids from a rural aldeia[5] Coelhos[6], after visiting the Ouro Preto Math Trail, studied their own street and presented a plan to the mayor’s office. The result was that the houses in aldeia were renumbered! This approach allowed kids the opportunity to learn and use mathematics in order to make either a transformation or contribution to the community. The idea that learning mathematics and giving back to one’s community at the same time is motivating because it gives all us reason for hope. How many Paralelepípedos [7] are on the Rua Alvarenga? This was just one of a few activities that students developed in Ouro Preto. The activities gave a sense of importance and value to Ouro Preto, a World Cultural Heritage site that did not exist among the students of their university town. College students in the specialization program in Prof. Orey’s mathematical modeling class at the Universidade Federal de Ouro Preto were enlisted to create final projects related to Rua Alvarenga. The students divided themselves into a number of groups and asked to develop and solve problems related to Rua Alvarenga. One group developed a number of models that estimated the number of paralelepípedos (Figure 5).
Figure 5. Paralelepípedos on the Rua Alvarenga. 174
Transportation[8], Modeling, and Moodle[9] In June of 2013, millions of Brazilians went to the streets to protest corruption; the movement was spurred on by tremendous amounts of money spent on stadiums for the FIFA World Cup in 2014 while social services, health care, and education have suffered. The straw that broke the camel’s back so to speak was brought on by a sudden rise in transportation (mostly bus fares) across the country (Langlois, 2013; Orey, 2013). During this same time, Prof. Orey was teaching his online course entitled Seminar in Mathematical Modeling with 110 students enrolled across 2 states in 10 very diverse educational centers named polos [10]. Normally, a good portion of the course is devoted to forming groups and having the students find their own themes, but this semester everyone was encouraged to select transportation as a theme. Groups of students in all polos produced models regarding to the proposed theme. Both students and professor was to be courageous to use the moment and not be afraid of taking aspects of day to day events found in our daily lives and use these opportunities to teach, learn, and communicate mathematical findings. Because this seminar is a long-distance offering, each group recorded a 10 minute video and placed it on YouTube and shared the link on the class forum. A PowerPoint and a short paper used in the presentation describing their findings were shared with the class, professor and tutors. Each presentation shared a brief introduction on the development of the submitted work; information they gained through interviews with citizens and public transport users in their respective cities; questions related to the situations presented in the interviews; mathematical models built upon the data researched; possible solutions to the problems outlined, and conclusions and reflections. FINAL CONSIDERATIONS, THOUGHTS AND QUESTIONS If one borrows something from someone, then one is less than interested in truly incorporating it (D’Ambrosio, personal communication, email, January 23, 2008). Borrowing suggests that one wants to borrow it to do something, as in collecting something exotic to place in a museum shelf, or like a selection of food at any shopping mall. The act of borrowing is only important for a particular moment and does not serve for the present when diverse elements collide, live, and create new foods, music, science and of course mathematics as is happening in numerous locations in the Americas. When we borrow, we are acquiring objects or ideas with less thought or any sense of mindfulness to where they come from or how they came to be. Borrowing is often less interested in knowing the culture of the other. In a communication, D’Ambrosio (personal communication, email, January 23, 2008) shared with me that if culture A meets culture B, then three things may happen: a) Culture A eliminates culture B. 175
b) Culture A is absorbed by culture B. c) Culture A assimilates culture B and produces culture C, that is, A + B = C. What D’Ambrosio (personal communication, email, January 23, 2008) was speaking about is also related to work done by Walker and Quong (2000) in which it is necessary to confront the limits of uniformity. Who equate borrowing with sameness? Instead of finding models that encourage diversity, many of our social and educational institutions have grown to force sameness, often as an outgrowth of the trend towards globalization, which has, in turn: (…) promoted the phenomenon of sameness, or what can be labeled “cultural borrowing”. (…) Questions naturally arise about the relevance, applicability, validity, and appropriateness of theories, perspectives and policies which are transferred to, or borrowed, adopted by education systems whose cultures and situational conditions are quite dissimilar from those in which they were conceived (Walker & Quong, 2000, p. 7374).
According to this context, one of the goals of any educational system should be fostering creative students. Creativity is a dynamic property of the human mind that can be enhanced and should be valued. Therefore, it is important to study creativity and determine its characteristics. Nature of mathematics through ethnomathematics provides a suitable platform for developing creativity. On the other hand, ethnomathematics is closely aligned with the types of encounters in what D’Ambrosio (personal communication, email, January 23, 2008) calls cultural integration. It seems to us that cultural borrowing, a process of sameness and by which the good and the accepted has already been defined from the outside, cannot fit within the aforementioned dynamics. In closing, we are left with a number of questions from our research that we look forward to looking into: 1. What happens when non-represented or non-majority cultures begin a process of borrowing? What does this borrowing infer, especially when technology gives them access to new mathematical ideas and vice versa? Is there a sharing between both parties, and just a taking of one by the other? 2. Can a reverse sense of cultural borrowing also happen? Especially in places with great cultural diversity such as Nepal, Brasil or California? Or is it a reverse colonization? Or can technology be mindfully used to what D’Ambrosio (2001) calls true cultural integration? 3. By using ethnomodeling, more traditional ideas are studied, categorized, and incorporated, how might this be reflected in and create new forms of mathematics? 4. How does technology influence borrowing? Does it accelerate the process, especially in rich environments such as long distance education, mobile learning, smart phones, and internet? 176
5. How might we use new technologies to create a dialogue by which all mathematical ideas contribute to the good of all humanity? NOTES [1] A huipil (from the Nahuatl uipilli, meaning blouse) is a form of Maya textile tunic or blouse worn by indigenous Maya women in southern México, Guatemala, Belize, El Salvador, western Honduras, and in the northern part of Central America. [2] Mathematization is a process in which members from distinct cultural groups develop different mathematical tools that can help them to organize, analyze, comprehend, understand, and solve specific problems located in the context of their real-life situations. [3] Retrieved from: https://sites.google.com/site/trilhadeouorpreto/projeto-piloto-escola-municipalalfredo-baeta. [4] The older standard linear measure that originated from measurements of area and volume was conceived in Egypt around 3000 BC. This measure was once called a cubit or bar, based on the length of the arm to the tip of the middle finger. Colonial Brazil, in the time of e Portuguese-Brazilian Empire, used a system that was often confusing and diverse in its measures because length was often measured in barras, and this pattern could vary from person to person, and region to region in Brasil and did not allow for a high precision in its measurements. [5] Village. [6] Rabbits. [7] Cobblestones. [8]https://sites.google.com/site/meuetnomate/home/modelagem-matematica-mathematicalmodeling [9] Courses in long-distance education as part of Universidade Aberta do Brasil offered through the Centro de Educação Aberta e a Distância at the Universidade Federal de Ouro Preto use moodle as the platform. [10] Some of the polos are located in small towns in the interior of Brasil and others in urban centers.
REFERENCES D’Ambrosio, U. (1990). Etnomatemática. São Paulo, SP: Editora Ática. D’Ambrosio, U. (1995). Multiculturalism and mathematics education. International Journal on Mathematics, Science, and Technology Education, 26(3), 337-346. D’Ambrosio, U. (2001). Etnomatemática: elo entre as tradições e a modernidade. São Paulo, SP: Editora Autêntica. Devlin, K. (2000). The math gene: how mathematical thinking evolved and why numbers are like gossip. New York, NY: Basic Books.
177
Eglash, R., Bennett, A., O’Donnell, C., Jennings, S., & Cintorino, M. (2006). Culturally situated designed tools: ethnocomputing from field site to classroom. American Anthropologist, 108(2), 347-362. Florida, J. (2004). The rise of the creative class and how it's transforming work, leisure, community and everyday life. New York, NY: Basic Books. Gilmer, G. (1990). An ethnomath approach to curriculum development. ISGEm Newsletter, 5(2), 4-5. Langlois, J. (2013). Protesters take to streets in Brazil. USA Today. Retrieved from http://www.usatoday.com/story/news/world/2013/10/15/brazil-protests/2987211. Orey, D. C. (2000). The ethnomathematics of the Sioux tipi and cone. In Selin, H. (Ed.). Mathematics across culture: the history of non-western mathematics (pp. 239252). Dordrecht, The Netherlands: Kluwer Academic Publishers. Orey, D. C. (2013). What I want to be when I grow up. TEDx Sacramento. Retrieved from https://www.youtube.com/watch?feature=player_embedded&v=anZNPNEgm Us#at=36 Orey. D. & Rosa, M. (2006). Ethnomathematics: cultural assertions and challenges towards pedagogical action. The Journal of Mathematics and Culture, 1(1), 57-78. Rosa, M. (2005). The ethnomathematics of Bakairi Body Painting. NCTM Annual Meeting and Exposition: Embracing Mathematical Diversity. Anaheim, CA: NCTM. Rosa, M.; Orey, D. C. (2005). Las raízes histórica del programa etnomatemáticas. RELIME, 8(3), 363-377. Rosa, M.; Orey, D. C. (2010). Ethnomodeling: a pedagogical action for uncovering ethnomathematical practices. Journal of Mathematical Modelling and Application, 1(3), 58-67. Runco, M. A. (1993). Creativity as an educational objective for disadvantaged students. Storrs, CT: The National Research Center on the Gifted and Talented. Scientific American Brasil (2005). Etnomatemática: edição especial. São Paulo, SP: Ediouro Segmento - Duetto Editorial Ltda. Scott. R. P. (1992). Curriculum, resources, and materials for multicultural/multilingual classrooms. ISGEm Newsletter, 3-5. Toliver, K. (2008). National math trail. Retrieved from http://www.nationalmathtrail. org/. Urton, G. (1997). The social life of numbers: a Quechua ontology of numbers and philosophy of arithmetic. Austin, TX: University of Texas Press. Walker, A., & Quong, T. (2000). Valuing diversity in schools: leaders confronting the limits of uniformity. Mahwah, NJ: Laurence Erlbaum Associates. 178
CREATIVITY IN MATHEMATICS CLASS: HOW CAN IT EMERGE? Sandra Pinheiro, Isabel Vale School of Education, Polytechnic Institute of Viana do Castelo, Portugal
[email protected],
[email protected] This paper focuses on a part of a wider study conducted about creativity in mathematics associated with problem solving and problem posing at elementary level. In this study, we developed a didactical experience for which we carefully selected some tasks, which would provide different productions, representing diverse and creative ways of thinking of each dyad, calling forth their creative potential and giving them freedom to communicate creatively. It can be concluded that the proposed tasks promote creative potential in students bringing out in them the habit for discovery and making a difference, compared to others. INTRODUCTION In this competitive and changing world students need to develop and improve their ability to think creatively and solve problems (Conway, 1999). According to the Principles and Standards for School Mathematics (NCTM, 2007), problem solving is essential in all of mathematics learning. The process of teaching and learning of mathematics using problem solving allows students to obtain different forms of thinking, practices of perseverance and curiosity, fostering confidence when facing unknown situations, being these abilities of extreme importance in and beyond the classroom, mainly in daily life of each student. According to Silver (1997) mathematics teaching that includes problem solving and problem posing will promote in students the use of more creative approaches. PROBLEM POSING AND PROBLEM SOLVING According to the NCTM (2007) good tasks are those that allow the introduction of key mathematical concepts, thus constituting a challenge to students, enabling them to use different approaches. In turn, Leikin (2009) states that multiple-solution tasks are those that consider different solutions to the same problem, those with different representations of mathematical concepts and those that involve different properties of mathematical objects in different fields. Vale (2012) states that challenging problems usually require a different perspective, a complex and productive divergent thinking, mobilizing prior knowledge and requiring perseverance, constituting itself a challenge for the students. It is considered that divergent thinking involves looking at the problem, analyzing all the possibilities and searching for the best way to arrive at the solution to the problem (Vale & Pimentel, 2012). Carreira, S., Amado, N., Jones, K., & Jacinto, H. (Eds.) (2014). Proceedings of the Problem@Web International Conference: Technology, creativity and affect in mathematical problem solving. Faro, Portugal: Universidade do Algarve.
179
Polya (2003) refers that problem solving in a mathematics class will be impoverished without coordinating with problem posing. The benefit of incorporating problems in the teaching and learning process of mathematics is widely recognized by the community of mathematics education (e.g. Kontorovich, Koichu, Leikin, & Berman, 2011) and in being able to deepen the mathematical concepts involved as well as understanding the processes resulting from the resolution (Boavida, Paiva, Cebola, Vale & Pimentel, 2008). The literature on problem posing shows that this activity is relevant in various perspectives and also refers to the connections between problem posing and creativity. Creative activity is seen in the game made in the attempt to pose, to reformulate and eventually to solve a problem (Silver, 1997). Singer, Pelczer and Voica (2011) report that for having creative students in mathematics they should be able to put mathematical questions that extend and deepen the original problem, and solve problems in different ways, showing also the ability to pose problems, a condition of mathematical creativity. According to Singer, Ellerton, Cai and Leung (2011) to create a mathematical problem, we can induce students to achieve an authentic mathematical activity and to formulate their own problems begin to innovate, to create, to perform active learning (Shriki, 2013). CREATIVITY IN MATHEMATICS You can find creativity in all areas of human activity (e.g. arts, sciences, work, play) and everyone has any kind of creative abilities (National Advisory Committee on Creative and Cultural Education [NACCCE], 1999). Sriraman (2004) states that Henri Poincaré is marked by quite a few authors as being the pioneer in the study of creativity in mathematics. Creativity is intrinsically linked to mathematics, but the education system does not value it in mathematics teaching and learning (Silver, 1997). “Everyone is born with enormous creative abilities. But these skills have to be developed” (Robinson 2010, p. 64). Currently, creativity is seen as a skill that can be enhanced in students with an appropriate selection of tasks (Pelczer & Rodriguez, 2011). Despite being complex to define creativity Gontijo (2007) considers it as being the ability to propose different solutions, appropriate to a situation or problem, so that they illustrate different characteristic of the problem and/or different ways to solve it, particularly, unusual ways. Vale and Pimentel (2012) report that creativity is a forgotten subject by teachers during their math lessons may be because teachers have yet no knowledge on the subject and/or have not become aware of its relevance in mathematics education throughout the different levels of education. In fact, teachers and students need much more than merely the right and sound knowledge of mathematics to develop creativity in this area (Meissner, 2005). In this sense, Mann (2006) argues “the essence of mathematics is to think creatively, and not simply arrive at the correct answer” (p. 238). Leikin (2009), in turn, states that we must develop the mathematical creative potential of each student and this creative development should be a goal of school mathematics. Creativity can 180
be promoted through the use of non-routine problems and the teacher should be the supporter of a creative environment so that students are aware of their own abilities (Mina, 2008). Guerra (2007a) reinforced this idea when he says that creativity in mathematics education consists of a set of elements that contribute to see mathematics in the educational process as a surprising matter that develops flexible thinking, which encourages problem posing and situations that promote problem solving in a real context, that incites imagination, where the student dares to make mistakes and learns from his mistakes. Cavalcanti (2006) reported that, according to Morin (1998), “all learning should be rich in meaning for the learner (meaningful learning) and should be flexible to allow multiple views of the same problem (cognitive flexibility)” (p. 97). Silver (1997) and Guerra (2007a) argue that creativity is not just a characteristic of gifted and exceptional students, as in a classical view of creativity, but take a contemporary view of creativity in mathematics where creativity can be “promoted widely in the school population” (Silver, 1997, p. 75). To Sriraman (2004) “mathematical creativity is as a process that results in unusually insightful solutions to a given problem, despite the school level” (p. 51). These two lines of thought, classical and contemporary vision, although they differ in the type of people where you can find creativity, they converge when considering that creative activity results of directing the work of teachers to the creative methods of problem solving and posing (Leikin, 2009; Silver, 1997). Silver (1997) also notes that the connection of mathematics to creativity lies not only in the questioning, inquiring, but results from the connection between problem solving and problem posing and suggests that we can promote creativity in mathematics, but regarding the used way of teaching, that must be always extended to all students. Mann (2006) reminds us that in order for creativity to be recognized, appreciated and shared, it is necessary that the “development of mathematical communication skills” happens (p. 251). Pelczer and Rodriguez (2011) suggest that research in creativity in mathematics education, is supported in the belief that creativity can be present in all students and can be promoted using tasks with adjusted structure. According, also, with these authors, the initial reports in creative mathematics emerged in the context of the work of mathematicians such as Poincaré and Hadamard. Mathematical creativity is essential in the development of talent in mathematics but also very difficult to identify and to evaluate (Mann, 2006). Some authors (e.g. Balka, 1974; Conway, 1999; El-Demerdash & Kortenkamp, sd; Leikin, 2009; Mann, 2006) believe that the students' productions of problem solving must be analyzed taking into account three dimensions of creativity: fluency, flexibility and originality. Conway (1999) states that categories must be identified that include responses that the researcher believes are mathematically original or insightful. A procedure for assessing the three dimensions of creativity in problem solving consider for fluency the number of resolutions/different correct responses to a problem; for flexibility the number of resolutions/responses presented that illustrate different ways 181
of thinking that are different in nature, and for originality the number of unique or rare responses, compared with the resolutions of the class. Thus, problem solving is a privileged context for the study of creativity in mathematics classroom. This study followed up this perspective in the analysis of creativity in terms of problem solving. According to Kontorovich, Koichu, Leikin and Berman (2011), many researchers consider that problem posing tasks can be a powerful tool for assessment of creative mathematics. In this study, problem posing followed the classification used by Stoyanova and Ellerton (1996), recurring to semi-structured situations, since the open situations presented to the dyads were photos, drawings, expressions, from which the dyads were asked to create problems. Students have different backgrounds and skills, which leads to showing different potentials and different levels of creative thinking (Siswono, 2011). This author, after an investigation, indicates levels of creative thinking, based on the dimensions of creativity - fluency, flexibility, originality – for problem solving and problem posing. Leikin, Koichu and Berman (2009) regard for assessing problem posing also the same dimensions of problem solving. They consider for fluency the number of issues raised that fit the requirements of the task, for flexibility the number of different types of problems posed; and for originality the number of problems posed that are unique or rare. In this study, the procedure followed for the analysis of problem posing was an adaptation of the method in terms of originality, given that this dimension will be considered for different types of problems that are unique or rare placed, the latter being a maximum of two dyads. In this study we chose to adapt these levels to the creative performance of the dyads. Thus, we present four levels of creative performance, from level 0 to level 3, respectively from the least to the most creative performance, according to the dimensions of creativity applied to problem solving and problem posing. The respective characteristics of creative performance levels are shown in the following table: Table 1. Characteristics of levels of creative performance adapted by Pinheiro (2013) from Siswono (2011).
Level
Characteristics of creative performance levels
Level 3
The dyad is able to solve problems with more than one solution and can present another way to solve it. The solution has originality. Can pose new problems. A problem has different solutions and different methods to solve it. Some problems constructed show originality, fluency and flexibility. The dyad tends to say that building a problem is more difficult than solving a problem, because in the resolution of problems there is a right way to reach the solution.
Level 2
The dyad is able to solve a problem with more than one solution but cannot introduce another way to solve it. The solution has originality. Moreover, they can pose an original problem. The problem has different solutions and different methods to solve it. They can use a different method for the construction of a problem.
182
Level 1
The dyad is able to solve a problem with more than one solution but cannot represent another way to solve it. No solution has originality. Are able to pose some problems. However the problem does not show up completely. The construction of problems complies with fluency, unoriginality or flexibility. The dyad tends to understand that different methods or strategies for solving a problem are another way of resolution.
Level 0
The dyad cannot solve a problem with more than a solution and cannot represent another way to solve it. The solutions do not show originality, fluency and flexibility. They are not able to pose problems with originality and flexibility. The problems do not meet the originality, fluency flexibility. The errors are caused by lack of understanding of related concepts. The dyad considers that the construction of a problem is easier than solving a problem. The problems are not mathematically possible.
During this study, the productions of the class and the dyads were analyzed in terms of creative thinking and will be categorized according to the levels previously reported. CONTEXT AND METHODOLOGY In this paper we describe the results of part of a broader qualitative study, that followed a case study design, in order to analyze and understand how it is possible to develop students' creativity through problem solving and problem posing (e.g. Stake, 2009; Yin, 2011). The researcher assumed a dual role in this study, teacher/researcher, observer and participant, with a privileged role in data collection, which, according to Yin (2011), reinforces the idea that the researcher is the first source in collecting data. The design of the didactical experience resulted through intensive study both in the field of problem solving and posing and in the field of creativity. The criteria for selecting the cases, which were aimed to obtain as much information about the problem under study, focused on students with different achievement levels and that were particularly good communicators, revealing abilities in terms of writing and speaking. The didactical experience took place along math classes in a 5th grade class of twentyone students, from nine to eleven years old, organized in dyads. This research, as mentioned above, aimed to study students' creativity through problem solving and posing, taking into account the types of tasks and analyzing the representations that students use in their resolutions. The implementation of the tasks of this study took place over seven sessions, each having duration of ninety minutes, where each dyad was proposed two tasks, in problem solving and problem posing, thus totalizing seven problem solving tasks and seven problem posing tasks. In each session, each dyad received a file folder, which contained the two new tasks. Each dyad managed the time available to carry out the tasks. In this sense, it has become pertinent to explore different strategies for solving problems, providing students with tools that facilitated the achievement of tasks (Pinheiro & Vale, 2013). In this paper only the resolutions of two dyads will be analyzed in the context of problem posing. 183
In this learning proposal, in which tasks had a key role, we followed the model of Stein, Engle, Smith and Hughes (2008), having done prediction about tasks resolutions, together with the work performed by dyads during the application of tasks in a relaxed atmosphere; selected students for the presentation of their work to the class, organized the work, sequenced the productions of students from the most common to the most different and selected the students to make their presentations; promoted discussion with the class; and showed the connections between the resolutions and mathematical ideas. The mathematical content approached in the didactical experience was the “nonnegative rational numbers”. In all tasks, students were asked to analyze, solve and discuss the tasks proposed, giving emphasis to the statement, whether oral or written, including the representations made by the students. Data collection was carried out in a holistic manner, using field notes, two questionnaires, interviews and written comments from students, that included productions made in the classroom. To better understand if students had an idea of creativity in mathematics, an inquiry was conducted in the early operationalization of the study. At the end of the implementation of the tasks, students filled a questionnaire that expressed their opinion about the creativity of tasks and if they were promoters of creative productions, the degree of difficulty of the tasks, as well as the methodology that was carried out in the dyads. We also used interviews to both dyads that constituted the cases under study. Throughout this study all data collected during the research (e.g. the productions of dyads, the audio and video records, field notes, written investigative reports based on observations, recordings, written documents) were carefully organized and analyzed according to the problem under study and the theoretical framework adopted and, in parallel, responding to the research questions. RESULTS AND DISCUSSION In the tasks1 of problem solving and problem posing varied contexts were presented in order to allow different interpretations, ideas and problems. Problem solving
Figure 1. Example of problem solving task. 184
This task was one of the last because we considered the degree of complexity to be high. For this task, it was expected that students represented fractions in “block”, without leaving blanks in different parts. This dyad represented fractions as expected, Figure 2.
Figure 2. Most common resolution.
This dyad, on the other hand, had another solution, this time separating the pieces representative of each “block” of each fraction (Figure 3), which a small number of dyads also did.
Figure 3. Unusual resolution.
This dyad, unpredictably, presented two resolutions, one dividing the grid into two parts and another into four parts, Figure 4, and further stated that there were more solutions, drawing an ellipsis to reinforce this idea and claimed: “Yes. There are more ways to represent this situation.”
Figure 4. Quite rare resolutions.
Problem posing
Figure 5. Example of problem posing task.
For this task, an original proposal made by a dyad stood out from the others (Figure 6), since no other dyad presented a formulation with a problem of this type. The dyad created the following problem: “Diogo invited 20 friends to his party and placed 185
successively in the 20 plates 2 napkins, as in figure 1 and figure 2. What was the disposition of the napkins on the twentieth plate? Reply: Just as shown in Figure 2.”
Figure 6. Formulation and resolution for the respective task.
This is a problem that, despite a disorganized statement, in terms of language, makes clear the objective of the problem. It's simple enough for the level of education, however, the dyad contextualizes the problem in order to work a repeating pattern, which is a topic rarely addressed by students. Regarding the performance of the dyads, we present an overview of the results of the work undertaken, the two case studies and the remaining dyads of the class in table 2 and table 3. The tables summarize the results that are based on the three dimensions of creativity - fluency, flexibility, originality - either to solve problems or to formulate problems, evidenced by the performance of Matmasters, the Resolucionistas and the class, in each of the proposed tasks. In each task points were assigned to all dimensions: fluency, one point for each correct solution or resolution; flexibility, one point for each solution or resolution of a different nature, originality, one point for every single solution or resolution or unique (original). It is considered as unique if in maximum two dyads present the same solution and/or resolution. For the other dyads of the class, it was used the same process of assignment, writing down in the table the maximum score obtained for each dyad in each dimension and in each task. After a thorough analysis of all the work done, it was possible to complete table 2. Table 2. Performance of the two case studies and the class in the context of problem solving. Problem solving Tasks
All
Dyads
Dimensions of Creativity Fluency
Flexibility
Originality
Matmasters
5
4
2
Resolucionistas
4
2
0
Class
5
2
1
Looking closely to the data in table 2, we find that we have several variations depending on the dyad and on the task. It can be seen that the dyad showing, globally, 186
better performance in problem solving at the level of the dimensions of creativity is Matmasters. For problem posing, we used the same table structure used in problem solving that draws upon the three dimensions of creativity - fluency, flexibility, originality - but applied to problem posing. This analysis was done on all the tasks. In this sense, the performance of Matmasters, Resolucionistas and of the class, in terms of fluency, flexibility and originality, was displayed. Counting the number of situations proposed in problem posing, a total of eight points were assigned in each of the dimensions: fluency, one point for each problem set according to the proposed situation and the possibility of withdrawal; flexibility, one point for each type of problem, created in accordance with the proposed system and possibility of resolution; originality, one point for every single problem created unique, according to the proposed situation and possibility of resolution, and considered unique when a maximum of two dyads present a problem of the same type. In terms of class we used the same process, registering in the table 3, the dyad with the higher score on that dimension among all the dyads in the class. After a careful analysis of all the work, it was possible to complete table 3. Table 3. Performance of the two case studies and the class in the context of problem posing (Pinheiro, 2013). Problem posing Tasks
All
Dyads
Dimensions of Creativity Fluency
Flexibility
Originality
Matmasters
8
3
2
Resolucionistas
8
2
3
Class
7
3
1
Analyzing the data in table 3, we can see that the two dyad-cases, Matmasters and Resolucionistas, despite the low significance of the results, in general, had better performance in problem posing, in terms of the dimensions of creativity, in relation to the rest of the class. Given the collected data, you can analyze the creative performance of the dyads, considering features of problem solving and problem posing revealed in the dyads productions based on the dimensions of creativity - fluency, flexibility, and originality. According to those dimensions it is possible to say that Matmasters fall within the level 3 of creative performance, since the dyad has been able to solve problems with more than one solution and presented another way to solve them. Still, in problem solving, solutions or resolutions presented showed originality in the group context. In terms of problem posing, for each situation proposed they could make at least one problem, thereby meeting the fluency. However, it also showed flexibility and originality in posing. A dyad, throughout the interviews, said that they had more difficulty in 187
formulating problems than in solving them, because to solve a problem “is only to understand and figure out how to get to the answer.” In contrast, Resolucionistas and the class fall within Level 2 of creative performance since they managed to solve a problem with more than one solution but occasionally were able to present another way to solve it. On the other hand, at least one of the resolutions or solutions showed originality. They were also able to formulate unique problems in terms of type, also showing some flexibility. FINAL REMARKS In this era of quick changes, students must feel that mathematics learning in schools emerges from the resolution of rich problematic situations, where students can create, share ideas and reason, promoting either mathematical thinking or creative thinking, facing mathematics positively and becoming active and critical citizens in society (Pinheiro, 2013). It becomes vital to break with traditionalism and, according to Robinson (2010), to allow students to explore truly their abilities, meeting their own expectations. Students worked hard throughout the school year having the opportunity to draw on a diverse set of strategies of problem solving. On the other hand, they were encouraged to demand more, better and different solutions, promoting, in this way, divergent thinking (Pinheiro & Vale, 2012) and allowing, when faced with a task, to use their own potential tools. The development of the didactical experience in dyads has revealed to be very motivating for students and simultaneously efficient with respect to performance (Pinheiro & Vale, 2013b). Problem posing cannot be unconnected from problem solving because they form a whole. As mentioned previously, students were not familiar with this type of tasks. However, several of the dyads productions, since it was something that “comes naturally to children” (NCTM, 2007, p. 58), emerged in the problem posing, revealing itself creative, since all the dimensions of creativity are patent there (Kontorovich, Koichu, Leikin, & Berman, 2011). The work around creativity based on problem solving and problem posing provided varied experiences, rich and challenging, fostering different higher order cognitive skills, such as problem solving itself but also reasoning and communication, idea shared by Vale (2012) and raised by the students through a set of diverse and representative productions of different ways of thinking creatively. All over the questionnaires several interesting ideas emerged from students responses. However it is worth to note two comments from two students who, in short, were able to express a lot: “creativity is not only art but the way (ability) to think” and “[math] is a creative discipline and it is with creativity that you can learn mathematics”.
188
NOTES 1. Adapted from the didactical materials of the Master classes of Didactics of Mathematics and Sciences.
REFERENCES Balka, D. (1974). Creativity ability in mathematics. Aritmetic Teacher, 21, 633-636. Boavida, A., Paiva, A., Cebola, G., Vale, I., & Pimentel, T. (2008). A experiência Matemática no Ensino Básico - Programa de Formação Contínua em Matemática para Professores dos 1.º e 2.º Ciclos do Ensino Básico. Lisboa: Ministério da Educação - Direcção-Geral de Inovação e de Desenvolvimento Curricular. Cavalcanti, J. (2006). A criatividade no processo de humanização. Saber (e) educar, 11, 89-98. Conway, K. (1999). Assessing Open-Ended Problems. Mathematics Teaching in the Middle School, 4, 510-514. El-Demerdash, M., & Kortenkamp, U. (s.d.). The development of an Instrument to Measure Geometric Creativity. Obtained january, 2012, in http://cinderella.de/material/gkt/files/gct_paper.pdf Gontijo, C. (2007). Relações entre criatividade, criatividade em matemática e motivação em matemática em alunos do ensino médio. Tese de doutoramento. Universidade de Brasília, Brasília. Guerra, E. (2007a). Creatividad en Educación Matemática. In S. d. Torre, & V. Violant, Compreender y Evaluer La Creatividad (Vol. 1, pp. 457-469). Archidona, Málaga: Aljibe. Guerra, E. (2007b). Creatividad y desarrollo professional docente em Matemáticas para la Educación Primaria. Tese de Doutoramento. Universidade de Barcelona: Barcelona. Kontorovich, I., Koichu, B., Leikin, R., & Berman, A. (2011). Indicators of creativity in mathematical problem posing: How indicate are they? Proceedings of the 6th International Conference Creativity in Mathematics (pp. 120-125). Latvia: Latvia University. Leikin, R. (2009). Exploring mathematical creativity using multiple solution tasks. In R. Leikin, A. Berman, & B. Koichu, Creativity in Mathematics and the Education of Gifted Students (pp. 129-145). Rotterdam, the Netherlands: Sense Publishers. Leikin, R., Koichu, B., & Berman, A. (2009). Mathematical giftedness as a quality of problem-solving acts. In R. Leikin, A. Berman, & B. K. (Eds.), Creativity in Mathematics and Education of Gifted Students (pp. 115-128). Rotterdam: Sense Publishers.
189
Mann, E. (2006). Creativity: The Essence of Mathematics. Journal for the Education of the Gifted, 30(2), 236-260. Meissner, H. (2005). Creativity and Mathematics Education. Paper presented at the The third East Asia Regional Conference on Mathematics Education. Retrieved from http://www.math.ecnu.edu.cn/earcome3/sym1/sym104.pdf . Mina, F. (2008). Promoting Creativity for all students in Mathematical Education. Paper presented at the The 11th International Congress on Mathematical Education, Monterrey, México from http://dg.icme11.org/tsg/show/10 . NACCCE. (1999). All Our Futures: Creativity, Culture and Education. London: NACCCE. NCTM. (2007). Princípios e normas para a matemática escolar (1ª edição). (M.Melo, Trad.) Lisboa: Associação de Professores de Matemática (APM). Pelczer, I., & Rodríguez, F. G. (2011). Creativity assessement in school setting through problem posing tasks. The Montana Mathematics Enthusiast, 8, n.º 1 e 2, 383-398. Pinheiro, S. (2013). A criatividade na resolução e formulação de problemas: Uma experiência didática numa turma de 5º ano de escolaridade. Viana do Castelo: Escola Superior de Educação do Instituto Politécnico de Viana do Castelo. Pinheiro, S., & Vale, I. (2012). Criatividade: onde a encontrar na sala de aula? Atas do XXIII Seminário de Investigação em Educação Matemática (pp. 621-636). Lisboa: APM. Pinheiro, S., & Vale, I. (2013a). Criatividade e Matemática: Um caminho partilhado. Ensinar e Aprender Matemática com Criatividade dos 3 aos 12 anos (Atas) (pp. 3039). Viana do Castelo: Escola Superior de Educação do Instituto Politécnico de Viana do Castelo. Pinheiro, S., & Vale, I. (2013b). Formulação de problemas e criatividade na aula de matemática. In Fernandes, J. A., Martinho, M. H., Tinoco, J., & Viseu, F. (Orgs.) (2013). Atas do XXIV Seminário de Investigação em Educação Matemática. APM & CIEd da Universidade do Minho. Polya, G. (2003). Como resolver problemas (1.ª ed.). (L. Moreira, Trad.) Lisboa. (Trabalho original publicado em 1945): Gradiva. Robinson, K. (2010). O Elemento. Porto: Porto Editora. Silver, E. (1997). Fostering creativity through instruction rich in mathematical problem solving and problem posing. ZDM, 3, 75-80. Singer, F. M., Pelczer, I., & Voica, C. (2011). Problem posing and modification as a criterion of mathematical creativity. In T. Rowland, & E. Swoboda (Eds.), Proceedings of the 7th Conference of the European Society for Research in Math Education (CERME 7) (pp. 1133-1142). Poland: University of Rzeszów.
190
Singer, F., Ellerton, N., Cai, J., & Leung, E. (2011). Problem posing in Mathematics Learning and Teaching: a Research Agenda. In Ubuz, B. (Ed.), Developing mathematical thinking. Proceedings of the 35th PME, vol 1, pp. 137-166(Research forum). Ankara, Turkey. Siswono, T. Y. (2011). Level of student's creative thinking in classroom Mathematics. Educational Research and Review, 6(7), 548-553. Sriraman, B. (2004). The characteristics of mathematical creativity. The Mathematics Educator, 14(1), 19–34. Shriki, A. (2013). A Model for Assessing the Development of Students’ Creativity in the Context of Problem Posing. Creative Education, Vol.4, No.7, 430-439, Retrieved from http://www.scirp.org/journal/ce. Stake, R. (2009). A Arte da Investigação com Estudos de Caso (2.ª ed.). Lisboa. (Trabalho original publicado em 1995): Fundação Calouste Gulbenkian. Stein, M., Engle, R., Smith, M., & Hugues, E. (2008). Orchestrating Productive Mathematical Discussions: Five Practices for Helping Teachers Move Beyond Shown and Tell. Mathematical Thinking and Learning, 313-340. Stoyanova E., & Ellerton N. F. (1996). A framework for research into students’ problem posing in school mathematics. In P. C. Clarkson (Ed.), Technology in mathematics education (pp. 518–525), Mathematics Education Research Group of Australasia: The University of Melbourne. Vale, I. (2012). As tarefas de padrões na aula de Matemática: um desafio para professores e alunos. Interações, 20, 181-207. Vale, I., & Pimentel, T. (2012). Um novo-velho desafio: da resolução de problemas à criatividade em Matemática. In A. P. Canavarro, L. Santos, A. M. Boavida, H. Oliveira, L. Menezes, & S. Carreira (Ed.), Investigação em Educação Matemática Práticas de Ensino da Matemática (pp. 347-360). Lisboa: SPIEM. Yin, R. (2011). Qualitative Research from Start to Finish. New York: The Guilford Press.
191
STRATEGIES USED BY ELEMENTARY GRADE STUDENTS IN MATHEMATICS OLYMPIAD TESTS Márcia Jussara Hepp Rehfeldt, Marli Teresinha Quartieri, Maria Madalena Dullius Centro Universitário UNIVATES
[email protected],
[email protected],
[email protected] The Mathematics Olympiad of Univates (OMU) has the purpose of arousing the students’ interest in solving mathematical problems and challenges. It also aims at stimulating the students to solve challenging and engaging problems. The tests consist of ten questions and are designed for the students from the 5 th elementary grade to the last year of high school. In this work, the purpose is to share some strategies used by the students in solving OMU 2012 questions. It can be noted that calculation is still the manner most used by the students. However, it must be emphasized that some solutions may be considered rather creative, showing ability in solving situations by means of the students’ own strategies, but with mathematical foundation. INTRODUCTION Problem-solving is cited in the National Curricular Parameters (PCNs) (Brasil, 1998), as the starting point for mathematics activities, giving the opportunity to develop the capacity of activating knowledge in various fields. The referred documents mention: To understand the demands of the current work, it is undeniable that mathematics can contribute substantially to the measure that explores problem-solving and the construction of strategies as a way of teaching and learning mathematics in the classroom. Also, the development of the capacity for investigating, arguing, proving, justifying, and stimulating creativity, for the individual and collective work initiative, favor the development of these capacities (Brasil, 1998, p. 34). In this sense, Dante (2000) affirms that the solution of problems can help the teacher in
reaching one of the mathematics teaching objectives, which is achieving the student’s productive thinking. Thus, it is interesting to show the pupils problem situations that involve, challenge, and motivate them in the desire for their solution. With the purpose of stimulating students and teachers in solving challenges and contextualized problems, a team of UNIVATES University Center teachers and scholarship holders has held the Univates Mathematics Olympiad (OMU) since 1996. This event is an Institutional Extension project that depends upon the help of the National Research Coordination (CNPq). The condition for the participation of a school consists in having participated in the Brazilian Mathematics Olympiad (OBM). The general purpose of the OMU aims at the fostering of taking pleasure in mathematics and the development of logical-mathematical reasoning and creativity through the solution of problems and challenges. Moreover, one has the intention of 192 Carreira, S., Amado, N., Jones, K., & Jacinto, H. (Eds.) (2014). Proceedings of the Problem@Web International Conference: Technology, creativity and affect in mathematical problem solving. Faro, Portugal: Universidade do Algarve.
stimulating the teachers to bring challenging questions to the classroom. Students from the 5th grade (former 4th grade) of the Elementary School to the 3rd grade of the High School participate in the OMU. This event includes various activities carried out during the year, among which are: publication of the event; acquisition, selection, and elaboration of the questions; test application and correction; pupils’ reply analysis; records preparation; awards ceremony. In this article, we shall present some strategies used by the pupils of the Elementary School (from the 5th through the 9th grade) in the 15th edition of the Mathematics Olympiad held in 2012. THEORETICAL APPROACH Surveys have shown that students show disinterest in mathematics and difficulties in solving problems. In this context, alternatives are discussed that motivate the students, making them feel stimulated and challenged. Moreover, mathematics is understood as an expression not disconnected from the other subjects and everyday life. One of the actions that worldwide have shown effectiveness is the Mathematics Olympiad, which according to Bragança (2013, p. 6) has the following objectives: to provide an adequate environment to let the students, mainly those of the elementary and high school grades, discover their aptitudes and have the opportunity to apply their mathematical abilities; to have contact with the academic space that favors the teacher’s development; to contribute encouraging and developing taking pleasure in mathematics; and to improve the teaching system, encouraging teachers to improve and find new resources for the enrichment of their classes.
In accordance with these objectives, one observes that the solution of problems can be considered an important contribution to the teaching and learning process of mathematics. Moreover, it allows the student the capacity to develop mathematical thought, not limiting him/herself to routine and uninteresting exercises that evaluate the learning process by reproduction and imitation. In this way: [...] it is possible by means of solving problems to develop the student’s initiative, exploring spirit, creativity, independence, and the ability to elaborate a logical reasoning and intelligent and efficient use of the available resources to make him/her propose good solutions to the questions that appear in his/her daily life, at school and outside it (Dante, 2000, p. 25).
The students, by solving problems, can discover new facts, motivating them to find other solution forms and arousing curiosity and the interest for mathematical knowledge. In this way, they develop the capacity for solving the situations that are presented to them. However, raising in the student the taking pleasure in solving problems is not an easy task, since there are many moments of difficulties, obstacles, and errors. For Cavalcanti (2001, p. 121): To encourage the students to find different ways for the solution of problems allows a more elaborate reflection on the solution processes, be they through the traditional algorithms, 193
drawings, schemes, or even through verbal responses. Accepting and analyzing the different solution strategies as valid and important stages of the thought development allows the learning process by reflection and helps the student gain autonomy and confidence in his/her capacity to think mathematically.
Investigations have implied that one of the strategies used by the students in problemsolving is formal calculation (Dullius et al, 2011). However, it is up to the teacher to provide problems that allow the use of different strategies. The problem solving approach can enable the student to choose the path he/she wants to go through to get to the solution, as it mobilizes different knowledge bases to come up with an answer. Regarding the use of different strategies, Musser and Shaughnessy (1997, p. 188), highlight five ways that should be addressed at school in problem-solving: trial and error; standards (solution of individual cases finding patterns to be generalized); solving a simpler problem; working in reverse; and simulation (solution that involves conducting an experiment). Cavalcanti (2001), however, highlights drawing as an interesting strategy, as it allows the teacher “clues” of how his/her student was thinking while solving a problem. Dullius et al (2011), by analyzing the test questions of high school students, found the following solution strategies: design, calculation, charts and graphs, trial and error, standards organization, reverse, lowering the unit. The most used strategy was calculation, followed by trial and error. Dante (2000) suggests that teachers show the students different strategies for problem solving, such as: trial and error, search for patterns or generalizations, solving a simpler problem, reducing to the unit, going in the opposite direction. For the author, providing students with diverse strategies helps in finding the correct solution of the problems. Moreover, the knowledge of different strategies for solving problems can also help in the development of creativity. Creativity in mathematics, according to Gontijo (2006), comprises the ability to find ways and paths to solving problems, creating formulas and finding unique methods to solve non-traditional problems. Therefore: We will consider creativity in mathematics as the ability to present numerous possibilities of appropriate solutions to a problem situation, so that they focus on different aspects of the problem and/or differentiated ways to solve it, especially unusual forms (originality), both in situations that require solution and preparing of problems and in situations that require sorting or organization of objects and/or mathematical elements according to their properties and attributes, either textually, numerically, graphically or in the form of a sequence of actions (Gontijo, 2006, p. 4).
Thus, the student, by presenting different strategies of appropriate solutions to the proposed situation, will be demonstrating beyond knowledge of content, creativity in mathematics. A competition like the Mathematics Olympiad can provide interesting situations in which creativity is developed. In the next section we will describe some important information about the OMU.
194
THE UNIVATES MATHEMATICS OLYMPIAD - OMU The activities for the OMU realization begin in March each year, with the release of the event to the schools of the Taquari Valley region and neighboring regions, with the scholarship holders sending the required and relevant information. At the same time, in this month the scholarship holders perform searches for questions that excel by the use of logical reasoning, to be selected in an initial screening. This search is conducted through research into websites, books, and magazines, among others. Later begins the process of creating original questions by teachers of the Organizing Committee. These questions are prepared, by class, in which we will approach the content provided in the curriculum minimum of each class/year, and are mainly questions that develop logical reasoning. The OMU occurs in two phases: the first phase is the Brazilian Mathematical Olympiad (OBM) held in July in the participating schools; and, the second is the Olympiad held at Univates, usually in the month of September. In 2012, 9,476 elementary and high school students participated in the OBM, and in the Mathematics Olympiad of Univates 2,170 students participated, from 61 schools and 20 municipalities. Students from the 5th grade of elementary school to the high school level participate in the OMU. The test is applied in a single session in the institution and lasts for three hours. With respect to the test, some relevant points are highlighted. First, the possibility of making the test in couples, i.e., in pairs. Approximately 95% of the participants have chosen to carry out the tests in this way. It reinforces the idea of the importance of social exchanges, cooperation and collaboration, which are topics of wide discussion in teaching. Students can also use a calculator. Although there is no indication of the need for the use of the calculator, its use is allowed. This has brought comfort to the participants, who feel more secure and confident. There is also the possibility of choice of the questions, because the test consists of 10 questions, among which it is sufficient that the student choose to solve only eight. Exceptions are the 2nd year of high school, where the student needs to solve nine questions of 10, and the 3rd year, where the student must answer all of the proposed questions. This aspect is also considered positive, as it encourages the participant to make decisions. There are no differences in the test questions of the three years of high school, only the number of questions to be solved. With respect to the questions, about 30% are objective ones where the student has five alternatives from which he/she must choose the correct answer (multiple choice questions). The remaining questions are subjective ones (no alternative answers provided). However, the full development, with justification, in all questions is requested. After the test completion, the correction stage occurs, which is made by at least two people, a professor and an extension scholarship holder. In addition to the answer, we observe the solving process of both the subjective and the objective questions, and an improvement in the solution processes presented by participants is highlighted in the solution analysis. In addition to the publication of the first three classifieds, the names of the twelve best placed, by class, are published for a greater incentive to participate 195
in later competitions. At the end of the questions correction, the best answers elaborated by the students are selected for the preparation and publication of the records, in the form of a CD-ROM, with the tests and the respective solutions presented by the students. The awards ceremony is performed, in which the top three placed of each class are distinguished, and the duo with the best performance of each school receives an honorable mention. Also the fact that all students receive a certificate of participation and that the grades of all students are provided to the respective teachers is worth noting. As awards, in addition to medals, students can choose a gift from the following options: games, books, challenges, among others. To finalize the Mathematical Olympiad process, the survey and the analysis of the questions that show higher numbers of hits and errors, is carried out in order to assist in the preparation of future tests. In the next section, we will present some test questions of the 2012 OMU, as well as the strategies used by the students in their solution. ANALYSIS OF SOME STRATEGIES USED In the 2012 OMU, 2,170 students participated, distributed, by grade level, as shown in Table 1. Table 1. Quantity of students per school year of the 2012 OMU (Fount: authors of the article, 2013). Number of students per class Class
Number of students
4th class/5th year of the elementary school
274
5th class/6th year of the elementary school
288
6th class/7th year of the elementary school
344
7th class/8th year of the elementary school
352
8th class/9th year of the elementary school
306
High school
256
High school
184
High school
166
After the awards ceremony, a survey of the number of correct and mistaken questions in each test is carried out, as well as the number the annulled ones, i.e., those not solved by the students. In addition, in 2012, we performed an analysis of the strategies used by the students in each question. In this article, we will present only the analysis of the correct questions. In this way, assuming studies on solution strategies (Musser and Shaughnessy, 1997; Dante, 2000; Dullius et al, 2011), presented in the theoretical framework, we have decided to analyze the answers according to the following 196
strategies: trial and error, tables, drawings, patterns, reverse, reduction to the unit, calculation. We also have included in the survey those questions that present only the answer, without justification. After the quantitative analysis of the number of students who used each one of the above mentioned strategies, we have chosen to present in this article the question of each year of the elementary school that displayed the largest number of different strategies. In the 4th class/5th year of elementary school, the following question obtained the largest number of different strategies at the time of the solution. The following strategies were used: trial and error, drawings, patterns, reverse, calculation and only the answer. In Figure 1, we show the design strategy that was used to obtain the answer. As shown in the following figure, four people can sit at the square table. During the midmorning snack, the students moved seven square tables like that of the figure together to form a long rectangular table. How many people, at the utmost, can sit at the long table, considering that only one person can sit at each table side?
Figure 1. Solution of the question presented by a couple of students (Fount: authors of the article, 2013).
We have observed that the students use the drawing for the solution. The tables were represented by rectangles that were drawn side by side to demonstrate their connection. Each side of the rectangle (which is the presentation of the table side) was numbered to demonstrate where one student can be sitting. Cavalcanti (2001, p. 127) mentions the use of the drawing “as a resource of interpretation of the problem and as a record 197
of the solution strategy”, which may provide the teacher with clues about how the student thought and acted to solve the problem. In the 5th class/6th year, the question shown in Figure 2 obtained the largest number of different strategies. In a bakery, a can of 200 g of chocolate milk powder CHOCOBM cost R$ 3.00, a 400 g can costs R$ 5.00 and one of 800 g costs R$ 9.00. Lara needs 1.2 kg of CHOCOBM to make a huge cake. How many cans and of what type does Lara need to buy to make the most economical purchase of 1.2 Kg of CHOCOBM in this bakery?
Figure 2. Solution of the question by a pair of students (Fount: authors of the article, 2013).
This question was solved correctly by 50% of the students who performed the test, using the following strategies: trial and error, drawings, patterns, calculation, only the answer. Calculation was used by 57% of those who answered correctly. In Figure 2 we show a solution in which the students have used trial-and-error, since various “weight” possibilities were tested and they verified the prices to find out the most economical one. According to Musser and Shaughnessy (1997), the trial-and-error strategy is one of the most-used by students in problem-solving. In this strategy, intuition, imagination, creativity, tips, and experimentation are present at the time of the solution. The student starts the solution with any estimated value and tests the validity, or not, of this value. In the 6th class/7th year, the following question was the one that students most correctly answered and used the following solution strategies: trial-and-error, tables, patterns, reverse, calculation, only the answer. Sofia took some sweets to her grandma: seven mulberry sweets, six chocolate, and three coconut ones. Along the way, the greedy Sofia ate two sweets. Which of the situations below is possible? a) Grandma did not receive chocolate sweets. b) Grandma received fewer coconut sweets than chocolate ones. c) Grandma received the same number of sweets of each of the three varieties. d) There are two varieties of sweets of which grandma received the same quantity. e) The number of mulberry sweets grandma received is larger than that of the sum of the other two.
198
Figure 3. Solution presented by a pair of students of the 6th class/7th year (Fount: authors of the article, 2013).
In Figure 3, we observe that students have analyzed all the alternatives, to see which one might be the correct answer. After several attempts, the students realized that option ‘d’ would be the only one possible. Here follows the question of the 7th class/8th year that showed the highest number of different strategies. A craftsman starts working at 8 o’clock and produces six bracelets every 20 minutes. His helper begins to work an hour later and produces eight bracelets of the same type every half hour. The craftsman stops working at 12 o’clock, and tells his helper to continue working until he reaches his own production. At what time will the helper stop?
Figure 4. Solution of a couple of 7th class/8th year students (Fount: authors of the article, 2013).
The students have solved the problem creating a table that enables an organization proper with relation to the question. Thus, they put the time period with the corresponding number of bracelets produced by the craftsman and by the helper. Finally, they determined, by this prepared organization, the time at which the helper could stop producing bracelets. In relation to the test of the 8th class/9th year, the question that follows had the largest number of different strategies, the most used being calculation. In a test, the first six questions were of true/false type, in which the candidate should choose between right or wrong for his/her reply. In the other four questions, the candidate should choose the correct one among three alternatives. How many sequences of answers are possible in solving the test? a) (6x2)²
b) (6.2) + (4x3)
c) 62. 43
d) 10 (2+3)
e) 26 . 34 199
Figure 5. Solution of a couple of 8th class/9th year students (Fount: authors of the article, 2013).
Cavalcanti (2001, p. 143) points out “the use of the conventional algorithm as one more solution opportunity”. In this question, most students used calculation to solve it, as exemplified in Figure 5. However, it is necessary to note that the students have justified the reason for using calculation for this solution. According to the PCNs (Brasil, 1998) the solution of a problem implies understanding of what has been proposed and presenting the answers by applying appropriate procedures that enable the use of multiple paths to reach the same result. This can be observed in the performed analysis, when we realize that the students have used various solution strategies. However, the strategy most used by students in the analyzed questions was calculation. This result is in accord with the one found in Dullius et al. (2011, p. 10), studying the test held by high school students in the 11 th OMU. This was noted in strategies created by the students themselves, in the use of tables presenting organizations that showed proper organizations in different designs and in trial-anderror examples demonstrated in the solutions. We emphasize that students, even if they often used the knowledge and methods acquired in the classroom, such as calculations and formulas, also showed signs of creativity. Thus, we can infer that students, when challenged, end up creating their own strategies for problem solving, as reported in the response shown in Figure 6, the proof of the 8th class/9th year previously mentioned. The preparation of a table in solving problems like this is not something typical for students, nor for teachers, which illustrates a creative and organized way of logical thinking.
200
Figure 6. Solution of a couple of 8th class/9th year students (Fount: authors of the article, 2013).
In learning mathematics, the problems ultimately become fundamental, since they can allow the student to face questioning and thinking for him/herself, enabling the exercise of logical reasoning and not just the use of standardized rules, as Amado and Carreira (2012, p. 15) point out well. Solving mathematical problems requires more than knowledge of procedures and techniques, it requires the ability to motivate the student and put him/her into action, to think of strategies that, at the beginning, are not pre-established, and to make full use of various ways of communicating the reasoning and solution process. In the end, it implies the mobilization and development of a variety of skills to reach an end. The individual does not have, in advance, any algorithm or procedure already constructed that assures the correct solution.
Thus, we believe, according to Gontijo (2006), that a problem, no matter how simple it may be, can arouse interest in mathematical activity if it provides the student a liking for the discovery of a solution, stimulating curiosity, creativity and the improvement of reasoning, as well as extending mathematical knowledge. SOME CONSIDERATIONS Since the first Univates Mathematics Olympiad editions, we have observed an increase in the number of participants, as well as the involvement of the teacher and his/her students, both in the period of the Olympiad and in its preparation. Most participants opt to take the exam in pairs, because it provides greater security. During the test, we have observed the discussions of the pairs, engaging each other for a good performance in competition. In addition, the use of the calculator, for the solution of the questions, has been considered a positive aspect, both by teachers and by the students. In relation to the solutions, we have observed that students opt to solve the questions using formulas and calculations presented in the classroom, when they could have solved them by trial-and-error, drawings, diagram, or by another strategy. According 201
to Dante (2000), the teacher should offer the students the possibility to use several strategies, showing them that there is no single optimal strategy for a solution. For the author, it would be interesting to solve different problems with the same strategy as well as apply different strategies to solve the same problem. In this sense, the teaching of mathematics enables the exercise of logical reasoning, as well as the development of creativity, as Romanatto (2012, p. 11) points out. Mathematics needs to be presented to the student as a knowledge which favors the development and improvement of his/her reasoning, expressive capacity, sensitivity, and imagination. Therefore, the process of teaching and learning mathematics needs to transform itself, from a mere technical training, to an instrument to model and interpret reality in its most diverse contexts. That means training for creativity, criticality, and citizenship, and not only for memorization, alienation and exclusion.
We point out that the various OMU editions provide rich material that allows analysis of the most critical content for the students in terms of learning mathematics. We have also realized that in the course of the OMU editions the students “feel” the natural pleasure for competitions, since the number of participants is significant. We hope with this event to educate students that good results are achieved with effort, dedication and creativity. REFERENCES Amado, N. & Carreira, S. (2012). Um olhar sobre uma competição matemática na Web – a resolução de problemas para além da sala de aula. In Revista Educação e Matemática, p. 13-18, set-out. Bragança, B. (2013). Olimpíada de Matemática para a Matemática avançar. Dissertação (Mestrado). Universidade Federal de Viçosa. Viçosa, MG. Brasil, Secretária de Educação Fundamental. (1998). Parâmetros Curriculares Nacionais: Matemática. Brasília: MEC/SEF. Cavalcanti, C. (2001). Diferentes formas de resolver problemas. In: Smole, K. S. & Diniz, M. I. (Orgs.). Ler, escrever e resolver problemas: Habilidades básicas para aprender matemática. , pp. 121 – 149. Porto Alegre: Artmed. Dante, L. (2000). Didática da resolução de problemas de matemática: 1ª a 5ª class. 12. São Paulo: Ática. Dullius, M. M. [et al]. (2011). Estrategias utilizadas en la resolución de problemas matemáticos. Revista chilena de educación científica, v. 10, n. 1, p. 23-32. Gontigo, C.H. (2006). Resolução e Formulação de Problemas: caminhos para o desenvolvimento da criatividade em Matemática. In Anais do SIPEMAT. Recife, Programa de Pós-Graduação em Educação-Centro de Educação – Universidade Federal de Pernambuco. Krulik, S. & Reys, R. E. (1997). A resolução de problemas na matemática escolar. São Paulo: Atual. 202
Musser, G. L. & Shaughnessy, J. M. (1997). Estratégias de resolução de problemas na matemática escolar. In S. Krulik, & R. E. Reys, (Eds). A resolução de problemas na matemática escolar. São Paulo: Atual. Romanatto, M. C. (2012). Resolução de problemas nas aulas de Matemática. Revista Eletrônica de Educação, 6(1), pp. 299-311. Retrieved from: http://www.reveduc. ufscar.br.
203
WRITING PROBLEM STORIES: DEVELOPING CREATIVITY THROUGH THE INTEGRATION OF MATHEMATICS AND LANGUAGE Fátima Sardinha, Pedro Palhares, Fernando Azevedo CIEC, Institute of Education, University of Minho
[email protected] Writing problem stories is a teaching methodology whose main objectives are: allowing children to pose problems and to write stories and therefore to integrate the two main subject areas of the curriculum, language and mathematics. With it we intended to promote the development of creative writing, textual understanding, problem solving, problem posing and reflective and creative thinking. The non-routine problems were used in order to maximize varied and creative strategies of solving problems, allowing students to apply their knowledge in posing problems activities. PROBLEM STORIES Our study intended, in a first stage, to promote, and in a second stage, to assess the development of literacy and numeracy skills using a problems stories teaching strategy, with students primary school. Our study first was implemented in small scale by Sardinha (2005). The relevance of this study lies in the education for numeracy and literacy, as well as in a change of attitude towards mathematic and language through problem stories. Their creation implies reading, writing and posing and solving problem skills in specific context. We pretended to analyze and reflect on the consequences of implementing this method as a way of educating for numeracy and literacy, longitudinally, articulating transversely mathematics and language. We intended to perceive the skills that this teaching method may develop in students and how this affects their long term achievement in both areas. The construction of stories with problems (problem stories) was an activity promoted by Bush and Fiala (1993) as a new way to have students posing problems. That was done both with 5th grade students and teacher trainees. They thought that the construction of problem stories would develop creative writing and integrate mathematics with other areas, and could be done with students of every school year. Palhares (1997) has implemented and analysed problem stories made by teacher trainees. He stipulated groups of 2-3 and that stories should have exactly four problems coherent with the story and should be intended to 8th grade students. He mentions three structure factors in the construction: the general idea for the story, the development of the story and the problems, any of which may assume the most relevant part.
204 Carreira, S., Amado, N., Jones, K., & Jacinto, H. (Eds.) (2014). Proceedings of the Problem@Web International Conference: Technology, creativity and affect in mathematical problem solving. Faro, Portugal: Universidade do Algarve.
Apparently there are four different and main processes of construction. One is to start with only one problem, from which the general idea of a story unfolds and during its development opportunities to include other problems may arise. A second is to start with a set of problems, from which a general idea emerges and a later adaptation of the problems occurs. Third, we start with the idea for a story and opportunities for the introduction of problems arise which may originate changes in the development of the story. Finally, there is the possibility of constructing a story and when it is finished, formulate problems coherent with it and place them strategically. He believes that the first two favour problem posing and the last two are more favourable to the construction of stories. Sardinha (2005) has implemented the creation of stories in a 3rd year of schooling class. She created tasks not only for problem posing and solving, but also for the understanding of texts and to develop writing. She concluded that problem stories permitted the understanding of the importance of the strategic management of information in a text, considering the perlocutive effects to be attained; developed the domain of the basic moments in stories structuring; and developed several other competencies connected both with the domain of Portuguese language and with problem posing and solving. She mentions that problem stories have promoted and facilitated the use of problem solving strategies by facilitating the creation of mental images of the problem settings, together with better metacognitive actions. Sardinha (2011) has implemented again the tasks to a new group of students of the 2 nd year of schooling and continued working with them through their 3rd year of schooling. The set of tasks was remade from 2005, with a new non-routine problem and a new story rewriting activity. In 2012, we have set up a teacher in-service training focusing on this methodology in which fourteen teachers have participated. We intended teachers to create their own tasks, starting from the sequence of tasks by Sardinha (2011), and then applied it to their students. For the first time this methodology was applied to three 1 st year of schooling classes. Integration Pat Hagerty, cited by Evans, Leija and Falkner (2001), recommends disciplinary integration as a means to help teachers deal with the lack of time to work all curricular content in the classroom they feel. Considering that literacy is one of the first to be evaluated, he proposes the integration of all possible areas to work around literacy. Azevedo (2009) refers that educating to literacy involves creating interaction opportunities with literacy materials that are both significant and relevant. In our specific case, when trying to interact between literacy and numeracy through the creation of problem stories, we believe that problem solving and posing are strongly connected with the linguistic domain and therefore it makes all sense to integrate these two basic areas for a global development of the students. 205
Even if some may say that integration is just fashionable, we think that in the pedagogic domain it is still ill represented. And our methodology intends to achieve an effective integration between Language and Mathematics with the students being an active part in the construction of tasks and of their own knowledge. Creativity Van Harpen and Sriraman (2013) refer that creativity is seen has a major component of education and a buzzword of the twenty-first century. Research on creativity specifically in mathematics is sparse, according to Leikin et al. (2010). Mann (2006) points to the lack of a consistent definition of creativity. To Guilford (1967) the creative process is based on the combination of convergent thinking, that involves aiming for a single, correct solution to a problem, and divergent thinking, that involves generation of multiple answers to a problem or phenomenon. An operative definition of creativity based on four related components is suggested by Torrance (1974): fluency, flexibility, novelty, and elaboration. Fluency is the continuity of ideas, flow of associations, and use of basic and universal knowledge. Flexibility is associated with changing ideas, approaching a problem in various ways, and producing a variety of solutions. Originality is characterized by a unique way of thinking and unique products of mental or artistic activity. Elaboration refers to the ability to describe, illuminate, and generalize ideas. As creativity is usually viewed as a process that leads to generation of original ideas, the originality component is commonly acknowledged as the main component of creativity. Cropley (2006) shows another view of the combination of convergent and divergent thinking. For this author, creative thinking involves two main components: “generation of novelty (via divergent thinking) and evaluation of the novelty (via convergent thinking)” (p. 391). At the same time, convergent thinking knowledge is of particular importance as a source of ideas, pathways to solutions, and criteria of effectiveness and novelty. Problems, problem posing and creativity Kantowsky (1977) points to the difficulty in defining problem, since what is a problem for some may be an exercise for others or even a known fact for yet others. In the same direction goes Schoenfeld (1985) who stresses the relativity of the notion. Mayer (1992) considers that we face a problem when we have an objective but we do not have immediate access to the solution, because we are facing an obstacle. Mayer (2002) adds to it that mathematical problem solving is the problem solving when a mathematical content is present, explicitly or implicitly. This definition by Mayer is compatible with Polya (1965), for whom solving a problem is to find a path out of a difficulty, a way to contour an obstacle, to pursue an objective that is not immediately achievable.
206
Vale e Pimentel (2004) point the difficulty in defining what is a problem. They also refer that many terms have lately appeared, to some authors they are synonyms of problem and for others aren't. The word “problem” can mean a task or a project, an activity or an investigation. In our case, the word “problem” assumes an open character in which students can use a wide range of solving processes and where they investigate to reach the solution. The authors refer to the international recommendations that value the complex mathematical processes and students creativity, stressing that non-routine activity converge in this way. According to this, they consider crucial the selection of exploratory and investigative problems that allow challenges to all students, so that they can formulate hypotheses, verify conjectures and promote debate in the resolution. We finally used Palhares (1997) definition of problem: a problem is constituted by information on an initial situation and on the final situation that is required, or on the transformation that is required; there is an obstacle for a certain class of individuals that implies the use of some kind of reasoning to get a solution by their own means (or one solution, or the certainty that there is no solution); the class of individuals for whom there is an obstacle have to apply one or more strategies; there can be no indication on which strategy to use. We agree with the definition of problem posing by Gonldenberg and Walter (2003) in which they refer that it is simultaneously a tool to teach mathematics through problem solving and a part of the learning. They say that for students the process of posing their own problems helps develop the ability to solve problems and to understand the implicit mathematical ideas. For Mann (2006) solutions to real problems also entail problem finding, as well as problem solving. Kilpatrick (1987) described problem posing as a neglected but essential means of mathematical instruction. The author emphasize that students need the opportunity to design and answer their own problems. Krulik and Rudnick (1993) corroborate the essence of problem stories, because students gain experience in creating their own problems and these become increasingly sophisticated. They defend that problem solving and reasoning should go beyond what appears in textbooks. To develop students into thinking subjects, we should confront them with situations that require resourcefulness, creativity and imagination. Jay and Perkins (1997) state that “the act of finding and formulating a problem is a key aspect of creative thinking and creative performance in many fields, an act that is distinct from and perhaps more important than problem solving” (p. 257). Ervynck (1991) identified three different levels of creativity: first - contains an algorithmic solution to a problem; second - involves modeling a situation and may include solving a word problem with a graph or a linear diagram; third - employs sophisticated methods usually based on assumptions embedded in the problem, and makes use of the problem’s internal structure and insight. Since categorisation of types of solutions according to the levels of creativity suggested by the author is based on the connection between the solutions and solver's previous mathematical experiences,
207
this categorization fits the definition of relative creativity, in general, and of originality, in particular. Leung and Silver (1997) claim that both problem solving and problem posing are important aspects of mathematical creativity. However, Van Harpen and Sriraman (2013) consider that problem posing is also the least understood and most overlooked part of mathematical creativity, as there aren’t many studies that have investigated the relationship between mathematical creativity, in the form of problem posing, and mathematical achievement, ability and/or knowledge. METHODOLOGY APPLIED After Sardinha (2005), we have created a specific methodology, divided in two moments, and these moments divided in three phases, and in each phase pursuing different goals for both areas, always respecting the interdisciplinary approach. In the first year, we chose a group of five 7-years old students on their 2nd year of school (group A). In the second year, we analyzed four elements of the group A, in their 3 rd year of school, and also another group (group B), a four students group of 8-years old average in their 3rd year of school, experiencing this method for the first time. Introducing a new group, we intended to compare the results of their work, in the field of posing and solving problems and in the creativity of the problem stories and their proficiency in the use of the language. Group A had contact with problems stories in the first year of the study and group B never experienced them before. The elements of the groups were chosen according to the will of the students in participate in the study and according to the will of their parents since we did the activities in extracurricular time. Data was collected in a natural context and we did a direct and participative observation. We used video recordings, analyzed the contents of their stories and the way they solved and posed problems and we also did interviews. In the initial phase, in three sessions, we worked with non-routine problems, the expansion of problems statements and also the macro-textual analysis of stories. The first activity proposed was the problem story “Raspel the misfortunate” constructed around the well known problem of the wolf, goat and cabbage. It was a story about a gnome, with a lot of bad luck, who needed to find the wish-tree to end his misfortune. In his adventure he was always with a goat, a cabbage and a wolf. At some point of the voyage he came across a river and a problem arose, how could he cross the river to get to the tree if he only had a boat with two places? Apart from this, if they were left alone, the goat would eat the cabbage and the wolf would eat the goat. How many trips must he do to cross to the other side? In the second and third activities we posed the problems: “Riddle of St. Mathias” (When I was going to St. Mathias I met a boy with seven aunts. Each aunt had seven bags and each bag had seven cats and each cat had seven kittens. Kittens, cats, bags and aunts how many of them were going to St. Mathias?); “The Squirrel” (A box has nine cabbage eyes. The squirrel leaves with 208
three eyes per day, however he takes nine days to transport all the cabbage eyes. How do you explain this fact?); “Sebastian the Crab” (Sebastian the crab decided to go to the beach. He was in the sea, twenty meters off the beach. Each day, he walks four meters towards the beach. But at night, while he rests, the tide throws him back two meters. How many days will it take him to get to the beach?). We asked them to create a story including the problems we used. In the development phase, in two sessions, we created a version of the Snow White Story, in which she is a participant narrator. In this phase, from the traditional story, pupils had to pose coherent problems with it. In the final phase, in two sessions, students had to create a story and formulate coherent problems with the story. This methodology was used with group A.
Figure 1. Scheme of the method used with the 2nd year of schooling students.
In the second moment, second year of the study, we introduced a few changes. Group B started its participation in this study without the contact with problem stories that group A experienced. We posed new problems: “Indians paths” (The chiefs of the 209
Indian tribes of Sioux, Oglala, Comanche, Apache, Mescaleros and Navajos gathered for a big Pow-Wow (it’s how the Indians call their meetings). In the top of the hill, they put their tents making a circle. Each tent had a path to the others. How many paths were there?), “Jealous boyfriends” (Two couples of jealous boyfriends, John and Joana, Antony and Antonia, wanted to cross a river where there was a little boat. This boat took only two persons. The problem was that the boys were so jealous that they would not leave their girlfriends with the other boy, even if the others girlfriend was there. How could they do to cross the river?), and “The thinker” (André thought of a number. Then he multiplied it by two. After that he subtracted five. The result was thirteen. Which number was it?). Later we asked again for the creation of a story including problems used. In the development phase, in two sessions, students had to create their own story and formulate coherent problems with the story, like group A had already made in the first moment. In the final phase, two sessions, we asked both groups to rewrite the story, students should reflect about their work for improvement, correcting and enrichment of the problem story. So, group A just had to apply their knowledge and strategies acquired in the first year and group B had to perform the same work without any previous contact with problem stories. We intended to identify possible qualitative differences in their work in the problem posing and in the creation of problem stories.
Figure 2. Scheme of the method in the second moment
ANALYSIS OF THE PROBLEM POSING The first problem the students had to formulate was about the distance White Snow had to walk from the castle to the dwarfs’ house. Students revealed difficulties expressing their ideas, so the teacher had to help them. Teacher: So we can write a problem on measurement, using what? Bernard: Kilometres. Teacher: Didn’t you solve a similar problem? Bernard: Yes, we did, the turtle, how many hours did she get to arrive.
210
During the formulation of the problem, students chose re-contextualization of a previous problem, yet revealed difficulties in justifying why Snow White backed off in the course from her father to the dwarfs’ house. Bernard: She was a sleepwalker, she missed her daddy and slipped just a little and then perhaps it’s better to think it better… Students: Left my father’s house… Anthony: That was twenty kilometres from this one. Every day I walked 4 Km. and ay night? Bernard:
How was it? She missed her father, she was sleepwalker…
Four elements of the group drew a line with 20cm representing the 20 Km and signalled in one side what she was walking during daytime and in the other what slipped back at night and then counting. The fifth element observed that she only walked three km per day The fifth element, observing that White Snow only made 3 km per day, added successively until reached 21, and then counted how many additions were. Students have shown difficulties in identifying opportunities to create problems as well as in reasoning mathematically, and the formulation allowed for the students to reflect on aspects of real life, like time to travel in bus and so on. Bernard: Kilometres! Anthony: Kilometres! Teacher: And how many km did they travel per hour? Bernard: Per hour? Teacher: You have to say it otherwise how can we know? Bernard: Five! Ann:
Five!
Bernard: It is to get there quickly. Teacher: Usually how many km per hour? Several:
Hundred!?
Bernard: Yes it is one hundred, yes.
Then students formulated a problem on this basis. Teacher: How much did they travel per hour? Daniel :
One hundred km.
Teacher: Every hour they travelled 100km. and what do we want to know? Anthony: How many km did they…
211
Teacher: “on a certain day the four friends went on a school study trip to the Lisbon Zoo, they left school at eight fifteen and arrived there at eleven, they travelled 100km every hour how many km did they have to travel to… Anthony: …to get there. Teacher:
…to get there.
When solving the problem formulated, students showed many difficulties measuring the duration of the trip, and in general working with time measurements. The worst bit was working with the quarter of an hour and the distance travelled in that period of time. To illustrate the work done, we transcribed the problem story analysed and the resolution of the problems posed by the pupils that shows how they have to be creative in the process of solving their own problems. Problem story: An adventure in the Zoo Once upon a time there were four friend called Daniel, Anthony, Bernard and Ann. They all studied in the same school and Anthony and Bernard were cousins. They got themselves in lots of troubles mainly because they were very curious. One day, the four friends went in a school trip to the Lisbon Zoo. They left school at 8h15m and arrive there at eleven. Each hour they travelled one hundred kilometres. How many kilometres they made to arrive to their final destination? (1) Upon arrival, they went to see the cages that sheltered the wild animals; they saw elephants, lions, tigers, monkeys, giraffes and many more. In the end of the tour the four friends made a picnic with their classmates, when they saw two men loading animals in to a truck. Each man carried a cage with four baby monkeys and each one made seven trips. (2) The four friends decide to investigate, first they went to the guide that lead them on the trip and asked him: - Mister Manuel, do you know that men that were carrying the baby monkeys? - Yes, I know them, they are the animal handlers! Daniel, Anthony, Bernard and Ann didn't believe the guide and decided to spy him and the other men. They went to the back of the truck and saw the guide talking with the other two men. - Look out, there is a bunch of kids suspecting of us. - Let's get out of here the faster we can. - Said one of the men. They left behind the truck, before any of the three men saw them. Then they joined their class. Meanwhile, Bernard called the police station and told them what happened.
212
Fifteen minutes later, the police arrived in three cars and in each car there were three policemen that arrested the three men. - In how many ways can the policemen carry the bandits? (3) Their classmates started thinking in the problem, meanwhile, the teacher call them to get back to the bus. And this way ended another adventure of these four friends. Sardinha (2011), Group A, 2nd year of primary school
Resolution of the 1st problem posed In the resolution of this problem, students have shown difficulties in calculating the distance of the trip due to the fact that it started at a quarter past eight and not at an exact hour. They also showed difficulties in relating one hour with half an hour and quarter of an hour. The teacher had to ask them to draw a watch so that they could represent and count the minutes. This strategy helped them to overcome their first difficulties. And they were able to calculate that they travelled for two hours and forty five minutes. But then they had to calculate how many kilometers they travelled, easily they realized that if in one hour they travelled one hundred kilometers, in two hours they would travel two hundred kilometers. In this moment a new problem arose since they experienced difficulties calculating the kilometers travelled in forty-five minutes. Once again, the watch was fundamental in this task, the teacher explored the division of the unit in equal parts and the representation of these quantities in the drawing. The goal was that students identified the concept of half, third part and quarter part and made connections between the kilometers travelled in an hour, half an hour and a quarter of an hour, so that they could finally reach the forty five minutes. The students easily calculated the distance travelled in a half an hour but showed a lot of difficulties finding the distance travelled in a quarter of an hour. Only one student solved the problem without showing too many difficulties, while the others needed the help of the teacher to understand the reasoning in order to reach the solution. As they do this, they also get more creative in the way they solve their own posed problems because, most of times, they don't have mathematical formal knowledge to solve what they pose. So, they have to apply their informal and formal mathematical knowledge in a creative way, during the process of verification, solving the problem they posed, to get to the solution allowing them to verify if the problem is correctly posed. IMPLICATIONS OF THE WORK ON DIFFERENT COMMUNITIES The work developed during these years has progressively permitted more knowledge and it peaked with the teacher training course and the creation of stories in the teachers’ fourteen classes. It is interesting and important to stress that students were creating stories with problems that were intended to other students, which was part of the motivation. 213
During the construction of the problem stories, students have created tasks and tested them. They had to verify if the problems formulated had to be re-structured, so they had to solve them and use metacognitive strategies to recognize errors committed, and trying to overcome those errors. All the work was previously developed in a research setting but in the teacher training phase the task creation was performed in a more realistic setting. Students have shown real interest with the problem posing and solving, establishing an ownership relation with the work produced. We tried to convince teachers of the students’ ability to develop significant mathematical tasks, sometimes with a degree of difficulty superior to the textbooks. At the same time, students developed their mathematical communication skills when presenting their work, the errors committed and the strategies used to overcome difficulties. CONCLUSIONS The set of tasks assembled by us, which constitutes the core of the methodology presented, permits that each teacher may create his or her tasks as long as some basic aspects are respected, concerning the type of tasks and the type of text created to involve the problem. At first students must contact with a story with a non-routine problem that may enlarge their encyclopaedic competency and their creativity. The teacher must be participant at the beginning, retreating to a more supervision role with time. Problem stories permit students to, after experiencing the tasks proposed in the implementation of this methodology, create their own mathematical tasks. In the process, students develop literacy and numeracy competencies, metacognitive strategies, creativity and friendly relations with these two important areas of the curriculum. The fact that students have a very active role induces extra motivation and implies some reflection on their own learning. Sharing their problem stories with peers either from the class or the school invites to more sophistication and accrued difficulty on their subsequent creations. They resort to their literacy competences to try to mislead future solvers as a way to make problems more difficult. From the adaptation of traditional stories, in which students vocabulary is enriched with teacher’s help, students use their inter-textual reference frameworks not only to interpret texts but also to formulate problems. Students should formulate problems coherent with the story plot, and initially they probably use the recontextualization of problems solved previously but progressively they will tend to develop autonomy and will formulate their own problems. At the end, the opportunity to create problem stories allows them to create their own mathematical tasks, mobilizing the knowledge and competencies acquired in the process enhancing their creativity. REFERENCES Azevedo, F. (2009). Literacias: contextos e práticas [Literacies: contexts and practices]. In F. Azevedo, & M. G. Sardinha, Modelos e práticas em literacia [Models and practices in literacy] (pp.1-16). Lisboa: Lidel. 214
Bush, W. S., & Fiala, A. (1993). Problem stories - A new twist on problem posing. In S. I. Brown e M. Walter, Problem Posing - Reflections and Applications (pp.167173). New Jersey: Lawrence Erlbaum Associates. Cropley, A. (2006). In Praise of Convergent Thinking. Creativity Research Journal, 18(3), 391–404. Ervynck, G. (1991). Mathematical creativity. In D. Tall (Ed.), Advanced mathematical thinking (pp. 42–53). Dordrecht, Netherlands: Kluwer. Evans, C. W., Leija, A. J., & Falkner, T. R. (2001). Math Links – Teaching the NCTM 2000 standards through children’s literature. Colorado: Teacher Ideas Press. Goldenberg, E. P., & Walter, M. I. (2003). Problem posing as a tool for teaching mathematics. In H. L. Schoen (Ed.), Teaching mathematics through problem solving: Grades 6 – 12 (pp.69-84). Reston, VA: National Council of Teachers of Mathematics. Guilford, J. P. (1967). The nature of human intelligence. McGraw-Hill: New York. Jay, E. S., & Perkins, D. N. (1997). Problem finding: The search for mechanism. In M. A. Runco (Ed.), The creativity research handbook (Vol. 1, pp. 257–293). Cresskill, NJ: Hampton Press. Kantowsky, M. G. (1977). Processes involved in mathematical problem solving. Journal for Research in Mathematics Education, 8, 163-180. Kilpatrick, J. (1987). Problem formulating: Where do good problems come from? In A. H. Schoenfeld (Ed.), Cognitive science and mathematics education (pp. 123– 148). Mahwah, NJ: Lawrence Erlbaum. Krulik, S., & Rudnick, J. (1993). Reasoning and problem solving - a handbook for elementary school teachers. Massachusetts: Allyn and Bacon. Leikin, R., Berman, A., & Koichu, B. (2010). Creativity in mathematics and the education of gifted students. Rotterdam: Sense Publishers. Leung, S., & Silver, E. (1997). The role of task format, mathematics knowledge,and creativethinking on the arithmetic problem posing of propspective elementary school teachers. Mathematics Education Research Journal, 9(1), 5-24. Love, E., & Mason, J. (1992). Teaching mathematics: action and awareness. Southampton: Open University. Mann, E. L. (2006). Creativity: The essence of mathematics. Journal for the Education of the Gifted, 30, 236–262. Mayer, R. E. (1992). Thinking, problem solving, cognition. New York: Cambridge University. Mayer, R. E. (2002). Mathematical Problem Solving. In Royer, J.M. (Ed.) Mathematical Cognition (pp.69-92). Connecticut: Age Publishing. 215
Palhares, P. (1997). Histórias com problemas construídas por futuros professores de matemática [Stories with problems constructed by future mathematics teachers]. In D. Fernandes, F. Lester, A. Borralho, & I. Vale, Resolução de problemas na formação inicial de professores de matemática - múltiplos contextos e perspectivas [Problem solving in the initial formation of mathematics teachers – multiple contexts and perspectives] (pp.159-188). Aveiro: GIRP. Polya, G. (1965). Mathematical discovery, Volume II: On understanding, learning and teaching problem solving. New York: Wiley. Sardinha, M. F. (2005). Histórias com Problemas – Uma Forma de Educar para a Numeracia e para a Literacia [Stories with problems – a way to educate for numeracy and literacy]. Tese de mestrado em Estudos da Criança – Área de Especialização em Ensino e Aprendizagem da Matemática, Braga: Universidade do Minho. Sardinha, F. (2011). Histórias com Problemas e a sua ligação à promoção da numeracia e da literacia no 1.º Ciclo do Ensino Básico [Stories with problems and their connection to numeracy and literacy in the 1st cycle of Basic Teaching]. Tese de doutoramento em Estudos da Criança – Especialidade de matemática elementar, Braga: Universidade do Minho. Torrance, E. P. (1974). Torrance tests of creative thinking. Bensenville, IL: Scholastic Testing Service. Vale, I. e Pimentel, T. (2004). Resolução de Problemas. In P. Palhares (Org.), Elementos de Matemática para professores do Ensino Básico (pp. 7-52). Lisboa: Lidel. Van Harpen, X. Y., & Sriraman, B. (2013). Creativity and mathematical problem posing: An analysis of high school students’ mathematical problem posing in China and the USA. Educational Studies in Mathematics, 82(2), 201–221.
216
REVEALING THE INNER CONNECTIONS OF MATH USING A CLOCK PUZZLE Sabine Stöcker-Segre Davidson Institute of Science Education
[email protected] Teaching the inner context of math is important when teaching problem solving strategies and mathematical thinking rather than rules. Moreover, puzzles are by their nature very often more interesting than school book problems. We show a puzzle that was published on a free-access educational internet-site and several ways of solving it, all of them except for one submitted by users. Though the internet-site is not competitive in the sense of promising a prize, there is “moral” competition for submitting either the first or the better (i.e. more elegant) solution. The example given here can be solved with strategies coming from different fields of mathematics and can be used for showing that one should not look at the various mathematical disciplines as separated from each other, but as contributing to each other. INTRODUCTION It is well known that mathematical thinking can be trained with puzzles (Ervynck, 1991). Riddle forums, in particular, connect and enable fruitful discussions between individuals having very different educational background, which is a goal by itself (Usisking, 1994). Efforts should be made to teach mathematical thinking at schools rather than “recipes” to solve problems (Davis, 1988). In many countries this goal entered the program of math teaching as defined by the ministry of education. Room needs to be given to the various ideas of students, who will try to solve problems with very different techniques (Robinson, 1997). As a consequence, mathematical subjects cannot be treated as separated from each other, but as being interconnected and nourishing each other (Barabash, 2012). A successful teacher will not discard ideas, but fix them (if necessary) and show how they are connected to other ways of solution (Burton, 2004). In this paper we will present a mathematical puzzle which was presented on an internet site and solved in four different ways: algebraically, graphically, exploring symmetries and with infinite series. In the last section we will relate to the role of the forum manager and the importance of showing connections between the various ways of solution. THEORETICAL BACKGROUND Studies stress that the knowledge of mathematics is formed by representations (such as symbols, objects and pictures) which become interlinked with the progress of understanding (Hiebert & Carpenter, 1992). Solving mathematical problems triggers this formation of necessary links between representations, and thus contributes to the process of understanding (Freiman, Vézina, & Gandaho, 2005). Carreira, S., Amado, N., Jones, K., & Jacinto, H. (Eds.) (2014). Proceedings of the Problem@Web International Conference: Technology, creativity and affect in mathematical problem solving. Faro, Portugal: Universidade do Algarve.
217
Depending on the techniques required to solve a particular problem, some mathematical problems are particularly suitable to create connections between representations. The following riddle is an example of a problem that fits to reveal connections between various mathematical fields. Solving it contributes to mathematical understanding as it reveals how various mathematical disciplines complete each other. THE PUZZLE The following puzzle was first presented in Hebrew on the “math circle”, a free-access educational internet site and rubric of “Davidson online”. Later the English translation was published, too. We refer here and in the following to the users’ messages and replies in Hebrew. In its English translation the puzzle reads as follows (The Davidson Institute of Science Education affiliated to the Weizmann Institute of Science, 2012): Usually, the long hand on the clock indicates the minutes and the short hand indicates the hours. If the minute hand did not exist, we would still be able to tell the time, because the hour hand moves continuously between the whole hours. For instance: at six thirty, the hour hand will be precisely between 6 and 7. What will happen if we swap the long hand with the short hand? In most cases the situation will be meaningless. For instance: when swapping the minute hand with the hour hand at 6:00, the minutes hand will point to 6 (meaning 30 minutes have lapsed from the whole hour) while the hour hand will point to 12 (a whole hour) – a situation which is not possible. However, at 1:46 (approximately) the two hands can be interchanged – the “new” time will be 9:09 (see figure 1). How many positions are there on the clock that allow this sort of interchange of the hands? This is not an easy riddle (and it is “homemade”, we don’t think it appears on the internet or in previously printed books). If it is too difficult for you, send us partial solutions and start a discussion.
Together with the text an illustration is shown:
Figure 1. Illustration of the “Hands on the clock” riddle.
218
This puzzle can be solved in many different ways which will be presented in the following section. All except for the graphical solution have been sent by users to the puzzle forum. Many solutions were wrong on the first attempt, but fixing them delivered new insight into the problem. The graphical solution has probably not been submitted due to technical problems. Graphics can only be attached to a forum message, but cannot be displayed directly. We did not ask for exact solutions, only for the number of solutions. This riddle refers to a clock on which the hands move continuously (not jumping). This was clarified in the forum. SOLUTIONS There are 143 solutions: 11 solutions where both hands are in the same position (one on top of the other, like at 12 o’ clock) and 66 pairs of two solutions where the time after the swap is different from the time before the swap (like the example in the second row of figure 1). We’ll call the 11 solutions of overlapping hands “trivial solutions” and the two solutions of “swappable” positions “conjugated pairs”. In figure 1, 1:46 and 9:09 are conjugated pairs. For convenience we describe positions in degrees as the angle between a hand and the 12 o’clock position. Because of the high divisibility of 360 we prefer in the context of the puzzle presented here to measure angles in degrees rather than in radiant. Algebraic Solution We start with the algebraic solution since this solution reveals exact positions of the hands on the clock, not only the number of solutions. We will refer to the terminology of this solution when presenting the other solutions. Let h indicate the hour and m the minutes in the case when the short hand points on the hours. Similarly, h’ indicates the hour and m’ the minutes in the case when the long hand points on the hours (after the swap). 0 ≤ ℎ < 12, 0 ≤ ℎ′ < 12,
ℎ ∈ ℕ, ℎ′ ∈ ℕ,
0 ≤ 𝑚 < 60, 0 ≤ 𝑚′ < 60,
𝑚∈ℝ 𝑚′ ∈ ℝ
For the angles in degrees between the hands and a vertically upward pointing axis (conventionally called the y-axis) the following equations are true (since each hand can be either the hour or minute hand): 30ℎ + 0.5𝑚 = 6𝑚′ 30ℎ′ + 0.5𝑚′ = 6𝑚 Resolving this set of equations with respect to m and m’ yields after some manipulation: 𝑚′ = 60⁄143 (12ℎ + ℎ′ ) 𝑚 = 60⁄143 (12ℎ′ + ℎ) 219
This equation can be solved for all valid combinations of h and h’ (each value an integer number between 0 and 11). The number of solutions is 12*12 – 1, since h=h’=11 yields m’=60 which is not a (new) solution. We required 𝑚′ < 60. We can verify this solution with a spreadsheet, see that in each line, i.e. for each combination of h and h’, the position of m in degrees (6th column) is equal to the position of h’ (7th column), and the position of m’ in degrees (last column) is equal to the position of h (5th column). Thus, we can read the angles of the “swappable” positions in degrees from the table. The solution displayed as an example in figure 1 appears in row 9 (for h=1 and h’=9 ) and is marked in yellow. Obviously, the position of the hour hand h before the swap (5th column) is the same as the position of the minute hand m’ after the swap (last column). The pairs (h,h’) and (h’,h) are conjugated pairs, referring to the same solution before and after the swap. Table 1. A spreadsheet program displaying hours, minutes and angles of swappable positions. h 0 0 0 1 1 1 2 2 2 5 11 11
h' 0 1 2 … 0 1 … 9 … 0 1 2 … 5 ... 10 11
0 5 5/143 10 10/143
0 60/143 120/143
position of h in degrees 0.00 2.52 5.03
60/143 5 5/11
5 5/143 5 5/11
30.21 32.73
2.52 32.73
2.52 32.73
30.21 32.73
45 105/143
8 116/143
52.87
274.41
274.41
52.87
120/143 5 125/143 10 10/11
10 10/143 10 70/143 10 10/11
60.42 62.94 65.45
5.03 35.24 65.45
5.03 35.24 65.45
60.42 62.94 65.45
27 3/11
27 3/11
163.64
163.64
163.64
163.64
54 138/143 60
59 83/143 60
357.48 360.00
329.79 360.00
329.79 360.00
357.48 360.00
m
m'
position of m in degrees 0.00 30.21 60.42
position of h' in degrees 0.00 30.21 60.42
position of m' in degrees 0.00 2.52 5.03
Graphical solution We refer first to a simplified and classical problem: At what hours do the two hands of a clock (indicating hours and minutes) point exactly into the same direction? We can solve this problem graphically: On the y-axis we note angles in degrees from 0o to 360o, on the x-axis time in hours.
220
Figure 2. When do the two hands of a clock point exactly in the same direction? The thick line describes the movement of the hour hand, the thin lines the movement of the minute hand during 12 hours.
The minute hand (12 thin lines in the illustration above) completes 12 circles during 12 hours; the hour hand completes one circle (one thick line only in the graph). At the points of intersections of the thin lines with the thick line both hands point exactly in the same direction. There are 11 points of intersection (not counting 00:00 and 12:00 twice), i.e. 11 times during 12 hours both hands point exactly in the same direction (one being on top of the other). These are the “trivial solutions” of the swappable position puzzle. To find more than the trivial solutions, we note that the hour hand will become the minute hand after the swap. To let the thick line of figure 2 describe the minute instead of the hour hand, we need to change the scale on the x-axis: it will now run from 0 to 60 minutes. Next, we need to draw new lines for the new hour hand. These are the dashed blue lines of figure 3.
Figure 3. When the thick line describes the movement of the minute hand, we need to refer to the blue scale, and the dashed blue lines describe the movement of the hour hand. When the thick line describes the movement of the hour hand, we refer to the black scale, and the thin black lines describe the movement of the minute hand. The points of intersection indicate swappable positions. 221
Figure 3 has two scales – one is relevant when the thick line describes the hour hand, the other one when the thick line describes the minute hand. Given a certain value on the y-axis (the angle between a hand and the 12 o’clock position) we draw a parallel line to the x-axis. Where this line intersects the blue dashed line, the position that we chose on the y-axis is the position of the hour hand, and the hour can be determined by reading the full hour from the blue scale on the y-axis and the minutes from the blue scale on the x-axis (6:30 in the example of figure 4). Where a line parallel to the x-axis intersects thin black lines, the position that we chose on the y-axis is a position of the minute hand, and the hour can be read from the black scale on the x-axis. There are 12 points of intersection and therefore 12 options of reading the time, since the minute hand can determine the minute only, but not the hour.
Figure 4. Given the angle between a hand and the 12 o’clock position (on the y-axis), the hour can be determined by means of the dashed blue lines, when it is the hour hand, and by means of the thin black lines, when it is the minute hand.
Where the thin black lines intersect the dashed blue lines, the position (as indicated in degrees on the y-axis) can be interpreted as the position of the hour hand as well as the position of the minute hand. In either case the thick black describes the movement of the remaining hand throughout sixty minutes or 12 hours, respectively. These positions are therefore swappable. We count 143 points of intersection, not counting the points at 00:00 and 12:00 twice. This graphical solution reveals the number of solutions only, unless we write the equations for the lines referred to above, and look for the points of intersection algebraically.
222
Solution exploring symmetries Obviously, swappable positions are symmetric in a certain way. What is or what are the axes of symmetry? These are the trivial solutions as will follow from the following approach: Divide the circle into 13 sectors, such that one line of division coincides with the 12 o’clock position. Here and in the following we call the 13 radii which divide the circle into 13 sectors “division lines”. Counting the division lines in a clockwise sense, the 12 o’clock position is the 13th division line (see the figure below). Starting at 12 o’clock, at the time the hour hand has moved through X sectors, it is on the Xth division line. At this time, the minute hand has moved through 12𝑋 sectors (since it moves 12 times as fast as the hour hand) and will be on division line number 13 –X: 12𝑋 𝑚𝑜𝑑 13 = (13 − 1)𝑋 𝑚𝑜𝑑 13 = 13 − 𝑋. This position (the hour hand at division line number 𝑋, the minute hand at 13 − 𝑋) is swappable: if the hour hand will be at 𝑋 ′ = 13 − 𝑋, the minute hand will be at 13 − 𝑋 ′ = 𝑋. This division of the circle into 13 equal sized sectors can be repeated 11 times: each time one of the division lines coincides with one of the 11 trivial solutions. That way we receive 11 × 13 = 143 solutions.
Figure 5. Division of the circle into 13 sectors, such that one of the division lines coincides with a trivial solution; this is on the left the 12 o’clock position, and on the right the emphasized line in the 5:27 position. Lines which are at equal distance (to the left and to the right) from the emphasized line indicate swappable positions, i.e. before the switch the minute hand will be in one of these two positions and the hour hand in the other one, and after the switch it will be the other way around. Examples for swappable positions are marked in green.
Swappable positions are at the same distance (counting sectors clockwise and counterclockwise) from the trivial solution division line. In other words – a trivial-solution-
223
division line is the bisector (or axis of symmetry) of the angle formed by swappable positions. The symmetry of solutions can be seen in the graphical approach, too: each conjugated pair of solutions (one member in the upper left of the graph in figure 3, the other member in the lower right) is symmetric to the line through the trivial solutions. To confront the symmetry-approach solution with the algebraic solution, we enumerate the algebraic solutions for (h,h’) with 0 h