Procedural Editing of 3D Building Point Clouds ˙Ilke Demir Purdue University West Lafayette, IN, USA
Daniel G. Aliaga Purdue University West Lafayette, IN, USA
Bedrich Benes Purdue University West Lafayette, IN, USA
[email protected]
[email protected]
[email protected]
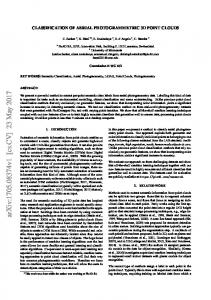
Figure 1: Pipeline. An input point cloud (a) is semi-automatically segmented (b), the segments are used for completion with consensus models (c), and placed in a tree. Then, the tree is parsed and rules are discovered to enable procedural editing (d).
Abstract Thanks to the recent advances in computational photography and remote sensing, point clouds of buildings are becoming increasingly available, yet their processing poses various challenges. In our work, we tackle the problem of point cloud completion and editing and we approach it via inverse procedural modeling. Contrary to the previous work, our approach operates directly on the point cloud without an intermediate triangulation. Our approach consists of 1) semi-automatic segmentation of the input point cloud with segment comparison and template matching to detect repeating structures, 2) a consensus-based voting schema and a pattern extraction algorithm to discover completed terminal geometry and their patterns of usage, all encoded into a context-free grammar, and 3) an interactive editing tool where the user can create new point clouds by using procedural copy and paste operations, and smart resizing. We demonstrate our approach on editing of building models with up to 1.8M points. In our implementation, preprocessing takes up to several minutes and a single editing operation needs from one second to one minute depending on the model size and the operation type.
1. Introduction Recently, there has been a significant increase in the availability of 3D point cloud datasets of buildings and other urban structures. This data can be obtained from different sources such as Li-DAR scans, laser scans, time-of-flight
cameras or reconstruction from photographs. The proliferation has supported widespread GIS services, such as those offered by Google Earth and Microsoft Bing Maps, as well as tools for urban planning and design. Although becoming very common, this data representation often lacks highlevel grouping or segmentation information. This lack hinders (i) directly and intuitively editing such point cloud building models, (ii) creating novel polygonal/point-based models preserving style of the original model, and (iii) obtaining complete building models (e.g., filling-in surfaces that were not fully sampled). Previous work has focused on some of the aforementioned problems. Some methods have centered on segmenting the point cloud into components (e.g., [12, 16, 30]). Others provided 3D polygonal urban reconstructions from point data (e.g., [18, 35]), explored point editing tools (e.g., [3, 22]), or addressed model completion (e.g., [7, 24]). In contrast, our key motivation is to directly inspect the point cloud in order to segment and organize repeating structures into a hierarchical representation and then to enable directly performing a set of “what if” urban design and planning operations. Our method discovers (and organizes) repetition improving both completeness and quality of sampled structures. Further, the improvements are carried forward during editing, hence improving subsequent surface triangulations of novel structures as well as preserving the original structure. Our method discovers structure (Figure 1b), completes the structure (Figure 1c), enables intuitive editing (Figure 1d) and subsequent triangulation (e.g., Figure 3) yielding results superior to direct triangu12147
lations of the original point cloud. Further, the two tower roofs in Figure 1d are a result of style transfer from Figure 5. While one alternative approach is to convert the point cloud into a set of polygons before structure discovery (e.g., Figure 9a), such an approach tends to lose the un-coalesced details of local structures (e.g., details are re-added manually in Figure 9b). The new information added to the model is amplified through editing, resulting in the loss of the integrity of the original geometric details. In contrast, our approach supports a consensus-based reconstruction that can preserve and recover local details for subsequent editing and triangulation. Moreover, we believe our work to be the first procedural editor of structured point clouds. During preprocessing our approach has two main stages (Figure 1a-c). In the segmentation stage, our method semiautomatically partitions the point cloud using RANSACbased plane fitting, Euclidean distance-based clustering, and template matching to create an initial set of segmented structures. At this stage, the granularity of segmentation can be modified interactively by specifying regions to segment more (or less) than a default amount. In the proceduralization stage, our algorithm uses iterative closest point (ICP) and a consensus-based voting scheme to find the completed structure of all repeating segments. All discovered components are placed into a tree data structure (similar to [30]). Then, a pattern discovery algorithm finds the repetitions of the core structures and converts the tree into a parameterized context-free grammar (similar to [26] and [31]). The preprocessed data are then used for interactive editing which enables altering the parsed model using a variety of operations such as smart resizing and copy/paste (Figure 1d). The relative positions and sizes of the discovered components, as well as the sampling density of the original point cloud, are maintained by a linear least squares optimization [23] and edge-aware resampling[13]. The output of editing is a procedural representation of the point cloud, as well as the segmented original and edited point clouds, with optional per-point normal vectors and a triangulation. Note that if the initial model does not include normals, we estimate them using a kd-tree based extrapolation of surface normals as in [28]. We show edited building models with up to 1.8M points (see also the accompanying video), comparisons and robustness experiments. Semi-automatic segmentation takes up to a few minutes and generation of the tree data structure needs less than one minute. The time for individual edit operations varies from one second to one minute depending on model size and operation type. Our main contributions include: • a semi-automatic segmentation of point clouds that is robust to outliers and noise and, with simple user assistance, adapts to a desired segmentation granularity, • a proceduralization method to convert the discovered
segments and their patterns into a grammar-based representation, and to perform a consensus-based completion of the repeating segments, and • a synthesis method that uses the discovered grammar to edit point clouds by means of a custom set of local and global editing operations, least squares optimization, and edge-aware resampling.
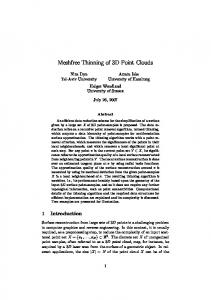
Figure 2: Segmentation. User selects a ROI (a) and the automatic segmentation finds planar and non-planar segments (b). The whole building is segmented after six strokes (c). Template matching finds repeating structures (d).
2. Related Work Our method builds upon previous work in urban reconstruction using grammars, segmentation, and modeling. Some previous works have attempted to extract a grammar-based representation from point cloud data [21]. These methods vary on the targeted content (e.g., facades [1, 4, 26, 27]) or the assumption of predetermined building grammars (e.g., [19, 31]). Instead, we provide a (contextfree) grammar representation for buildings and we do not assume an a priori set of rules or parameters. Also, see the previous work comparison in Supplemental Figure 6. A variety of works has focused on segmenting point clouds and on converting them into a polygonal representation. Gelfand and Guibas [11] define a well-known segmentation strategy that searches for shapes that can “slip” in 1 or 2 dimensions. Toshev et al. [30] segment a building into planar parts and join them using a grammar-like representation that separates roof, rest of building, and non-building structures with less granularity, no editing support and no grammar output. Golovinskiy et al. [12] recognizes key objects in 3D point clouds of urban environments, but does not perform model completion, nor editing. Wu et al. [32] focus on surface reconstruction but do not exploit repetitions, provide a grammar, or enable modeling/changing the input model. Zhou and Neumann [35] create compelling 2.5D urban structures from Li-DAR data. Dimitrov et al. [10], 2148
segments architectural point clouds using region growing and user-assisted surface fitting. Lin et al. [18] use semantic labeling and supervised learning to coarsely segment and reconstruct a specific vocabulary of low-rise residential buildings. In contrast our method is not restricted to particular building structures. Lafarge and Mallet [17] focus on massive reconstruction and not on modeling, synthesis or completion. Pattern and symmetry detection has been used to improve digital geometry processing (see survey by Mitra et al. [20]). For example, Zheng et al. [34] detect large-scale repetitions to complete the models, Demir et al. [9] segments and labels architectural meshes, and Pauly et al. [25] extract various kinds of patterns from a point cloud. However, these approaches do not organize the repetitions into patterns, use the patterns for modeling, or provide pattern granularity selection to the user. Our paper extends these works by detecting the repetitive and hierarchical nature in the underlying buildings, and uses that to provide segmentation, to improve the quality (i.e., completeness) of the reconstructed model, and to enable intuitive model synthesis. The methods for retargeting and editing of existing 3D models focus on meshes [1, 5, 6, 35], CAD models [2], and point clouds [3, 22, 33]. In particular, Andrews et al. [2] work on CAD meshes by allowing users to define editable surfaces and to create new models, with limited support on similarity (i.e., symmetries). Nan et al. [22] edit point cloud data using “smart boxes” that can partially complete interior points and replicate point data, with significant user intervention. Arikan et al. [3] provide a compelling tool to edit polygonised point clouds. Their method also performs segmentation but does not include pattern discovery, completion of non-planar parts, repetition identification, or an explicit hierarchical structure. In contrast to all these point cloud edition and completion solutions, we propose a procedural point cloud editing method that operates without a need for an intermediate geometry, but still maintaining meaningful structures and their relations by a hierarchical representation.
3. Segmentation The first stage of our approach is to segment the model by discovering dominant planes, extracting distance-based clusters, and finding additional repetition within each plane or cluster. We use thresholds defined relative to the model diagonal to detect planarity and clustering. Moreover, the user may interactively select a region of interest and generate additional segmentation. Although the method could be fully automatic, this interaction intuitively supports segmenting different regions of the object at varying levels of detail (i.e., a spatially-varying segmentation granularity), suitable for interactive editing and detecting under-sampled instances (See Section 4.3).
Figure 2 shows an example segmentation. The initial region of the model is chosen by the user (Figure 2a) with a single mouse stroke. The region is then automatically segmented (Figure 2b). This is repeated for five more regions to produce Figure 2c and ultimately Figure 2d. The segmentation granularity is implicitly controlled by the user interaction. Supplemental Figure 1 shows how several levels of segmentation granularity can be achieved.
3.1. Segment Decomposition Given a region of interest, we use a multi-pass partition algorithm to automatically segment the model into a set of planes and (non-planar) clusters. On one hand, planes are quite dominant and easily identified within urban structures. On the other hand common architectural features (e.g., prominent window parts and facade details) are better represented as a cluster of points. Thus, we decompose the model into both types of segments. During each planar segmentation pass, the most dominant planes are found using a RANSAC-based plane-fitting method based on [28]. This method selects a subset of the 3D points {[p1 1], . . . , [pn 1]} and places them as rows into a matrix A. Then, it solves Aq = 0 using SVD where q is a multi-dimensional feature vector with plane features. We repeat this for all remaining points and choose the fitting plane that maximizes the number of inliers within a distance threshold of 2.5% (i.e., similar to [28]). All points near the chosen plane are coalesced into one planar segment Pi and removed from processing queue. The process is executed until no sample set remains, altogether resulting in planar segments {P1 , . . . , PNp }. When the planes are thrown out, the remaining nonplanar structures are mostly disjoint groups which can be clustered by using Euclidean distance-based clustering. Thus, Euclidean distance-based clustering is used to segment the remaining points into {C1 , . . . , CNc } [28]. The points are placed into a kd-tree for quick distance queries. The most crowded 10% of the subtree is used to initialize a set of clusters. Then, our method assigns points to clusters so that the distance between all point pairs in one cluster is less than a threshold; e.g., given cluster Ci , then for all points pa ∈ Ci and pb ∈ Ci , ||pa − pb || ≤ TC .
3.2. Repetition Decomposition We further decompose a planar or an Euclidian segment into a connected set of repeating point clouds. For example, a labeled (planar) facade might actually have repeated instances of nearly flat windows. For this decomposition, the user is asked to identify (with a mouse-based stroke) a template segment – the approximate subset of a source segment that repeats. Our system then automatically scans the selected volume in each of the three axial directions relative to the segment coordinate frame, by sliding the template in one 2149
direction at a time, with a step size of 10% of the templateto-segment size ratio in that direction. If the translated template segment and a corresponding destination segment are similar, then the destination segment is given the same label as the template. At the user’s discretion, this process is repeated for all planar and/or Euclidian segments. The repeating segments need not be regularly distributed in their contained super-segment, but they need to have the same orientation. Two point clouds are considered similar if the number of points below the maximum Euclidean distance tolerance is less than TC of each cloud. Given both planar and Euclidian segments and user labels from template matching, similar segments are checked to have similar bounding box dimensions (e.g., within 5%) and a similar point count (e.g., within 10%) to obtain the same label. Although the measure identifies the core units of the procedural model (i.e., terminal symbols), it does not (yet) organize them into a hierarchy.
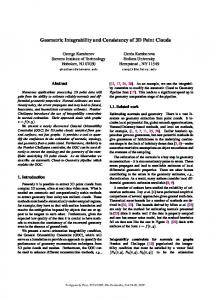
Figure 3: Consensus Model. Same segments are ICPed for CM. Poisson reconstruction is improved from original (a,b) to (c,d). (e) is Hausdorff distance.
Algorithm 1 Consensus Computation 1: 2: 3: 4: 5: 6: 7: 8: 9: 10: 11: 12: 13: 14: 15: 16:
procedure F IND BASE(A) ⊲ best in similarity group A for all i ∈ A do for all j ∈ A do align si and sj by dominant planes for all r ← sample rotation angles do rotate sj about its normal and midpoint compute ICP and store error eijr return sk → ek =min(eijr ) ∧ ek ≤ Tc procedure C REATE CM(sk , A) ⊲ CM of sim. group A d ←point density of sk r ← sk for all i ∈ A do (tmp, err) ← ICP (si , sk ) if err < Tc then r ← r + tmp return EAR(r, d) ⊲ edge-aware downsampling
4. Proceduralization The second preprocessing stage of our algorithm converts the segments into a procedural representation. We perform a top-down approach to build a tree-structure that contains all the segments. Then, we execute comparisons within the tree to identify patterns of repetition. At the end we output a procedural model.
4.1. Consensus Estimation All segments with the same labels (as per Sections 3.1 and 3.2) create a single representative consensus model (CM). The CM has the advantage of producing a result that is complete in the sense of joining multiple partial samples
of the same underlying geometry. Further, in most cases the resulting model is more complete as compared to the original segments or to an “averaged” segment. Figure 3 (and Supplementary Figure 3) shows an example of a building before and after using consensus models. In Figure 3e, we also implicitly show the completeness amount of chimneys relative to the initial model. Overall, for 93% of the components of the model, the number of points increases to from 1.2× to 4× of the original component point count, which serves as an indication of the amount of model completion. Also, as an advantage of our semi-automatic segmentation, allowing the user to label even the overly under-sampled instances of a pattern; those instances are included in the CM and recovered by our approach unlike automatic methods. The CM is found by an O(k 2 ) comparison between k segments using Iterative Closest Point (ICP) (see Algorithm 1). The segment most similar to others, by using a least squares error comparison, is used as the base segment to which all other segments are transformed. Then, the CM is initialized by that base segment, and all transformed segments are added to the model. Lastly, we perform edgeaware point resampling (EAR), using the method of Huang et al. [13], to return the point density to that of the original base segment. We also estimate the normals of the CM as in [28].
4.2. Tree Construction After a CM is found, the segments are used in a topdown construction process of a tree containing all segments and their repetitions (Figure 4). A tree node corresponds to a subset of the model represented by its bounding box. A tree edge represents an axis-aligned split operation that uses a pivot point to divide a node, and a resulting octant. 2150
Figure 4: Tree and patterns. The building segments (left) are put into the tree (right). Nodes can be invisible (N1, N2, N3) or visible (colored). Note that some invisible nodes are not shown for convenience. If a regular spacing between the applications of a pattern is found (e.g., the pink windows), then it is given the subdivide directive (P2). Otherwise it is expressed as different applications of the same pattern (e.g., roof windows, P1).
For example, defining a box within another box requires at most two sequential split operations using the two ends of a diagonal of the smaller box as pivot points. The aforementioned intermediate splits cause the creation of intermediates nodes called invisible nodes while the nodes representing actual building subsets are called visible nodes. Note that visible and invisible nodes are not the same as leaves and inner nodes of the tree (See Figure 4). For each segment, we first compute its bounding box and place it in an unlinked visible node. The root node contains the bounding box of the model. Then, the visible node with the next largest bounding box is added to the tree. It will be derived from its smallest encapsulating node and may potentially need an intermediate invisible node. The instances of patterns, as labeled in Sections 3.1, 3.2, and 4.1, will also be placed as children of the same parent.
Algorithm 2 Repetition Parameters 1: 2: 3: 4: 5: 6: 7: 8: 9: 10: 11: 12: 13: 14:
for all Ci do Ri = ∅ ⊲ Ri has patterns (dist, f req) for Ci for all Cij and Cik ∈ Ci do d ← dist of midpts of Cij and Cik ⊲ R im ∈ R i if d is a multiple of Rim .d then Rim .f ← d/Rim .d else if Rim .d is a multiple of d then Rim .f = Rim .f ∗ (Rim .d/d) + 1 Rim .d = d else create new R with R.d = d and R.f = 1 add R to Ri delete non repeating Rim set def label for non-repeating Cij
4.3. Pattern Extraction A search method finds repeating patterns of samelabeled segments (Figure 4). The method starts by placing all visible nodes of the same label into same group. Each group is inspected to verify if the subtrees of all group members are similar. If not, the group members are split out to a new group. These steps are repeated until no more group changes. Afterwards, to compensate for the invisible nodes, the groups may be altered. Each group is checked whether all subtrees have similar parent nodes. If so, the group is redefined to be based on subtrees starting one level higher in the tree. This is repeated until no more group changes. Two subtrees are considered similar in a level order traversal if corresponding nodes have similar bounding box dimensions, similar point counts and similar labels from the CM. Further, the aforementioned process is not affected by the ordering of the children nodes (i.e., changing the processing order of children leads to the same result), patterns inside other patterns are allowed, and recursive pattern applications are supported. The regular application of a pattern (i.e., multiple instantiations of the same subtree) is assumed to be a regularly-spaced 1, or 2, or 3D grid-pattern, though it does not need to be axis-aligned. While this does
not afford all building structures it captures many typical repetitions in buildings. During procedural model generation (see next Section), regular applications are compactly represented. Each repeating instance within a regular application may vary only by translation (e.g., P2 in Figure 4). However, different applications that consist of the same segments may vary by a 1, 2, or a 3D translation or rotation (e.g., P1 in Figure 4). The spacing between each instance of a segment within a repeated application is found by an analysis of the minimum repeating distance and the frequency of application. It is summarized in Algorithm 2 and is inspired by the method of Sˇ ´tava et al. [29], and the algorithm is applied in all three dimensions.
5. Editing At runtime, our interactive tool allows directly altering the generated split grammar and supports interactive editing, based on the parse tree constructed in the previous section. In both cases, the original model is altered producing a similar quality novel model. Particularly for textbased editing of the grammar, when terminal or rule pa2151
Figure 5: Completion and Editing. The original model (a) is processed to obtain (b). The segments (c) and (e) are taken from the original point cloud, whereas (d) shows automatic completion, and (f) shows procedural synthesis.
Figure 6: Reconstruction. Each row represents, original points (a,e) reconstructed with Poisson (c,g), and edited points (b,f) reconstructed with Poisson (d,h). Note the roofs in (b) and (d) are a product of style transfer from the building in (f) and (h). rameters are changed or new rules are created, the tree is re-generated based on the grammar and new geometry is obtained. In addition, for the interactive system we provide intuitive copy/paste and structure-aware resize tools (see the Supplemental Section and the video). Both include features specific to point cloud editing such as preserving the original point density and creating seamless joins between added or removed parts of the building (Supplemental Figure 2).
5.1. Smart Resize Tool Editing begins by selecting a region of interest; initial attachments are automatically computed and represented as a large sparse linear system of equations. The dimensions of the resized node(s) are put into the linear system and it is optimized for new point locations. All affected nodes are appropriately resized so as to maintain the initial relative adjacencies. If a node is overly stretched (or shrunk) for example by more than 1.5x of its initial size, then we duplicate (or merge) the node along the direction of greatest change,
preserving the pattern inside the node. Upon resizing any node, the original point density inside a node is restored by using edge-aware resampling, such as Huang et al. [13]. This resampling maintains the details of the original node. Further, we explicitly address resampling at the boundary between two nodes just placed next to each other. We define a thin neighborhood region enclosing the seam. Then, points within the seam are re-sampled so as to match the density of the surrounding region. Another choice would be applying EAR [13] to the combination of both nodes. However that choice decreases the performance and such potentially large and unnecessary point resampling might degrade point cloud sampling accuracy. There are six types of attachment constraints computed based on the adjacency graph of the nodes for a resize operation: floor, corner, plane, volume, size, and position. The last two are used whenever a node is under-constrained (e.g., a node unattached from one end uses its size information instead of having a floating end). They amount to 2152
at least six linear equations per node and are solved – similar to the method of Bokeloh et al. [5] – but we use sparse linear least squares [23] instead of dense SVD.
5.2. Seamless Procedural Copy/Paste Tool This tool enables copying and then inserting or replacing an existing rule or terminal of the model. After insertion or replacement, the new content is potentially resized, its subtree is regenerated, and seams between the copied content and its new surroundings are reduced via point re-sampling. The user selects a region to copy. The selected nodes are joined to form a single subtree. The copied subtree either i) fills the paste node’s 3D space, ii) is derived from the paste node, or iii) is inserted between the paste node and its children. During a copy-paste operation, we address several additional issues. We again use resampling at the boundary between the copied nodes and its new adjacent nodes in order to create a seamless transition. The copied node might also require a resize (thus using the mechanism of Section 5.1). Moreover, the orientation of the copy node’s main axis (e.g., the longest of the three axes of the oriented bounding box around the node) is changed to match that of the paste node’s main axis. If the copy node is a leaf, it can replace itself with more than one copy in the fill mode, creating a new pattern.
6. Results and Discussion We present results and comparisons of our method applied to point cloud models. Our software is written in C/C++ using Qt, OpenCV, Point Cloud Library (PCL)[28], and EAR [13]. We have used Meshlab and CloudCompare [8] for some reconstruction results. Our datasets include the Hannover model [14], the Lans le Villard model (1.2M points) used by Lafarge and Mallet [16] and the Townhall model (63k points) used by Arikan et al. [3]. Completion. Once a building is processed, Figure 5 shows terminal symbols more completed and interactively edited point clouds. Figures 5a-b show the overall improvement and Figures 5c-d focus on a facade. Figures 5e-f show an example interactive editing result, where the modeler applied procedural copy/paste to replace the doors with an arch structure, resized the balcony, and added semicolumns. Supplemental Figure 3 shows other close-up results focusing on the window structures. Editing. Figure 6 shows the original points (6a,e) and triangulations of them (6c,g), and the points (6b,f) and the triangulations (6d,h) of the same models after editing with our system. Despite both using the same surface triangulation method [15], our approach significantly improves the apparent quality of the reconstruction. Figure 7 shows a stylepreserving transfer from one building to another. A variety of building models can be generated from the original point
Figure 7: Style Transfer. Two original point clouds (a-b). Tower of (a) is transferred to chimney of (b), obtaining (c).
cloud, maintaining the original quality. Hence any improvements to reconstruction and/or triangulation equally benefit the original or edited models. Figure 8 shows an array of edits from an original point cloud as well as some Poisson surface reconstruction [15]. We also experimented with several other triangulation methods, ultimately finding the aforementioned surface reconstruction method to work the best in practice (see Supplemental Figure 7 for RIMLS). Also, our tool supports different scales of editing operations and it is used for completion and modeling of both large structures and small details on the window. User Experience. Table 1 shows the number of strokes (i.e., one “circling” click) and time needed to segment the models that we have shown throughout the paper. The segmentation and modeling times are short relative to the complexity of the new models thanks to our procedural editing. Comparison. Figure 9 shows the result of an alternative approach to convert the points to a polygon-based method (i.e., [3]) on the dataset of Lafarge and Mallet [16]. Figure 9a shows the automatic reconstruction of [3] and Figure 9b contains a manually-assisted result that incorporates some lost details. In contrast, Figure 9c shows our result of a more complete and detailed model, prior to procedural editing. Note the additional building details our method is able to capture and make available, even after editing (Figure 9d). Also, Supplemental Table 1 summarizes the limita-
Table 1: Statistics. The user-based segmentation and modeling statistics per figure are documented.
2153
Figure 8: Editing. The original model (a) is automatically processed to a more complete model (b). Then various styles (c-f) are interactively created. Our completed model and one of the edits are reconstructed (g, h).
Figure 9: Comparison. O-Snap [3] best cases after automatic extraction (a) and manual modeling (b). Our automatic consensus model without editing (c). The result of 4.2 minute procedural editing session (d). The insets show color-coded segments. (images a,b courtesy of [3]). tions of other previous work and exemplifies our improvements, and Supplemental Figure 5 shows the comparison of another building. Robustness. Supplemental Figure 4 shows visually how our approach is robust to various noise and sampling densities. Using a synthetic model, we inject 0, 0.5%, or 1% of random noise (horizontal axis). Further, we resample the model for the total point count to be 500k, 250k, or 100k points (vertical axis). The figure shows that segmentations similar to that at zero noise are obtained for various point densities. Despite high noise levels, only up to 5% of the component labeling was completely lost for 20% downsampling and 1% of noise. (i.e., front windows are not labeled).
7. Conclusions and Future Work We have presented an approach for procedural modeling of building point clouds. Our method first detects the repeating structures by using semi-automatic segmentation and template matching. In the second step we create a tree representation of the input and generate the grammar by using a consensus-based voting scheme and a pattern extraction algorithm. During an interactive step, the user can interact with the system by creating new point clouds by using procedural copy and paste operations and by our
optimization-based resizing. We have used our approach to edit building models with up to 1.8M points requiring a few minutes preprocessing time and supporting interactive editing. Our work has some limitations. First, if the model has a few repetitions, it will still be converted into a tree, but the generated grammar will have fewer rules. Second, our consensus-model completion needs multiple instances of a segment to improve the model. Third, our pattern detection scheme does not explicitly recognize more intricate arrangements such as spiral patterns. As future work, we would like to incorporate additional segmentation algorithms, beyond planar and Euclidean cluster assumptions but still exploiting repetition and proceduralization, and potentially use machine learning methods. In addition, we would like to apply the same approach to city-scale Li-DAR data or other urban structures.
Acknowledgements This research was funded in part by NSF CBET 1250232 and NSF IIS 1302172. We also thank Illia Ziamtsov and Innfarn Yoo for their help with reconstruction and rendering. We also thank Murat Arikan and Florent Lafarge for providing their datasets. 2154
References [1] S. AlHalawani, Y.-L. Yang, H. Liu, and N. J. Mitra. Interactive facades analysis and synthesis of semi-regular facades. Comp. Graph. Forum, 32(2pt2):215–224, 2013. 2, 3 [2] J. Andrews, H. Jin, and C. S´equin. Interactive inverse 3d modeling. Comp. Aided Design and Applications, 9(6), 2012. 3 [3] M. Arikan, M. Schw¨arzler, S. Fl¨ory, M. Wimmer, and S. Maierhofer. O-snap: Optimization-based snapping for modeling architecture. ACM Trans. Graph., 32:6:1–6:15, 2013. 1, 3, 7 [4] S. Becker and N. Haala. Grammar supported facade reconstruction from mobile lidar mapping. In In ISPRS Workshop on Object Extraction for 3D City Models, Road Databases and Traffic Monitoring, 2009. 2 [5] M. Bokeloh, M. Wand, H.-P. Seidel, and V. Koltun. An algebraic model for parameterized shape editing. ACM Trans. Graph., 31(4):78:1–78:10, July 2012. 3, 7 [6] M. Cabral, S. Lefebvre, C. Dachsbacher, and G. Drettakis. Structure-Preserving Reshape for Textured Architectural Scenes. Comp. Graph. Forum., 2009. 3 [7] J. Chen and B. Chen. Architectural modeling from sparsely scanned range data. International Journal of Computer Vision, 78(2-3):223–236, 2008. 1 [8] CloudCompare - http://www.danielgm.net/cc/, 2015. 7 [9] I. Demir, D. G. Aliaga, and B. Benes. Coupled segmentation and similarity detection for architectural models. ACM Trans. Graph., 34(4):104:1–104:11, July 2015. 3 [10] A. Dimitrov and M. Golparvar-Fard. Segmentation of building point cloud models including detailed architectural/structural features and {MEP} systems. Automation in Construction, 51(0):32 – 45, 2015. 2 [11] N. Gelfand and L. J. Guibas. Shape segmentation using local slippage analysis. In Proc. of the Symp. on Geometry Processing, SGP ’04, pages 214–223. ACM, 2004. 2 [12] A. Golovinskiy, V. G. Kim, and T. Funkhouser. Shape-based recognition of 3D point clouds in urban environments. International Conf. on Computer Vision (ICCV), 2009. 1, 2 [13] H. Huang, S. Wu, M. Gong, D. Cohen-Or, U. Ascher, and H. R. Zhang. Edge-aware point set resampling. ACM Trans. Graph., 32(1):9:1–9:12, Feb. 2013. 2, 4, 6, 7 [14] Institute fur Kartographie und Geoinformatik - www.ikg.unihannover.de/index.php?id=413A, 2015. 7 [15] M. Kazhdan, M. Bolitho, and H. Hoppe. Poisson surface reconstruction. In Proc. of SGP, pages 61–70, 2006. 7 [16] F. Lafarge and P. Alliez. Surface reconstruction through point set structuring. Comp. Graph. Forum, 32(2pt2):225– 234, 2013. 1, 7 [17] F. Lafarge and C. Mallet. Building large urban environments from unstructured point data. In Proceedings of the 2011 International Conference on Computer Vision, ICCV ’11, pages 1068–1075, 2011. 3 [18] H. Lin, J. Gao, Y. Zhou, G. Lu, M. Ye, C. Zhang, L. Liu, and R. Yang. Semantic decomposition and reconstruction of residential scenes from lidar data. ACM Trans. Graph.,, 32(4), 2013. 1, 3
[19] M. Mathias, A. Martinovic, J. Weissenberg, and L. V. Gool. Procedural 3d building reconstruction using shape grammars and detectors. In Proc. of the 3DIMPVT, 3DIMPVT ’11, pages 304–311, 2011. 2 [20] N. Mitra, M. Wand, H. R. Zhang, D. Cohen-Or, V. Kim, and Q.-X. Huang. Structure-aware shape processing. In SIGGRAPH Asia 13 Courses, pages 1:1–1:20, 2013. 3 [21] P. Musialski, P. Wonka, D. G. Aliaga, M. Wimmer, L. van Gool, and W. Purgathofer. A survey of urban reconstruction. Comp. Graph. Forum, 32(6):146–177, 2013. 2 [22] L. Nan, A. Sharf, H. Zhang, D. Cohen-Or, and B. Chen. Smartboxes for interactive urban reconstruction. ACM Trans. Graph.,, 29(4):Article 93, 2010. 1, 3 [23] C. C. Paige and M. A. Saunders. Lsqr: An algorithm for sparse linear equations and sparse least squares. ACM Trans. Math. Softw., 8(1):43–71, Mar. 1982. 2, 7 [24] M. Pauly, N. J. Mitra, J. Giesen, M. Gross, and L. J. Guibas. Example-based 3d scan completion. In Proceedings of SGP, SGP ’05, 2005. 1 [25] M. Pauly, N. J. Mitra, J. Wallner, H. Pottmann, and L. J. Guibas. Discovering structural regularity in 3d geometry. ACM Trans. Graph., 27(3):43:1–43:11, Aug. 2008. 3 [26] H. Riemenschneider, U. Krispel, W. Thaller, M. Donoser, S. Havemann, D. Fellner, and H. Bischof. Irregular lattices for complex shape grammar facade parsing. In Computer Vision and Pattern Recognition (CVPR), 2012 IEEE Conference on, pages 1640–1647, June 2012. 2 [27] N. Ripperda and C. Brenner. Application of a Formal Grammar to Facade Reconstruction in Semiautomatic and Automatic Environments. 2009. 2 [28] R. Rusu and S. Cousins. 3d is here: Point cloud library (pcl). In Robotics and Automation (ICRA), 2011 IEEE Intl. Conf. on, pages 1–4, May 2011. 2, 3, 4, 7 [29] O. Stava, B. Benes, R. Mech, D. G. Aliaga, and P. Kristof. Inverse procedural modeling by automatic generation of lsystems. Comp. Graph. Forum, 29(2):665–674, 2010. 5 [30] A. Toshev, P. Mordohai, and B. Taskar. Detecting and parsing architecture at city scale from range data. In Computer Vision and Pattern Recognition (CVPR), 2010 IEEE Conference on, pages 398–405, June 2010. 1, 2 [31] C. A. Vanegas, D. G. Aliaga, and B. Benes. Building reconstruction using manhattan-world grammars. In Computer Vision and Pattern Recognition (CVPR), 2010 IEEE Conference on, pages 358–365, June 2010. 2 [32] C. Wu, S. Agarwal, B. Curless, and S. M. Seitz. Schematic surface reconstruction. In IEEE Conference on Computer Vision and Pattern Recognition, 2012. 2 [33] G. Zhang, P. A. Vela, , and I. Brilakis. Automatic Generation of As-Built Geometric Civil Infrastructure Models from Point Cloud Data. 3 [34] Q. Zheng, A. Sharf, G. Wan, Y. Li, N. J. Mitra, D. CohenOr, and B. Chen. Non-local scan consolidation for 3d urban scenes. ACM Trans. Graph., 29(4):94:1–94:9, July 2010. 3 [35] Q.-Y. Zhou and U. Neumann. 2.5d building modeling by discovering global regularities. In Computer Vision and Pattern Recognition (CVPR), pages 326–333, 2012. 1, 2, 3
2155