The Self-Organizing Map (SOM) is a powerful neural network method for ..... The SOM algorithm has been implemented in a free software package ..... ula, O., and Kangas, J., editors, Arti cial Neural Networks, volume II, pages 1229 1232,.
Process Monitoring and Modeling using the Self-Organizing Map
Esa Alhoniemi, Jaakko Hollmén, Olli Simula and Juha Vesanto Helsinki University of Technology Laboratory of Computer and Information Science P.O. Box 2200, FIN-02015 HUT, Finland
Abstract
The Self-Organizing Map (SOM) is a powerful neural network method for analysis and visualization of high-dimensional data. It maps nonlinear statistical dependencies between high-dimensional measurement data into simple geometric relationships on a usually twodimensional grid. The mapping roughly preserves the most important topological and metric relationships of the original data elements and, thus, inherently clusters the data. The need for visualization and clustering occur, for instance, in the analysis of various engineering problems. In this paper, the SOM has been applied in monitoring and modeling of complex industrial processes. Case studies, including pulp process, steel production, and paper industry are described.
1 Introduction In modeling and control of industrial processes, it is usually assumed that a global, analytical system model can be de�ned. If such a model cannot be built, or di�erent kind of approach is desirable, Arti�cial Neural Networks (ANNs) can be used. ANN models are built directly based on process measurements, and thus provide a means to analyze processes without explicit physical process model. ANNs can also be used as �soft sensors� to estimate signal values or process variables that are di�cult to obtain or can only be measured o�-line. The use of the ANNs, however, requires that a large amount of good quality, stable, numerical data describing the process are available. The Self-Organizing Map (SOM) (Kohonen, 1995) is one of the most popular neural network models. The algorithm is based on unsupervised learning, which means that the training is entirely data-driven. Unlike networks based on supervised learning (like the multi-layer perceptron) which require that target values corresponding to input vectors are known, the SOM can be used for clustering data without knowing the class memberships of the input data. It can, thus, be used to detect features inherent to the problem. The SOM has been successfully applied in various engineering applications (Kohonen et al., 1996b) covering, for instance, areas like pattern recognition, image analysis, process monitoring and control, and fault diagnosis (Simula et al., 1996; Simula and Kangas, 1995; Tryba and Goser, 1991). In telecommunication systems, the SOM has been used in adaptive resource allocation and optimization (Tang and Simula, 1996a; Tang and Simula, 1996b). In speech processing, the SOM has been used in phoneme recognition (Kohonen, 1988) and in speech signal quality analysis (Leinonen et al., 1993). It has also proven to be a valuable tool in data mining and knowledge discovery with applications in full-text and �nancial data analysis (Kaski, 1997; Kohonen et al., 1996b). In this paper, SOM based methods in the analysis of complex systems are discussed. Special emphasis is on industrial applications in which a lot of measured information is available from automation systems.
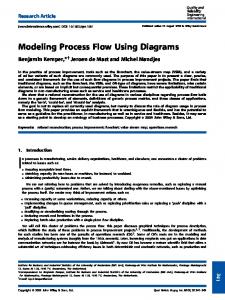
2 The Self-Organizing Map The SOM algorithm performs a topology preserving mapping from high-dimensional space onto map units so that relative distances between data points are preserved. The map units, or neurons, form usually a two-dimensional regular lattice. The SOM can thus serve as a clustering tool of high-dimensional data. It also has capability to generalize, i.e. the network can interpolate between previously encountered inputs. Each neuron i of the SOM is represented by an n-dimensional weight, or model vector, mi = [mi1; : : : ; min]T (n is the dimension of the input vectors). The weight vectors of the SOM form a codebook. The neurons of the map are connected to adjacent neurons by a neighborhood relation, which dictates the topology, or the structure, of the map. Usually rectangular or hexagonal topology is used. Immediate neighbors (adjacent neurons) belong to neighborhood Ni of the neuron i. In the basic SOM algorithm, the topological relations and the number of neurons are �xed from the beginning. The number of neurons determines the granularity of the mapping, which a�ects accuracy and generalization capability of the SOM. An example of applying the SOM in industrial process analysis is shown in Figure 1. The di�erent stages in the Figure are discussed more closely in Sections 2.1 � 2.4.
2.1 Data processing
The SOM, like other neural network models, follows the �garbage in - garbage out� principle: if erroneous data are used, the result is poor. For that reason, the input data must be processed carefully. Figure 2 illustrates data acquisition and manipulation process before training the SOM. Data acquisition means making a database query, measuring variables etc. Data of this form are often called raw data. If the data are coded in a non-metric scale, the coding must be transformed. Measurements must be quanti�able, because the Euclidean distance is usually used as a measure of similarity by the SOM. Coding must be in harmony with the similarity measure used. Symbolic data cannot be processed with the SOM as such, but it can be transformed to a suitable form (Ritter and Kohonen, 1989). Data preprocessing stage removes or corrects erroneous data. Typical preprocessing operation is �ltering using �xed or adaptive conditions. The �lters are typically built using a priori knowledge of the problem domain. Unfortunately, �ltering sometimes leaves gaps of missing values in the input vectors. However, even this kind of data can be utilized elegantly by the SOM (Samad and Harp, 1992). Segmentation divides the input data into separate subsets according to criteria, which are often determined using a priori knowledge. Feature extraction transforms input data vectors into such form that they describe the problem better from the analysis' point of view. In speech recognition, for instance, spectral features may be computed using the Fourier transform. Normalization gives input data components a desired weight in the SOM training. One may, for example, scale the components so that they all have unit variance. This assures that each component has equal in�uence in training.
2.2 Training of the SOM
During iterative training procedure, the SOM forms an elastic net that folds onto �cloud� formed by input data. The net tends to approximate the probability density of the data (Kohonen, 1995): the codebook vectors tend to drift there where the data are dense, while there are only a few codebook vectors where data are sparse. At each training step, one sample vector x is randomly drawn from the input data set. Distances (i.e., similarities) between the x and all the codebook vectors are computed. The 2
best-matching unit (BMU), noted here by c, is the map unit whose weight vector is closest to the x. For BMU holds
jjx ? mcjj = min fjjx ? mijjg; i
(1)
where k � k is a distance measure, typically Euclidean. After �nding the BMU, the weight vectors of the SOM are updated. The BMU and its topological neighbors are moved closer to the input vector in the input space (for an illustration see Figure 3). The update rule for the weight vector of unit i is:
(
i (t) + �(t)[x(t) ? mi (t)]; i 2 Nc (t) (2) mi(t + 1) = m mi(t); i 62 Nc(t) where t denotes time. The x(t) is the input vector randomly drawn from the input data set at
time t, Nc (t) is non-increasing neighborhood function around the winner unit c and 0 < �(t) < 1 is learning coe�cient, which is a decreasing function of time. Training is usually performed in two phases. In the �rst phase, relatively large initial alpha value is used (�(t0 ) = 0:3; : : : ; 0:99) whereas small initial alpha value (�(t0 ) = 0:01; : : : ; 0:1) is used during the second phase. This procedure corresponds to �rst tuning the SOM approximately to the same space as the input data and then �ne-tuning the map.
2.3 Validation and interpretation
The quality of the mapping is usually determined based on (1) precision and (2) topology preservation. The former can be measured using average quantization error: the average distance between the input vectors of the testing set and the corresponding BMUs. Di�erent topology measures have been studied e.g. by Kiviluoto (Kiviluoto, 1996) and Kaski and Lagus (Kaski and Lagus, 1996), who proposed a goodness meter which combined both properties. The SOM can be interpreted by naming the units according to input vectors, whose type (e.g., class) is known. This labeling gives physical interpretation of the network. If labeled vectors are not available, the map can be interpreted by direct inspection of the weight vectors and clusters on the map. This is easiest to accomplish using di�erent visualization techniques discussed in the next Section. Also automatic interpretation of the map is possible using fuzzy rules as done by Pedrycz and Card (Pedrycz and Card, 1992).
2.4 Visualization
The SOM can be used e�ciently in data visualization due to its ability to approximate the probability density of input data and to represent it in two dimensions. In the following, several ways to visualize the network are introduced using a simple application example, where a computer system in a network environment was measured in terms of utilization rates of the central processing unit and tra�c volumes in the network. The SOM was used to form a representation of the characteristic states of the system. The uni�ed distance matrix (u-matrix) method by Ultsch (Ultsch and Siemon, 1990) visualizes the structure of the SOM. Firstly, a matrix of distances (u-matrix) between the weight vectors of adjacent units of a two-dimensional map is formed. Secondly, some representation for the matrix is selected (for example, a grey-level image (Iivarinen et al., 1994)). The u-matrix of the example system is shown in Figure 4a. The lighter the color between two map units is, the smaller is the relative distance between them. On the left side, there is a large uniform area, which corresponds to idle state of the computer system. Top right corner forms a clearly separated area, which corresponds to high CPU load in the system. 3
Component plane representation visualizes relative component values of the weight vectors of the SOM. The illustration can be considered as a �sliced� version of the SOM, where each plane shows the distribution of one weight vector component. Using the distributions, dependencies between di�erent process parameters can be roughly studied. For example, Tryba et al. (Tryba et al., 1989) have used this kind of visualization to investigate parameter variations in VLSI circuit design. The component planes of the example system are presented in Figure 4c. The colors of map units have been selected so that the lighter the color is, the smaller is the relative component value of the corresponding weight vector. It can be seen, for instance, that the components #1, #2 and #6 (blocks per second, written blocks per second and write I/O percentage) are highly correlated. Sammon's mapping is an iterative algorithm (Sammon Jr., 1969) to project high-dimensional vectors in two dimensions. The nonlinear mapping tries to preserve the relative distances between input vectors. The algorithm can be used to visualize the SOM by mapping the values of the weight vectors onto a plane. To enhance the net-like look, the neighboring map units may be connected to each other with lines to show the topological relations. Since the SOM tends to approximate the probability density of the input data, the Sammon's mapping of the SOM can be used as a very rough approximation of the form of the input data. The Sammon's mapping of the example system is illustrated in Figure 4d. According to the mapping, the SOM seems to be well-ordered in the input space. Naturally Sammon's mapping can be applied directly to data sets, but because it is computationally very intensive, it is too slow for large data sets. However, the SOM quantizes the input data to a small number of weight vectors, which lightens the burden of computation to an acceptable level. Data histogram shows how input data are clustered by the SOM. In other words, it shows how many input vectors belong to clusters de�ned by each map unit. The histogram is formed using a trained SOM and a data set: for each data set vector, BMU is determined, and �hit counter� of that unit is increased by one. The histograms may be visualized in many ways. In our example, we have used squares of di�erent sizes: the larger the square is, the larger is the counter value. The data histogram of the example application is shown in Figure 4e. Operating point and trajectory can be used to study the behavior of a process in time. The operating point of the process is the BMU of the current measurement vector. The location of the point on the topologically ordered SOM can be easily visualized and used to determine the current process state. If also the history of the process is of interest, a sequence of operating points in time forming a trajectory can be studied. The trajectory shows the movement of the operating point, which in some cases may be a very useful piece of information. A piece of trajectory of the example system is illustrated in Figure 4b. The trajectory starts from the normal operation area and moves through disk intensive phase to high load area.
2.5 Software tools
SOM_PAK. The SOM algorithm has been implemented in a free software package SOM_PAK (Kohonen et al., 1996a) written in ANSI C. The package includes tools for SOM training (see Section 2.2), validation (2.3) and visualization (2.4). The software uses simple ASCII �les and can use data with missing vector components (Samad and Harp, 1992). Graphical output of the program is in encapsulated postscript (eps) format. An exhaustive description of the package can be found in (Kohonen et al., 1996a).
Since the �exibility of the SOM can only be fully exploited in a versatile computing environment, a freely available software package SOM Toolbox (Alhoniemi et al., 1997) has been developed for Matlab 5 environment (Mathworks Inc., 1996). The package includes basic
SOM Toolbox.
4
initialization, training and validation algorithms of the SOM. Special attention has been given to easy and e�ective SOM visualization. The Figures 4a � 4e in the Section 2.4 were produced using the SOM Toolbox. Since all the algorithms have been implemented using simple and well documented Matlab scripts, the functions are easy to use and modify in the diverse needs that unavoidably arise. The package is also compatible with the SOM_PAK.
3 Process monitoring using the Self-Organizing Map Figure 1 shows how the input vectors of the SOM are formed and manipulated when the monitored process is an industrial process. Input and output measurements as well as process parameters are collected into data bu�er, where data is processed (see Section 2.1 for more details). In process monitoring, two di�erent approaches can be distinguished. (1) The SOM may be applied in on- or o�-line process analysis. In this case, typically analysis of normal operation of the process is essential � not possible system faults. (2) The SOM may be used to detect (and possibly identify) faults occurred in the process. Now the situation is opposite: role of faults is emphasized and variations in the normal operation are less important. Representative examples and many references can be found in articles by Kohonen et al. (Kohonen et al., 1996b) and Simula and Kangas (Simula and Kangas, 1995).
3.1 Process analysis
A fruitful application area for process analysis is, for instance, chemical process industry. The SOM may be applied to on-line observation of processes as well as o�-line analysis of process data. Because clear faults seldom occur in such processes and are typically quite uninteresting, faulty situations should be �ltered out from the training data set to be able to analyze normal operation more accurately. In on-line use, the SOM is used to form a display of the operational states of the process. The operation point (i.e., the current process state) and its history in time can be visualized as a trajectory on the map which makes it possible to track the process dynamics in a new way (see Figure 4b). The SOM facilitates understanding of processes so that several variables and their interactions may be inspected simultaneously. In o�-line analysis, the SOM is also a highly visual data exploration tool. Non-linear dependencies between process variables can be e�ectively presented using several techniques some of which were described in Section 2.4. Kasslin et al. (Kasslin et al., 1992) used the SOM to monitor the state of a power transformer and to indicate when the process was entering a non-desired state represented by a �forbidden� area on the map. Tryba and Goser (Tryba and Goser, 1991) applied the SOM in monitoring of a distillation process and discussed its use in chemical process control in general.
3.2 Fault detection
If only detecting a fault is desired, the SOM is trained using measurement vectors describing normal operation only. Vectors representing abnormal behavior of the process need to be removed from the training data set. This means the SOM is trained to form a mapping of the �normal operation� input space. A faulty situation can be detected by monitoring the quantization error (distance between input vector and the BMU). Large error indicates that the process is out of the normal operation space. For example, Alander et al. (Alander et al., 1991) and Harris (Harris, 1993) have used the SOM for this purpose. The problem of fault detection and identi�cation is more di�cult. The SOM is trained using all possible data describing the process: both normal and abnormal situations should be present in the training data set; if necessary, measurements describing simulated faults may be added. Map units representing faulty states of the process may be marked (labeled) according to known 5
samples. The monitoring is based on tracking of the operation point: location of the point on the map indicates the process state and the possible fault type. Vapola et al. (Vapola et al., 1994) constructed a two-level SOM model, which was used �rst to detect and then to identify fault conditions in an anesthesia system.
4 Process modeling using the Self-Organizing Map
4.1 SOM as non-linear regression tool
General regression of y on x is usually de�ned as y^ = E (yjx). That is, the expectation of the output y given the input vector x. To motivate the use of the SOM for regression, it is worth noting that the codebook vectors represent local averages of the training data. The SOM can be used for predicting, for example, the output quality of a process given the measurements of incoming raw material characteristics and process parameter settings (Hollmén and Simula, 1996). Regression is accomplished by searching for the BMU using
c = arg min i
X
j 2S
(xj ? mij )2 ;
(3)
where S is the set of known vector components of x. As an output, a copy of components k 2= S of the codebook vector mc: y^ = mck are given (see Figure 5). The accuracy of the model is controlled by the number of codebook vectors. A SOM with large number of map units quantizes the data space densely enabling an accurate regression, while a SOM with only a few map units provides a sparse quantization of the data space, in which case the regression is very coarse but a better generalization is achieved.
4.2 Local linear models
The accuracy of the SOM model can be increased by building local models for the data in the Voronoi sets of the SOM. The Voronoi set Vi of map unit i is a set of vectors fx1 ; : : : ; xn g, for which the codebook vector mi is closest:
Vi = fx j kmi ? xk < kmj ? xk; 8j; j 6= ig:
(4) The Voronoi sets provide a partitioning of the input data into disjoint sets. Each set contains points that are near each other in the data space. Subsets are modeled by independent local models, which together are considered a solution to the modeling problem. Each model is based on local data set Vi only. This kind of approach could be called divide-and-conquer modeling. The models are not constrained to be of any speci�c form, or not even of similar form. In our experiments, only simple local linear models have been considered. A total least squares type of linear regression can be performed using Principal Component Analysis (PCA) in model �tting. This approach allows measurement errors also in inputs while the usual least squares approach assumes that the input variables are accurate and there is error in the output variables only (Rao and Toutenburg, 1995). These two modeling methods combined take advantage of the nonlinear elasticity of the SOM as well as the local e�ciency of the PCA. Also the topology preservation property of the SOM projection can be incorporated by allowing neighboring data sets and models to interact in some way. Ritter et al. (Ritter et al., 1992) used this approach in local modeling of three-dimensional working space of a robot arm.
4.3 Sensitivity analysis
It is often desirable to know behavior of a system under small changes made in the system parameters. This is especially the case in industrial environments, where noise is present both 6
in measurements and in operating conditions. In process control, the state of the process is desired to be moved in such a direction that better quality is achieved. The operation point needs to be stable: small random �uctuations in input parameters must not cause large changes in output parameters. The model described in Section 4.1 can be used to investigate leverage e�ects of small changes made in one of the process parameters. This is possible because the system cannot reach all the possible values in the space de�ned by the measurements, but may be limited to a lowdimensional manifold. The state space, or the space of possible values, is constrained by the characteristic behavior of the system. This is illustrated in Figure 6, which depicts a twodimensional SOM trained with data originating from a three-dimensional measurement space. As a small change along one of the axes de�ned by the measurements is imposed, the BMU changes to another map unit. By tracking the change of the BMU caused by the change of the parameters, the mutual nonlinear dependence of the parameters is revealed; one is �sur�ng� on a low-dimensional manifold de�ned by the SOM projection.
5 Some case studies
5.1 Monitoring: A continuous pulp digester
In a case study, a continuous pulp digester of a pulp mill was studied. Input vectors of the SOM consisted of 11 temperature sensor readings from digester sides and one output quality measurement, kappa number. The aim of the test was to study correlation between the kappa number and the temperatures. The process temperature was beforehand known to be one of the most important factors in successful digester operation. Input data consisted of material collected during a half year period at the mill (about 20000 measurements per channel). Erroneous measurements were �ltered out from the input data using a priori knowledge of the process. Only data depicting steady operation of the process were selected for use. The input vector components were delayed with respect to each other in time so that each vector consisted of the temperature pro�le of �a piece� of pulp and corresponding kappa number. After input data processing, there were 9975 12-dimensional input data vectors. A SOM of 40 by 25 units was trained using the vectors so that the BMU was searched using the 11 temperatures, and the adaptation was made using the temperatures and the kappa number. This way it was possible to study the correlation between temperatures and end product quality. The component planes of the SOM are presented in Figure 7. Black color indicates high temperature and white correspondingly low. For example, high temperatures in eight �rst measurements #1 � #8 (black spot in the middle of plane) are re�ected in last plane, the kappa number, by small values (white spot in the middle). The kappa number roughly correlates (inversely) with the eight �rst temperature measurements. The phenomenon has clear explanation: when the cooking temperature is high, the deligni�cation reactions are fast and the kappa number becomes low. Because the kappa number also depends on factors not included in the analysis (like concentration of cooking chemicals participating in the deligni�cation reaction), kappa number variations that cannot be explained by temperatures are observed.
5.2 Modeling: Steel production
The methods described in Section 4 were used in modeling of a steel production process. The part of the process studied consisted of a cold rolling and batch annealing process. Prior to cold rolling, steel coils are opened and pickled in an acid bath to remove corrosion and excess dirt from the surface of the coil. In cold rolling, the coils are rolled using a tandem mill, where a few consecutive rolls reduce the thickness of the coil. In addition to thinning e�ects, this improves the strength of the steel. Then, a batch annealing follows the rolling operation. The coils are heated to high temperature, after which they are cooled o� slowly. This improves 7
the microstructure of the steel which a�ects such qualities as strength and elasticity. As the last processing step, the coils go through a temper mill, where a slight reduction in the thickness is made. This improves the microstructure of the steel as well as the strength. The analysis was based on measurements made in the production environment. The inputted steel coils were characterized by their element concentrations (C Si Mn P S Al Nb V Ti Cu Cr Ni Mo B N), the production environment by the pre-set reductions of the steel rolls and the end quality, which was measured by three quality parameters that re�ected the mechanical properties of steel (such as tensile strength). The goal was to predict the end product quality with the knowledge of inputted steel element concentrations as well as production parameters. In this way, costly o�-line measurements could be replaced by on-line prediction of the output quality. The measurements were collected from the factory automation system and divided into two di�erent sets: the training set (2306 coils) and the testing set (906 coils). The models were trained with the training set and their performance was tested with the testing set not used in training. When testing the model, the measured end product quality was compared with model output to produce an error estimate of the models (see Table I). The �rst row of the Table demonstrates the inferiority of linear models in this application. The three next rows show the performance of the SOM models at three di�erent resolutions. It can be clearly seen that increasing number of codebook vectors improves the accuracy. By the introduction of local linear models, we can further improve the accuracy of these models.
5.3 Data mining: Pulp and paper mills
In this study, the SOM was used for data mining to analyze the technology data of the world pulp and paper industry. There were three data sets which contained information of (1) the production capacities of di�erent product types in pulp and paper mills, (2) the technology of paper machines and (3) technology of pulp lines. Since each mill could contain several paper machines and pulp lines, a hierarchical structure of maps was used (see Figure 8). The two low-level maps extracted relevant information regarding the paper machines and pulp lines data of a mill and the high-level map combined this with production capacity data. The low level maps (size 20 by 1 units) were constructed using paper machine and pulp line data sets. The seven component planes of the paper machine map are shown in Figure 9. Based on the map, three main types of paper machines could be determined: (1) new paper machines with very big capacity, (2) paper machines with big paper weight and (3) paper machines whose size and capacity decrease steadily with increasing age. A similar study of the pulp line map produced three main pulp line types: (1) those using waste paper for pulp, (2) those making unbleached pulp and (3) those making chemical pulp mainly from wood �ber. The high level map (size 40 by 25 units) was trained using the mill-speci�c production capacity information of the �rst data set and histograms from the low level maps. For each mill, the histograms were computed using data of the paper machines and pulp lines of the mill. Figures 10a and 10b show the u-matrix of the high level map and the distribution of Scandinavian and Chinese pulp and paper mills on the map, respectively. The two sets are easily separable although there was no geographic information present in the data. Scandinavia represents a technologically advanced region. The mills are new, they have bigcapacity paper machines and the majority produces printing/writing papers or pulp. Chinese mills, on the other hand, have many machines and they produce both industrial and printing/writing papers. It can also be seen that in the area where the majority of the Chinese mills are the values of the u-matrix are very low. That is, the variation between weight vectors in that area is low, which means that these mills resemble each other.
8
6 Summary In this paper, the use of the SOM in analysis, monitoring and modeling of various industrial applications has been presented. Practical results show that the SOM is especially suitable in tasks which require processing of large amounts of numerical data. The method is readily explainable, simple and highly visual. The SOM provides data-driven approach to process monitoring. When using the SOM, it is not necessary to de�ne process model analytically. The SOM has the desirable feature of describing nonlinear relationships between large number of parameters and variables of complex systems phenomenologically. By using a history of measurements, dynamical behavior of the process can be introduced into the map, or set of maps. This approach has been used to model the sequence of states and based on that to predict the future state in the system operation (Principe and Wang, 1995; Simula et al., 1996). The SOM facilitates visual understanding of processes. For instance, process operation personnel may learn to adjust the control variables in such a way that the operation point, or trajectory, stays in the desired region on the map. In this way, correct control action may be easily learned based on the visual output. The construction of feature vectors allows fusion of di�erent data and measurement sources. For instance, in the analysis of complex industrial processes, technical, economical, and environmental data can be combined (Vesanto et al., 1997). This allows the analysis and simulation of various e�ects in the entire �eld of industry, e.g., the in�uence of various technical investments can be analyzed in the factory level.
7 Acknowledgments This work has been carried out in the technology program �Adaptive and Intelligent Systems Applications� �nanced by the Technology Development Center of Finland (TEKES). The cooperation of Rautaruukki Strip Products, Rautaruukki Research Center, Jaakko Pöyry Consulting and UPM-Kymmene is gratefully acknowledged.
9
References Alander, J. T., Frisk, M., Holmström, L., Hämäläinen, A., and Tuominen, J. (1991). Process error detection using self-organizing feature maps. In Kohonen, T., Mäkisara, K., Simula, O., and Kangas, J., editors, Arti�cial Neural Networks, volume II, pages 1229�1232, Amsterdam, Netherlands. North-Holland. Alhoniemi, E., Himberg, J., Kiviluoto, K., Parviainen, J., and Vesanto, J. (1997). SOM Toolbox for Matlab. available via WWW at http://www.cis.hut.�/somtoolbox/. Harris, T. (1993). A Kohonen S.O.M. based, machine health monitoring system which enables diagnosis of faults not seen in the training set. In Proc. of the Int. Joint Conf. on Neural Networks (IJCNN'93), Nagoya, Japan, volume I, pages 947�950. IEEE Service Center. Hollmén, J. and Simula, O. (1996). Prediction models and sensitivity analysis of industrial production process parameters by using the self-organizing map. In Proc. of IEEE Nordic Signal Processing Symposium (NORSIG'96), pages 79�82. Iivarinen, J., Kohonen, T., Kangas, J., and Kaski, S. (1994). Visualizing the clusters on the self-organizing map. In Carlsson, C., Järvi, T., and Reponen, T., editors, Proc. Conf. on Arti�cial Intelligence Res. in Finland, pages 122�126. Kaski, S. (1997). Data exploration using self-organizing maps. Acta Polytechnica Scandinavica, Mathematics, Computing and Management in Engineering Series No. 82. DTech Thesis, Helsinki University of Technology, Finland. Kaski, S. and Lagus, K. (1996). Comparing self-organizing maps. In von der Malsburg, C., von Seelen, W., Vorbrüggen, J. C., and Sendho�, B., editors, Proceedings of ICANN96, International Conference on Arti�cial Neural Networks, Bochum, Germany, July 16-19, Lecture Notes in Computer Science, vol. 1112, pages 809�814. Springer, Berlin. Kasslin, M., Kangas, J., and Simula, O. (1992). Process state monitoring using self-organizing maps. In Aleksander, I. and Taylor, J., editors, Arti�cial Neural Networks, 2, volume II, pages 1531�1534, Amsterdam, Netherlands. North-Holland. Kiviluoto, K. (1996). Topology preservation in self-organizing maps. In Proc. of Int. Conf. on Neural Networks (ICNN'96), volume 1, pages 294 � 299, New York, NY, USA. IEEE. Kohonen, T. (1988). The 'neural' phonetic typewriter. Computer, 21(3):11�22. Kohonen, T. (1995). Self-Organizing Maps, volume 30 of Springer Series in Information Sciences. Springer, Berlin, Heidelberg. Kohonen, T., Hynninen, J., Kangas, J., and Laaksonen, J. (1996a). SOM_PAK: The SelfOrganizing Map Program Package. Technical Report A31, Helsinki University of Technology, Laboratory of Computer and Information Science. program package available via WWW at http://www.cis.hut.�/nnrc/som_pak/. Kohonen, T., Oja, E., Simula, O., Visa, A., and Kangas, J. (1996b). Engineering applications of the self-organizing map. Proceedings of the IEEE, 84(10):1358 � 1384. Leinonen, L., Hiltunen, T., Torkkola, K., and Kangas, J. (1993). Self-organized acoustic feature map in detection of fricative-vowel coarticulation. J. Acoust. Soc. of America, 93(6):3468� 3474. Mathworks Inc. (1996). Using Matlab Version 5. (Mathworks WWW address: http://www.mathworks.com/). 10
Sammon Jr., J. W. (1969). A nonlinear mapping for data structure analysis. IEEE Transactions on Computers, C-18(5):401�409. Pedrycz, W. and Card, H. C. (1992). Linguistic interpretation of self-organizing maps. In Proc. of International Conference on Fuzzy Systems '92. Principe, J. C. and Wang, L. (1995). Non-linear time series modeling with Self-Organization Feature Maps. In Proc. NNSP'95, IEEE Workshop on Neural Networks for Signal Processing, pages 11�20. IEEE Service Center. Rao, C. R. and Toutenburg, H. (1995). Linear models: least squares and alternatives. SpringerVerlag, New York. Ritter, H. and Kohonen, T. (1989). Self-organizing semantic maps. Technical Report A8, Helsinki University of Technology, Laboratory of Computer and Information Science. Ritter, H., Martinetz, T., and Schulten, K. (1992). Neural Computation and Self-Organizing Maps. Addison-Wesley Publishing Company. Samad, T. and Harp, S. A. (1992). Self-organization with partial data. Network: Computation in Neural Systems, 3(2):205�212. Simula, O., Alhoniemi, E., Hollmén, J., and Vesanto, J. (1996). Monitoring and modeling of complex processes using hierarchical self-organizing maps. In Proceedings of the IEEE International Symposium on Circuits and Systems (ISCAS'96), volume Supplement, pages 73�76. Simula, O. and Kangas, J. (1995). Neural Networks for Chemical Engineers, volume 6 of Computer-Aided Chemical Engineering, chapter 14, Process monitoring and visualization using self-organizing maps, pages 371�384. Elsevier, Amsterdam. Tang, H. and Simula, O. (1996a). The adaptive resource assignment and optimal utilization of multi-service scp. In Proceedings of the 4th International Conference on Intelligence in Networks (ICIN'96), Bordeaux, France, pages 235�240. Tang, H. and Simula, O. (1996b). The optimal utilization of multi-service scp. In Intelligent Networks and New Technologies, pages 175�188. Chapman & Hall. Tryba, V. and Goser, K. (1991). Self-Organizing Feature Maps for process control in chemistry. In Kohonen, T., Mäkisara, K., Simula, O., and Kangas, J., editors, Arti�cial Neural Networks, pages 847�852, Amsterdam, Netherlands. North-Holland. Tryba, V., Metzen, S., and Goser, K. (1989). Designing basic integrated circuits by selforganizing feature maps. In Neuro-Nimes '89. International Workshop. Neural Networks and their Applications, pages 225 � 235. Ultsch, A. and Siemon, H. (1990). Kohonen's self organizing feature maps for exploratory data analysis. In Proc. INNC'90, Int. Neural Network Conf., pages 305�308, Dordrecht, Netherlands. Kluwer. Vapola, M., Simula, O., Kohonen, T., and Meriläinen, P. (1994). Representation and identi�cation of fault conditions of an anaesthesia system by means of the Self-Organizing Map. In Marinaro, M. and Morasso, P. G., editors, Proc. ICANN'94, Int. Conf. on Arti�cial Neural Networks, volume I, pages 350�353, London, UK. Springer. Vesanto, J., Vasara, P., Helminen, R.-R., and Simula, O. (1997). Integrating environmental, technologigal and �nancial data in forest industry analysis. In Proceedings of SNN'97 Europe's Best Neural Networks Practice, Amsterdam, Netherlands. (to appear). 11
Table I: The prediction errors for an independent testing set. Method
MSE Global PCA 1.8858 SOM (8 x 6 map units) 0.8098 SOM (14 x 10 map units) 0.6059 SOM (20 x 14 map units) 0.5668 SOM (8 x 6 map units) and local PCA 0.6785
12
List of Figures 1
Application of the SOM in industrial process analysis: 1) data processing, 2) map training, 3) validation, and 4) visualization. . . . . . . . . . . . . . . . . . . . . . 2 Data processing stages. . . . . . . . . . . . . . . . . . . . . . . . . . . . . . . . . . 3 Updating the BMU and its neighbors towards the input vector x. The solid and dashed lines correspond to situation before and after updating, respectively. . . 4 Di�erent visualizations of the SOM. U-matrix presentation (a), trajectory on top of labeled u-matrix (b), planes representation (c), Sammon's mapping (d) and data histogram on top of a component plane (e). In Figures (a) and (b) the black spots denote map units. . . . . . . . . . . . . . . . . . . . . . . . . . . . . . . . . 5 Prediction of missing components of the input vector. . . . . . . . . . . . . . . . 6 A small change along one measurement axis causes a change in other process parameters. . . . . . . . . . . . . . . . . . . . . . . . . . . . . . . . . . . . . . . . 7 The component planes of the monitored process. . . . . . . . . . . . . . . . . . . 8 The hierarchical map structure. Data histograms from individual low level maps were utilized in the training of the combined high level map. . . . . . . . . . . . . 9 The component planes of the paper machine map: the component names are on the left and the corresponding values in the map units in the middle. The three �rst components have a strong correlation, as do the next two components. . . . 10 The data set histograms of two di�erent geographical regions on the u-matrix of the high level map. The bigger the square, the more mills were projected to that unit on the map. . . . . . . . . . . . . . . . . . . . . . . . . . . . . . . . . . . . .
13
14 14 14 15 15 16 16 16 17 17
Measurement vector (Feature vector) 1 Input measurements
4 2 Output measurements
Process Input
3
Data buffer
Map training and labeling
C
A E
processing
Output D
B
Self-Organizing Map
Process parameters
Figure 1: Application of the SOM in industrial process analysis: 1) data processing, 2) map training, 3) validation, and 4) visualization.
Data acquisition
Preprocessing
Segmentation
Feature extraction
Normalization
Network training
Figure 2: Data processing stages.
X BMU
Figure 3: Updating the BMU and its neighbors towards the input vector x. The solid and dashed lines correspond to situation before and after updating, respectively.
14
HIGH LOAD
IDLE NORMAL OPERATION DISK INTENSIVE
(a)
(b)
rblks/s
wblks/s
usr
sys
intr
wio
idle
ipkts
opkts
(c)
(d)
(e)
Figure 4: Di�erent visualizations of the SOM. U-matrix presentation (a), trajectory on top of labeled u-matrix (b), planes representation (c), Sammon's mapping (d) and data histogram on top of a component plane (e). In Figures (a) and (b) the black spots denote map units. X known values
X
X
X
X X
BMU search
C
A E
?
B
D
? ?
X X
X missing values
BMU
X X X
Self-Organizing Map
X
Figure 5: Prediction of missing components of the input vector. 15
predictions
SOM
Leverage effect caused by small change
Small change
Measurement space
Figure 6: A small change along one measurement axis causes a change in other process parameters. Temperature #1
Temperature #2
Temperature #3
Temperature #4
Temperature #5
Temperature #6
Temperature #7
Temperature #8
Temperature #9
Temperature #10
Temperature #11
Kappa number
Figure 7: The component planes of the monitored process. Mill data Paper machine data Pulp line data
Figure 8: The hierarchical map structure. Data histograms from individual low level maps were utilized in the training of the combined high level map. 16
Figure 9: The component planes of the paper machine map: the component names are on the left and the corresponding values in the map units in the middle. The three �rst components have a strong correlation, as do the next two components.
(a) Scandinavian pulp and paper mills
(b) Chinese pulp and paper mills
Figure 10: The data set histograms of two di�erent geographical regions on the u-matrix of the high level map. The bigger the square, the more mills were projected to that unit on the map.
17