Process Spaceship: Discovering and Exploring Process Views from Event Logs in Data Spaces Hamid Motahari, Boualem Benatallah, Regis Saint-Paul
Fabio Casati, Periklis Andritsos University of Trento Trento, Italy
The University of New South Wales Sydney, Australia
hamidm|boualem|
[email protected] 1.
casati|
[email protected]
INTRODUCTION
Process View 1
Business processes (BPs) are central to the operation of both public and private organizations. A business process is a set of coordinated tasks and activities to achieve a business objective or goal. Given the importance of BPs to overall efficiency and effectiveness, the competitiveness of organizations hinges on continuous BP improvement. In the nineties, the focus of BP improvement was on automation: workflow management systems (WfMSs) and other middleware technologies were used to reduce cost and improve efficiency by providing better system integration and automated enactment of operational business processes. Recently, the focus of business process has expanded to monitoring, analysis and understanding of business processes, and such techniques are incorporated in business process management systems (BPMSs). While BPMSs have enabled enterprises to increase efficiency, new requirements and challenges have emerged that limit their success in modern enterprises: (i) a traditional BPMS usually has a priori definition of BP and expectation of what information and applications will be accessed and how users will explore these sources and services. It relies on a centralized workflow engine as run-time infrastructure. Such a static and centralized definition and expectation is problematic in modern enterprises where there is pressure to support automation of both individual and global activities, and (ii) The execution of BPs in modern enterprises are supported by several heterogeneous IT systems, and process data are stored in a variety of data sources (e.g., logs) in a dataspace [3]. Indeed, a small percentage of processes in enterprises are supported by a workflow system, and hence, having process-related data sitting nicely in a centralized workflow log is rare. Consequently, limiting the analysis to workflow logs, as in BPMSs, means that we can only monitor, analyze, and manage a small fraction of business processes. We believe that it is important to provide support for explicitly defining all sort of business processes spanned over heterogeneous IT systems in the dataspace of an enterprise, and at the right level of abstraction to cater for the needs of various users rather than following the one-view-fits-all fashion of traditional BPMSs. We introduce the notion of process view (playing a similar role to that of database view in databases) that provides an abstract rep-
SOAP SOAP
Process View 2 SOAP
SOAP
. . .
. . .
Process View n
SOAP
SOAP
Information items
Process Instances (correlation)
Process Models
Figure 1: Process space: superimposition of process views over information items in an enterprise resentation of a relevant activity (e.g., ordering goods) in terms of tasks (e.g., order initialization, approval), their relationships (e.g., control flow), and properties (e.g., roles, execution time). Process views can be defined at various abstraction levels to support the activities of a user or of a system. Process views can be used as a basis to query or browse information maintained by heterogeneous data sources and applications, and monitor or trace relevant process executions. They enable answering questions like: which route did that order take? where did it get stuck? who has been working on it? where was the bottleneck? has it been shipped? has it been paid? We also introduce the notion of process space, which refers to the superimposition of process views over heterogeneous IT systems in the enterprise for the purpose of simplifying the understanding of business process execution. A process space is defined on top of information related to the execution of processes in the dataspace of an enterprise, possibly captured by or stored in various information systems, e.g., event logging systems, document management systems, email systems, WfMS, etc. The hard challenge of the definition of a process space is the analysis of information items (e.g., events generated and consumed by various IT systems), and correlating them, i.e., identifying which item belongs to which process execution instance (see Figure 1). For example, we must be able to determine that document xyz.doc and SOAP message ABC are both related to purchase order no. 0327. Without such correlation, no process-based analysis, monitoring and analysis are possible, as it would be like querying a database where relations among tables are not modelled. The goal of this demonstration is to present Process Spaceship, a novel, intuitive, easy-to-use, and efficient tool for semi-automatic definition of a process space over heterogeneous IT systems in an enterprise. In particular, it allows to analyze the information items in an enterprise, correlate them into process instances, and then
Permission to make digital or hard copies of portions of this work for personal or classroom use is granted without fee provided that copies are not made or distributed for profit or commercial advantage and Permission copythis without allthe or part this material granted that copiestobear noticefee and full of citation on the is first page.provided that the copies not made or direct Copyright forare components ofdistributed this wor k for owned bycommercial others than advantage, VLDB the VLDB copyright notice and the title of the publication and its date appear, Endowment must be honored. and notice is given is by To permission of the Very Large Data Abstracting with cthat reditcopying is permitted. copy otherwise, to republish, Base Endowment. otherwise,to or to requires republish, to post on servers to post on servers To or copy to redistribute lists prior specific orpermission to redistribute to lists, fee and/or special permission and/or a fee.requires Requestapermission to republish from: from the publisher, ACM. Publications Dept., ACM, Inc. Fax +1 (212)869-0481 or VLDB ‘08, August 24-30, 2008, Auckland, New Zealand
[email protected]. Copyright 2008 VLDB Endowment, ACM 000-0-00000-000-0/00/00. PVLDB '08, August 23-28, 2008, Auckland, New Zealand Copyright 2008 VLDB Endowment, ACM 978-1-60558-306-8/08/08
1412
SCM Business Service
SCM Process Map
5 NP
PO
SR
Inv Pay
OS ←PurchaseOrder service IS ← Invoice service PS ← Payment service CRS ← Customer Relationship Service
Correlation Conditions
PO ← OS:submitPO Inv ← IS:getInv Pay ← PS:makePayment NP ← CRS:NewProductInfo SR ← CRS:SurveyResult
Log tables
Discovering Correlation Conditions
ψ1 : oID = oID ψ2 : invID = invID ψ3 : pID = pID ψn : oID = OID ∨ ...
Protocol Map
Process Model Inference
Retailer PO
Pay
Inv
Is-part-of
Subsumed-by
Is-part-of 3
2
1 PO
Inv
OS, IS
Back-end
4
Inv
Pay
IS, PS
NP
SR CRS
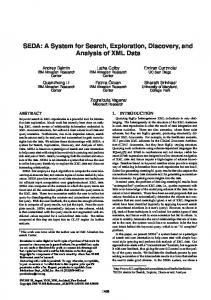
Figure 2: Part of process map of a Supply Chain Management (SCM) process space
Log tables
Disjunctive Conditions Discovery Correlation Conditions Discovery
Refinement operations ψ1 : oID = oID ψ2 : invID = invID ψ3 : pID = pID
Process Model Inference
ψn : oID = OID ∨ ...
Visual Exploration & Refinement
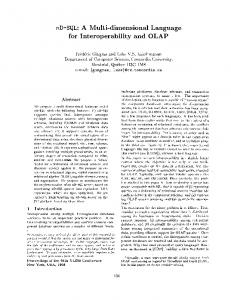
level-wise approach [6] and employing heuristics to further reduce the set of candidate process views to the ones that are potentially interesting for users. The architecture of Process Spaceship is presented in Figure 3. The discovery of process views is performed in the following three steps [7]: correlation of messages, process model inference, and visual exploration and refinement of the discovered process views. Correlation of messages. There are a number of patterns for the correlation of messages in service oriented architecture [7, 1]. We refer to the criteria that specifies if two messages are correlated as a correlation condition. Atomic conditions. In the most common approach, two messages are correlated if they share the same value for a key attribute in both messages (called key-based correlation), or if an attribute, called reference, from the second message, in chronological order, has the same value of an attribute of the first message (this is called reference-based correlation). For instance, we may discover that two messages P O and Inv have the same value for attribute oID, which may lead to infer the key-based correlation condition C1 : P O.oID=Inv.oID. Such correlation conditions are called atomic conditions. Composite conditions. Similar to the concept of composite keys in relational databases, more than one attribute from a given message may be used to correlate it to another message. For instance, both custID and oID may be needed to correlate messages P O and Inv. Hence, we need to define a new condition C2 : P O.cutID= Inv.custID. The correlation condition C3 in this case is defined as the conjunction of C1 and C2 , i.e., C3 = C1 ∧ C2 . Finally, not all messages of a process instance may be correlated using the same correlation condition. For example, in instances of Retailer process view in Figure 2, messages P O and Inv are correlated using condition C3 and messages Inv and P ay using another condition C4 . Hence, the condition C5 that characterizes the instances of this view is defined using the disjunction of these conditions, i.e., C5 = C3 ∨ C4 . Conditions built using conjunctive or disjunctive operators are called composite conditions. Discovering correlation conditions. Discovering correlation conditions presents several challenges. A first challenge lies in the large space of possible correlation conditions that can be built based on combinations of message attributes (atomic, conjunctive and disjunctive conditions). Another challenge is in evaluating the interestingness of a process view, which is the result of using a given condition, for analysis purposes. In [7], we have proposed an efficient algorithm for discovering interesting conditions by adopting a level-wise approach [6] to explore the space of possible conditions starting from atomic to composite ones, and employing two sets of criteria to identify the interestingness of process views: (i) principles such as attribute definition constraints in the content of mes-
PROCESS SPACESHIP OVERVIEW
In this demo, we use as an example problem the case of identifying process views by looking at the messages1 exchanged by Web services in an enterprise. For simplicity, and without loss of generality, we assume a generic log model where each message (and its content) is represented by a tuple in a table whose attributes represent the union of attributes of all messages. Process Spaceship does not deal with the heterogeneity of the enterprise events and data sources (which is the main issue in dataspaces [3]), and relies instead on existing approaches for the integration of event logs from various sources, e.g., ETL tools [11]. Process Spaceship is based on the following design principles: (i) the process map discovery is performed in an iterative process consisting of event correlation, and using the end results (the process views) as a way to refine correlation among events. Indeed, showing process views to users greatly helps users understand if assumptions on the existence of certain correlations are correct (and useful from an analysis perspective); (ii) it organizes the set of candidate process views in a map based on trace inclusion and abstraction relations, that makes it possible for users to navigate the process space and make an informed decision on the process view they wish to use as a basis for the analysis, and (iii) it features a novel algorithm for discovering correlation between events by adopting a 1
Conjunctive Conditions Discovery
Figure 3: The architecture of Process Spaceship
proposes a set of candidate process views (see Figure 1). The different views (which Process Spaceship organizes them in the process map of the enterprise) may correspond to different abstraction levels under which a process can be analyzed, or may correspond to different perspectives over the same set of events. For example, shipment of a set of goods may be related (belong to the same process execution) from the perspective of the warehouse manager, but if the goods are the results of different orders, they are unrelated from the perspective of the sales manager. A process map is essentially a graph that structures process views based on their level of abstractions. Figure 2 shows an example of a process map for a supply chain process. Lower level process views correspond to processes of individual systems and represent finer granular models. As we go higher in the map hierarchy, more aggregated and abstract views, also showing the interactions across various systems in the enterprise, are presented. The discovered process views can then be used to perform various process analysis and tracking tasks (e.g., [2, 4]) and analysis offered by workflow management systems such as FileNet [5] and Oracle BPA [10]. In the following, we give an overview of the Process Spaceship design and techniques, and then focus on what is demonstrated.
2.
Atomic Conditions Discovery
Front-end
Subsumed-by
In the following, we use “event” and “message” interchangeably
1413
• part-of : process X is part-of process Y if any given instance i of X is part-of some instance i0 of Y . An instance i of X is part-of an instance i0 of Y if the messages in i appear in the same order in i0 (e.g., abd is part-of abcd). As another example, the process models of views 1 and 2 are part-of that of Retailer view in Figure 2.
sages as well as set-inclusion properties among instances of views. These allow to avoid computation of redundant (already computed) or not useful views, e.g., the ones that result in empty views, (ii) heuristics defined on the expected average number of messages in process instances in a view, and the number of process instances in the log, and additionally a set of optional user-specified parameters on the desired views such as the system names, the expected duration of process instances, etc. Identifying process instance. In general, given a condition, the set of corresponding process instances in the log can be obtained through posing a recursive query on the pairs of messages in the log. For example, consider the instances of Retailer process view, starting from P O, we have to first find the correlation between P O and Inv performing a query based on C5 , and then issue another query based on C5 to find the correlation of Inv and P ay. We cannot guarantee the acyclicness of correlation relationships between messages in a process instance. Given the limited support for recursive queries on cyclic structures in databases, and for simplicity reason, we formulate the problem of identifying process instances for a given condition as that of identifying connected components in a graph. This problem can be efficiently computed. The graph is built by considering the set of messages in the log as nodes of the graph, and correlation between messages as edges between nodes. Process model inference. Once we have the set of process instances for a given condition, we derive the model of the process which these instances obey. In the current implementation, we focus on the public business processes of services (or their business protocol) and have used the business protocol inference techniques proposed in [9] for this purpose but other process discovery algorithms (e.g., [12]) could be used, as well. Visual process views exploration and refinement. Each correlation condition, leading to grouping of messages into instances, corresponds to a process view (see Figure 1). Process map. There are many possible views, as there are many possible correlation conditions. To facilitate exploration and refinement of results, we organize the discovered process views in a process map. Nodes in the map represent process views. The map is arranged according to the level of granularity of process models, having views with highly correlated instances (e.g., quote and purchase order in Figure 2) at the lower levels, and those with large and possibly more loosely coupled instances (e.g., including all messages related to purchase order and to its payment, or all messages related to the interaction with customer relationship service) at the higher levels. Process view metadata. A process view in the map is characterized by associated metadata that allow users to understand it: (1) statistical metrics: these are metrics on how the log is partitioned into process instances such as the number of instances, the minimum, average and maximum lengths and durations of process instances; (2) conditions: the correlation condition(s) that lead to the process view. Relationships of Process views. The relationships of process views in a process map are identified by considering the relationships between the process models of views (e.g., subsumption, partof) [8]. They are computed based on the analysis of process instances of views during the messages correlation step, hence, no extra computation cost is introduced. We identify the following type of relationship between views in the process map:
Refinement of Process views. Process Spaceship allows users to visually refine the discovered process views by providing operations for adding, removing or (un)hiding the views to/from the process map. In particular, it allows users to (un)hide views to only make visible the desired ones. The delete operation is enabled by selecting a view in the map. It is possible to delete a single view or cascade the deletion to more abstract views related to the selected view. Finally, if a view in the map is selected, the add operation can be used to edit the conditions of a view to discover more specific or more abstract views, or new ones, that are not present in the map. This is visually assisted by providing a wizard that highlights possible attributes of messages with their statistical metadata helping the user in process views definition.
3.
DEMONSTRATION SCENARIO
As a demonstration showcase, we use the messages logs of interactions of Web services in a Supply Chain Management scenario, called SCM, developed based on the scenario of WS-I2 . We demonstrate that the interactions of eight Web services implementing a Retailer system (including quotation, order management, invoice, shipping, and payment subsystems), customer relationship management (CRS), and production (not shown in the map of Figure 2) systems are captured using HP SOA Manager [4]. The system is implemented as a set of Eclipse plugins in Java 5.0, using PostgreSQL 8.2 as the database management system, Apache Axis 1.4 as SOAP implementation engine, and Apache Tomcat 5.5.9 as Web application server. In general, an actor in the enterprise, called process architect, is responsible for building required process views. In this demonstration, we show how Process Spaceship simplifies the job of process architects by providing a simple and intuitive interface for process views discovery, exploration and refinement. We demonstrate that Process Spaceship can be operated in two modes: automated, or semi-automated (supervised). Automated mode. In the automated mode, the architect instructs the tool (using buttons in the top-left in the screenshot of Figure 4(a)) to analyze the interactions and discover the set of potentially interesting process views. The system takes a conservative approach in this mode favoring the recall over the precision in discovering views. The discovered process views are organized in a process map (the top-right panel in Figure 4(a)). The corresponding conditions are also listed in the left panel to facilitate the exploration based on both the map and the conditions. If a given view is selected, the right-bottom panel in Figure 4(a) shows the process model of the view to provide a visual understanding of the underlying process of the view. We will not discuss the details of the discovered views for SCM and their relationships here, but naturally explain in the demonstration. Process map exploration and refinement. Nodes in the map are labeled with the names of systems that they are representing. This allows to quickly identify the views of interest in the map. We demonstrate two systematic, complementary, approaches for the exploration of the process map. That is, the architect may start from one of the bottom level views, corresponding to concrete views, or
• subsumption: process X is subsumed by process Y if the set of instances supported by X is a subset of those supported by Y . For example, the process model of CRS and Retailer views are subsumed by that of SCM in Figure 2;
2
1414
Web services interoperability organization, www.ws-i.org
(a) Process Map Perspective - Showing the process map discovered (b) Process View Perspective - showing a process view and associfor SCM process space ated metadata for SCM Figure 4: Screenshots of Process Spaceship: the Process Space Discovery System alternatively the highest view, which corresponds to the process of the whole enterprise. Then, using the links between views in map, she can navigate through process views. Upon selection of a view in the map, related views are highlighted. We will illustrate that zoom-in and zoom-out operations in the map are realized by following the links between process views, from a given process view, downwards or upwards to access more concrete or more abstract views, respectively. We show that in addition to the highest or the lowest level views, some middle level are also interesting (e.g., in case of SCM, the process view corresponding to Retailer system). The architect may decide to hide the other middle level nodes, as they may correspond to partial views of Retailer process, e.g., showing only interactions of payment and shipping subsystems, probably because these may not be frequently used. We also illustrate simplicity of refinement of the discovered process map by showing how visual operators can be used for this purpose. The architect can also use the tool to augment process views with comments that might be useful for end-users. Process map metadata. We show how the metadata can be used in identifying relevant or non-relevant process views in the map. When a view is selected, the corresponding metadata are displayed in the bottom-right frame. Alternatively, the architect can switch to a process view centric perspective, shown in Figure 4(b), where all metadata is presented in a single environment. In this perspective, the top and bottom frames show immediately related views (immediately higher and lower views in the map), and their relationships with the current view. These allow to navigate the map, while focusing on understanding a given view. To provide more insight on a process view, top-k frequent process instances of a view are also available (the top-right frame in Figure 4(b)). Supervised mode. In the semi-automated mode, we illustrate how the architect can supervise the process view discovery. We show that the tool can capture the architect’s knowledge in terms of expected correlation pattern (key-based or reference-based), the average number, durations or lengths of process instances for various systems. This information is used to effectively explore the set of possible process views. We demonstrate how the architect can benefit from the metadata (including statistical meta-data, process models, and coloring schemes) presented during, before and after each step to direct the exploration direction towards process views of interests. The metadata helps the architect in making informed decisions, e.g., whether to keep a condition for consideration or
to remove it. We show that this interactive discovery of process views allows to effectively find interesting process views and to avoid discovery of un-related views. We demonstrate that using Process Spaceship saves considerable amount of time and efforts when compared to what should be done without such tool support in modern enterprises. We conclude the demonstration by briefly presenting experimental results of applying the tool on a number of real-world and synthetic datasets that demonstrate the viability (in terms of precision and recall) and efficiency (in terms of search space pruning and execution time) of the approach on both synthetic and real-world service logs. We believe that integrating this tool with available process analysis and tracking tools (e.g., [5, 2, 4, 10]) greatly simplifies the job of end-users since using the map and the process view centric perspective make it easy to locate the desired views for subsequent analysis.
4.
REFERENCES
[1] A. Barros and et al. Correlation patterns in service-oriented architectures. In FASE, 2007. [2] C. Beeri and et al. Query-based monitoring of BPEL business processes. In SIGMOD, 2007. [3] M. Franklin and et al. From databases to dataspaces: a new abstraction for information management. SIGMOD Rec., 34(4), 2005. [4] HP. Management software: SOA Manager, Business Process Insight. In www.managementsoftware.hp.com. [5] IBM. FileNet enterprise content management solutions. In www.filenet.com. [6] H. Mannila and H. Toivonen. Levelwise search and borders of theories in knowledge discovery. DMKD J., 1(3):241–258, 1997. [7] H. Motahari and et al. Process Spaceship: Discovering process views in process spaces. Technical Report UNSW-CSE-TR-0721, The University of New South Wales, Australia, Dec. 2007. ftp://ftp. cse.unsw.edu.au/pub/doc/papers/UNSW/0721.pdf. [8] H. Motahari and et al. ServiceMosaic: Interactive analysis and manipulation of service conversations. In ICDE, 2007. [9] H. Motahari, R. Saint-Paul, B. Benatallah, and F. Casati. Protocol discovery from imperfect service interaction logs. In ICDE, 2007. [10] Oracle. Oracle Business Process Analysis. In www.oracle.com/ technologies/soa/bpa-suite.html. [11] E. Rahm and et al. Data cleaning: Problems and current approaches. IEEE Data Eng. Bull., 23(4), 2000. [12] W. van der Aalst and et. al. Workflow mining: a survey of issues and approaches. DKE Journal, 47(2):237–267, 2003.
1415