Financial Institutions Center
Process Variation as a Determinant of Service Quality and Bank Performance: Evidence from the Retail Banking Study by Frances X. Frei Ravi Kalakota Leslie M. Marx 97-36
THE WHARTON FINANCIAL INSTITUTIONS CENTER
The Wharton Financial Institutions Center provides a multi-disciplinary research approach to the problems and opportunities facing the financial services industry in its search for competitive excellence. The Center's research focuses on the issues related to managing risk at the firm level as well as ways to improve productivity and performance. The Center fosters the development of a community of faculty, visiting scholars and Ph.D. candidates whose research interests complement and support the mission of the Center. The Center works closely with industry executives and practitioners to ensure that its research is informed by the operating realities and competitive demands facing industry participants as they pursue competitive excellence. Copies of the working papers summarized here are available from the Center. If you would like to learn more about the Center or become a member of our research community, please let us know of your interest.
Anthony M. Santomero Director
The Working Paper Series is made possible by a generous grant from the Alfred P. Sloan Foundation
Process Variation as a Determinant of Service Quality and Bank Performance: Evidence from the Retail Banking Study 1
May 1997 Abstract: Conventional wisdom in retail banking states that firm performance is dependent on higher average process performance. This paper refutes conventional wisdom and provides empirical evidence, which demonstrates that low process variation contributes significantly to firm performance. More specifically, this paper examines the effect of process variation, caused by process variability, on service quality and financial performance, as measured by customer satisfaction and price-to-earnings ratio. This paper estimates process variation and reveals large variation in processes, reflecting large variation in firm strategy and process design. The data is from the Wharton Financial Institution Center Retail Banking study of fifty-seven of the largest bank holding companies (BHC) in the United States. Furthermore, this paper empirically tests under which conditions process variation impacts customer satisfaction and firm performance. This study provides support for the hypothesis that firms should systematically invest in process improvement and organizational capabilities that decrease process variation across a ‘basket of processes’ rather than investing in improvements that make a firm ‘best of the breed’ for a single process.
1
Frances X. Frei, Ravi Kalakota and Leslie M. Marx are at the William E. Simon School of Business, University of Rochester, Rochester, NY 14627, (716) 275-1079,
[email protected]
1. Introduction Competition, processes, and technological improvements in delivery systems have resulted in a gradual shift in strategic focus from price to service quality in the retail banking industry. Continuous improvement in service quality is considered a requirement in the financial services industry at a time when it is undergoing an extraordinary rate of change in organization, products, and delivery methods. Supporting multiple service delivery channels with state-of-the-art technology is now a key competitive issue for financial service institutions. This paper presents an empirical examination of the magnitude of service process variability and its impact on service quality and a firm’s financial performance. Service quality has become an essential part of organizational success due to increased customer expectations and customization of services in many markets. In fact, even the definition of service quality is changing. Good service quality used to mean that the output was made to conform to the specifications set by the process designers. Today, the concept of service quality is evolving to mean uniformity of the service output around an ideal (target) value determined by the customer. However, when the dimensions or performance of a service output exceed allowable limits, the variation needs to be identified so the problem can be corrected. In many situations, product variation within a service process is considered acceptable. Traditionally, statistical methods have been used extensively in manufacturing to solve product variability problems. The problems associated with process variation have been well known in manufacturing1. The solutions that have been adopted to minimize process variability include increased use of automation for eliminating operator intervention during system set-up and system operation. However, before applying quality control methods developed in manufacturing to service operations, more fundamental questions need to be addressed: How does process variation in services affect customer satisfaction? How do process variations affect a firm’s financial performance? The objective of this research is to provide a better understanding of process variation and its impact on firm performance by using data from the retail banking study undertaken at the Wharton Financial Institutions Center (Frei 1996). It is imperative to point out that elimination of unnecessary process variation is a necessary, but not a sufficient condition, for improving service quality. It is not sufficient because high levels of inherent variation will continue to exist due to other factors and must be managed, even in the best of all possible scenarios. Evidence of Process Variation in Services Four major factors contribute to the substantial variation in the delivery of services. Not all four of these factors apply to all services, nor is this an exhaustive list, but these four factors represent major explanations for the existence of process variation in services: heterogeneous customers with different service expectations; lack of rigorous policies and processes; high employee turnover; and 1
Bohn (1995) describes one such application in semiconductor manufacturing.
2
nature of customization. Due to the co-productive nature of most customers, the presence of heterogeneous customers usually introduces variation into the service delivery. The principal reason for this is that a component of the production process (the customer preferences and expectations) is different for each instance of service delivery. For example, one customer may want fast service with no idle chatter and another customer may want to have a discussion amidst service delivery. Serving these customers will likely require different amounts of time, and thus will result in higher variation. Aside from variation in customers, there may also be process variability. Services, typically, do not apply as much rigor to the definition of each and every step of the production process. In fact, it is not uncommon for upper management not to know the details of a particular process and for there to be no institutional knowledge of process designs (Frei and Harker 1995). In assembly plants, the entire process must be mapped out and adhered to in order for production to occur. The same is not true for services and thus, in instances in which there are no formal policies and procedures, there is often more variation. For example, at McDonalds, there are very specific policies and procedures and thus there is not much variation in the delivery of a specific order. McDonalds has designed their processes and product offerings (e.g. the combo-meals) for consistent, fast delivery. On the other hand, although there are some general guidelines about opening a checking account (e.g., verify identification), the service is delivered with server experience along with input from the customer. Servers often change the process depending on their level of expertise, proficiency, and past experience. Thus, we would expect far more variation in the delivery of financial services than in the delivery of lunch orders from McDonalds. In service delivery jobs, particularly the low-wage jobs, there is often high employee turnover. One difficulty caused by this is that learning often occurs by trial and error, and by the time employees become more efficient and consistent at service delivery, they leave the firm. Often, in the highturnover jobs we see service firms trying to implement policies and procedures that are more rigorous in order to speed up the training component of the job (e.g. McDonalds). A criticism of single-phased models that deal with variability in services is that they do not take employee turnover into account thereby requiring more stochastic modeling to analyze the interactions between delivery systems and managerial decision rules. Finally, the nature of customization (e.g., relationship banking), which is a facet of many financial services, is that the service is produced to meet the needs and expectations of each individual customer. As the customers change, so too do the needs and expectations of the service delivery experience. Customization is an information intensive activity yet, many institutions often lack the integration necessary to access the necessary information. Thus, a large significant determinant of service delivery variation is attributable to the variation in technology support for capturing customers’ needs and expectations. The Impact of Process Variation on Service Quality Conventional wisdom holds the view that as long as all the inputs to a service process (human, material, machine, method, management, environment, and measurement system) remain ‘constant’,
3
the service output will always be consistent in their characteristics, e.g., always the same throughput. In reality, no matter how alike the inputs are, the service output varies. It is important to understand this ‘natural’ variation of the service outputs (or process variation) in order to estimate the impact on customer satisfaction and firm financial performance. Before going further, it makes sense to ask: Is there a relation between process variation, the variation of a process performance statistic, and customer satisfaction? A large process variation will result in more service outputs close to the boundary of the range of acceptable customer specifications. Or, it will result in service outputs above or below customer specifications if the service product is not carefully measured and monitored. The reduction of process variation is important for three reasons. The first is due to the economic loss that can result from customer dissatisfaction. Increasing customer dissatisfaction translates into lost revenue due to loss of customer goodwill, product replacement and rework, and lost potential sales through a negative perception of service quality. The second reason is that not to reduce process variation would preserve and institutionalize the practices of reactive process repair, root cause analysis, and rework presently required to bring a service output within specification limits. The third reason is to help actively manage day-to-day operations. Assuming the process has been designed so that its average output is at the ideal (‘target’) value, it follows that not every output will be at that level. How much the service output will vary depends upon the amount of natural variability. If an output varies by more than might be expected from its natural variability, the inference is that something has happened to change the process away from the target value to cause it to go ‘haywire’. That ‘something’ is referred to as a ‘special’ (or an ‘assignable’) cause of variation. The assignable cause of variation must be eliminated to bring the process back to where it was, centered on the target value. The principal task of management is to detect, quantify, and manage process variation to keep the outputs near the target value. The rest of the paper is organized as follows. Section 2 describes the data sample and Section 3 presents a model in which firm performance increases as the variation in its service quality decreases but is not affected by improvements in average service quality. The results are presented in Section 4 and Section 5 summarizes the conclusions and directions for future research.
2. Data Sample The data sample used in this paper is a result of the retail banking study undertaken at the Wharton Financial Institutions Center. The retail banking study was aimed at understanding the drivers of competitiveness in the industry, where competitiveness means not simply firm performance but the relationship between industry trends and the experiences of the retail banking labor force. In the exploratory first phase of a study, open-ended and structured interviews were conducted with industry informants. The team interviewed top executives, branch managers, human resource managers, information technology managers, retail bank employees, and industry consultants. The first phase featured site visits to thirteen retail bank headquarters, and interviews with numerous other managers and employees in remote and off-site locations. The interviews began with general questions, and the questions increased in specificity as the research progressed. In this phase of the
4
study, the team collected data using two waves of structured questionnaires in seven retail banks. The team’s analysis of the data in these questionnaires was then presented to management teams in six of the seven banks, and used as the basis for the second phase, a large-sample survey. The second phase of the study entailed a detailed survey of technology, work practices, organizational strategy, and performance in 135 U.S. retail banks. The process began by compiling a list of the 400 largest bank holding companies (BHCs) in America at the beginning of 1994. Merger activity, and the fact that a number of BHCs had no retail banking organization (defined as an entity that provides financial services to individual consumers), reduced the possible sample to 335 BHCs. In the end, the survey gained the participation of banks holding over 75% of the total assets in the industry in 1994. Participation in the study was confidential, but not anonymous, enabling the team to match survey data with data from publicly available sources. Participation in the study required substantial time and effort on the part of organizations. Therefore, commitment to participation was sought by approaching the 70 largest U.S. BHCs directly, and, in the second half of 1994, the participation of one retail banking entity from each BHC was requested. Fifty-seven BHCs agreed to participate. Of these, seven BHCs engaged the participation of two or more retail banks in the BHC, giving us 64 retail banks in total. Multiple questionnaires were delivered to each organization in this sample. Questionnaires ranged from 10 to 30 pages, and were designed to target the “most informed respondent” (Huber and Power 1985) in the bank in a number of areas, including business strategy, technology, human resource management and operations, and the design of business processes. A telephone help line was made available to respondents who were unsure of the meaning of particular questions. Questionnaires to four top managers were delivered: the head of the retail bank, the top finance officer, the top marketing officer, and the top manager responsible for technology and information systems. These banks received questionnaires for one manager of a bank telephone center, and for one branch manager and one customer service representative (CSRs) in the bank’s ‘head office’ branch, defined as the branch closest to the bank’s headquarters. In addition, an on-site researcher gathered data about all business process flows in the head-office branch. Identical questionnaires were mailed to five more branch managers; the instructions to the bank were to choose the sample branches so that if possible data was received from two rural, two urban, and two suburban branches. Questionnaires were also mailed to CSRs in those branches. In these questionnaires, the CSRs themselves mapped processes associated with home equity loans, checking accounts, certificates of deposit, mutual fund accounts, and small business loans. In order to facilitate the creation of process maps (Shostack 1987, Kingman-Brundage 1992) via the mailed survey, a worksheet was developed for the CSRs to fill out. These worksheets list the majority of potential steps required in the process so that the CSR need only indicate the order of the step, the person responsible for its execution, the type of technology involved, and the amount of time the step takes (Frei 1996). Adequate space was provided for the addition of steps unique to an institution. In late 1994, survey questionnaires were mailed to top executives of the 265 next largest BHCs, and followed with a telephone call requesting the participation of one of their retail banking organizations. Sixty-four of these BHCs agreed to participate in the study, and four of these
5
engaged the participation of two or more retail banks in the BHC, so that a total of 71 participating retail banks in the mailed survey. For this group of banks, the head of the retail bank was surveyed, and many of the questions directed to the other top managers were consolidated into this survey. Prior interviews had suggested that for banks of this size, the head of retail was able to answer this broader set of questions accurately. For this sample, questionnaires were mailed to one telephone center manager, one branch manager, and one CSR in the head office branch. The telephone help line was also available to respondents in this sample. All together, the entire survey of retail banking covers 121 BHCs, and 135 banks, which together comprise over 75% of the total industry, as measured by asset size. The scope and scale of this survey make it the most comprehensive survey to date on the retail banking industry. For this paper, we analyzed the set of retail banks for which we had complete data on process performance, service quality, and financial measures. This reduced our sample to forty-five retail banks. Process Performance Measures The process performance measures used in this paper rely on the ability to grade a firm for each individual process relative to the other banks in the study. That is, for each firm there are grades for up to eleven processes. The methodology used to grade the processes is described in Frei and Harker (1996), which demonstrates an extension of DEA to analyze the relative efficiency of a given business process across multiple organizations. After determining the process-level efficiency score for each institution, the grade is determined by normalizing the efficiency scores to a scale of 0% to 100%, with the efficient banks scoring 100%. The collection of this data is part of the work undertaken by the retail banking study at the Wharton Financial Institutions Center. One aspect of the data collection involved collecting data on eleven processes that represent the bulk of the work that occurs at a typical retail bank’s branch. These processes span five products and represent opening of accounts, error correction on the part of the bank, and error correction on the part of the consumer. For a complete explanation of the retail banking study, see Frei, Harker, and Hunter (1997). Before we present our analysis, we need a formal description of a production process. A production process is the way in which work is organized and inputs are consumed in order to accomplish a specified task of producing outputs. For example, a process might be the way in which a checking account is opened. The inputs consumed are the labor (platform representative) and capital (information technology), and the outputs produced are the opening of the account in a way that is convenient for the customer (in terms of customer time involved and when they have access to their money). In order to understand, for example, the process of opening a checking account, we need to know the steps involved, the order of these steps, the way in which people are involved, and the role of technology. For our analysis, we consider looking at a process as the transforming mechanism from inputs to outputs as well as to identify the critical design issues that lead to greater value.
6
Before determining the efficiency with which processes transform capital and labor into value for the customer and the bank, it is important to understand the role process design has on value creation. That is, processes can be designed to explicitly affect one or more value measures. For example, in order to improve the convenience of a process, the design can be altered to remove or shorten as many steps as possible. However, these adjustments might be at the expense of other value measures. Alternatively, a process can be designed to consume the least inputs (cost-focus) even at the expense of decreasing market penetration and hence, revenue. The point of this discussion is that process design in and of itself can affect value creation. It is the intent of this section to determine the extent to which process performance affects value creation - that is, the combination of the design and the efficiency with which that design transforms inputs to outputs. For each of the eleven processes in this study, we have performed the efficiency analysis described in Frei and Harker (1996). This analysis determines the efficiency with which each bank produces a set of outputs from a set of inputs. The categories of inputs and outputs for each process are shown in Table 3. For each process, we have ranked the banks according to their efficiency score and thus, have up to eleven rankings for each of the banks. The results of this individual process analysis are then aggregated using the methodology described in Frei and Harker (1997) to create an institutional aggregate process efficiency score. The aggregated score is used herein to analyze the role of process efficiency in describing performance of a bank. As can be seen in Table 1, the outputs for each process are convenience measures (time) and the inputs are related to cost (labor time and technology functionality). These are the only two valuecreation measures represented in our individual process analysis, as they are our only process-level measures. The other value-creation measures, such as customer satisfaction and financial performance, are bank level data and thus, will be correlated with the aggregate process performance at the end of this section. In order to explore the relationship between process performance and a firm’s overall financial performance, a measure of this financial performance needs to be established. The most common metrics for financial performance in the literature are return-on-assets and return-on-equity. However, both these metrics are susceptible to accounting methods in any given year and thus we will use price-to-earnings ratio to demonstrate the financial performance of a firm2. The customer satisfaction measures used in this survey were acquired from the Claritas CustomerSatisfaction study for the retail banking industry. Customer satisfaction is measured on a scale of one to five with one being the most satisfied. For details of the measures and specific questions, see the 1996 National Consumer Financial Services Satisfaction Study.
2
Through extensive field interviews we learned that banks typically did not believe their competitors return on asset and return on equity metrics were calculated using common assumptions and thus price-to-earnings rations were thought of as a better metric.
7
Table 1. Summary of Process Inputs and Outputs Open Checking Account
Inputs Activity Time Checking IT Functionality
Outputs Customer Time Check Cycle Time ATM Cycle Time
Open Small Business Loan Account
Activity Time SBL IT Functionality
Customer Time Approval Cycle Time Money Cycle Time
Open Certificate of Deposit
Activity Time CD IT Functionality
Customer Time
Open Mutual Fund
Activity Time MF IT Functionality
Customer Time
Open Home Equity Loan Account
Activity Time HE IT Functionality
Customer Time Approval Cycle Time Money Cycle Time
Correct A Checking Double Post
Activity Time Checking IT Functionality
Customer Time Correct Cycle Time
Correct A Home Equity Loan Double Post
Activity Time HE IT Functionality
Customer Time Post Cycle Time Notify Cycle Time
Correct A Small Business Loan Double Post
Activity Time SBL IT Functionality
Customer Time Post Cycle Time Notify Cycle Time
Redeem A Premature Certificate of Deposit
Activity Time CD IT Functionality
Customer Time Redeem Cycle Time
Stop Payment on A Check
Activity Time Checking IT Functionality
Customer Time
Replace A Lost ATM Card
Activity Time Checking Tech Functionality
Customer Time Replace Cycle Time
8
3. Model The financial performance of a financial service institution is driven to a large extent by its ability to attract and retain customers. Customers increasingly have alternatives from which they can choose. We are interested in whether a customer’s decision whether to stay with her current service provider might be more sensitive to variability of service than the level of service quality. In this section, we present a simple model in which consumers learn about the mean and variance of service quality but in which only information on the variance of service quality affects a decision to switch providers. If consumers behave as Bayesians and believe all firms have the same average service quality, then they switch firms only after experiencing sufficiently volatile service quality. There are a number of ways to view a customer's choice of financial service firm. Assume customers choose so as to maximize expected utility. If the mean and variance of each firm's service quality is known, then customers choose once to optimize and then never switch. Some customers, if they are risk averse with respect to quality, may choose firms with lower average quality if their quality has lower variance. A more interesting view of customer choice has some uncertainty with respect to the mean and variance of firms' service qualities. In this type of environment, customers have to learn about firms over time. Because an individual customer is herself an important input to the delivery of services, we expect a given firm to be able to service certain customers better than others. Thus, customers may have to rely on their own experiences rather than summary statistics or the experiences of others to learn about the mean and variance of the quality a particular firm can offer to her. We can think of customers as learning about the mean and variance of a firm's service quality as the customer gains experience with the firm. In a learning environment such as this, customers will initially have prior beliefs regarding firms' quality distributions and will update those beliefs with experience. In some cases, experience with one firm may provide information about the service quality in the industry as a whole, or it may only provide information about the service quality of the specific firm involved in the experience. If the service of each firm has no (or low) variance (and switching costs are low), then a customer can simply sample each of the firms and then choose the one with the highest observed quality. However, the firms' service quality levels have substantial variance, then customers may never learn enough to determine which firm has the highest average quality. We consider an environment in which all firms have the same average quality, which is unknown to the customers, but firms have either high or low quality variance. In this case, customers will only switch firms if their experience with the firm shows sufficiently high variance. Information regarding the mean service quality does not affect customers' switching decisions. In this environment, customers would not switch after a sequence of bad experiences at a firm, but they would switch after experiencing highly variable service quality.
9
Proposition. In an environment in which all firms have the same average quality, but either low or high quality variance, both of which are unknown to the customers, customers will only switch firms if their experience with a firm shows sufficiently high variance. Proof. Assume there are a large number M of firms offering banking services. In each period, a consumer must choose which firm’s services to buy. Assume that consumers have preferences over the quality of service and its cost given by u( q i ) − p i , where i ∈ M and q i is firm i’s quality and p i
is firm i’s price. We assume u(⋅) is increasing and concave. In period t, consumers choose a firm to solve
[
]
max Et u( q i ) − p i , i ∈M
where the expectation is conditional on the consumers observed history prior to period t. Note that superscripts denote the firms and subscripts denote time. Assume that service quality is distributed according to F(⋅; m , s ) . Assume that consumers initially
[ ]
believe that all firms have the same unknown mean service quality m ∈ m , m but that the firms differ in the variability of service quality. The prior belief on m is given by the distribution G1 . For an untried firm, consumer’s beliefs are that the standard deviation of a firm’s quality is s l with
probability r1 and s h with probability (1 − r1 ) , where s h > s l . For fixed m, we assume that
F (⋅; m , s l ) second-order stochastically dominates F (⋅; m , s h ) 3. Initially, the expected utility from a
[
]
randomly chosen firm is E1 u( q i ) − p i .
In this environment, at t=1 a consumer will randomly select a firm from the set M, say, firm 1. If a consumer purchases from firm 1 in periods t=1,2,...,T-1, then at t=T, the consumer will use the observed history of quality to update her beliefs about whether firm 1’s service quality has standard deviation s l and her beliefs about the mean service quality of all the firms m. We denote the consumer’s updated beliefs on m by GT and her updated beliefs on the probability that the standard deviation of firm 1’s service quality is s l by rT . The consumer switches to firm i ≠ 1 in period T if
[
]
[
]
ET u( q1 ) − p1 < ET u( q i ) − p i . Since
m ∞ ∞ 1 E T u( q ) − p = rT ∫ ∫ (u( x ) − p )dF ( x; y , s l )dGT ( y ) + (1 − rT )∫ ∫ ( u( x ) − p 1 )dF ( x; y , s h )dGT ( y ) m −∞ m −∞
[
1
1
]
m
and
3
This holds, for example, for symmetric distributions.
10
m ∞ ∞ i E T u( q ) − p = r1 ∫ ∫ (u( x ) − p )dF ( x; y , s l )dGT ( y ) + (1 − r1 )∫ ∫ (u( x ) − p i )dF ( x; y , s h )dGT ( y ) m −∞ m −∞
[
i
i
m
]
the consumer switches if and only if m
∞ − p + p + ( rT − r1 ) ⋅ ∫ ∫ u( x ) dF ( x; y , s l ) − dF ( x; y , s h ) dG( y ) < 0 . m −∞ 1
i
(
)
Assuming equal prices for all firms, the consumer switches if and only if m
∞ ( rT − r1 ) ⋅ ∫ ∫ u( x ) dF ( x; y, s l ) − dF ( x; y, s h ) dG( y ) < 0 . m −∞
(
)
(1)
Note that for concave utility function u , by second-order stochastic dominance, the term in (1) in square brackets is positive. So, the consumer switches if and only if rT < r1 . Therefore, the consumer’s decision to switch depends only on her beliefs about the variability of her current firm’s service quality. If the history of observed service quality ever leads the consumer to believe that her current firm’s service quality has standard deviation s l with probability less than r1 , then the consumer switches. In other words, if a consumer’s past experiences ever lead her to believe that it is sufficiently likely that her current firm has volatile service quality, then she will switch. Information regarding the mean of service quality never causes the consumer to switch. Thus, we must rely on the data to distinguish between the usual hypothesis that customers give preference to high quality and the competing hypothesis that the variability of service quality is primary in determining customer behavior/choices. As will be shown in the next section, the data are more consistent with the latter hypothesis.
4. Results In the previous section we presented a model that demonstrated that in an environment in which all firms have the same average quality, which is unknown to the customers, customers will only switch firms if their experience with the firm shows sufficiently high variance. That is, our model shows that customer behavior is affected by service variability more so than service quality. In this section, we give further evidence to this result by presenting data that also indicates that it is process variation, rather than process quality, that drives customer satisfaction and ultimately a firm’s financial performance. Does Process Efficiency Matter? While there is a significant body of theoretical (Morroni, 1992) and anecdotal (Davenport and Short, 1990) evidence on the importance of process management, there is very little statistical evidence that
11
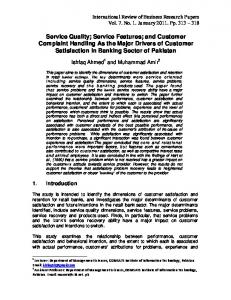
process management matters with respect to the ‘bottom line’ of the institution. We will show that, while no individual process is correlated with firm performance, the aggregate measure of process performance affects firm performance. More importantly, the most significant finding is that while aggregate process performance is correlated with financial performance, it is not correlated with customer satisfaction. The process performance measure associated with both firm financial performance and customer satisfaction is the measure of variation across processes. We have found that if processes are managed in a consistent way, then both financial performance and customer satisfaction are improved. By consistent process management, we mean that the performance of individual processes within a firm are similar to one another and thus provide a consistent service offered to the consumer. We first consider the relationship between the process efficiency of a bank, as measured by its aggregate process performance and the financial performance of the institution. Using the priceearnings multiple for each institution as a representative measure of financial performance, Figure 1 shows that there is a positive relationship between the banks’ process performance and financial performance. That is, as aggregate process performance improves, so does financial performance. Of course, there are two explanations for this relationship. First, it may be the case that better process performance does indeed drive financial performance. The other explanation is that firms that are financially secure have the resources to be better process performers. While this simple correlation in Figure 1 cannot answer this question, this evidence, in concert with the vast theoretical and anecdotal evidence, strongly suggests that the alignment of production processes with the firm’s business strategies is a crucial decision for management. Although the correlation between process performance and financial performance is not overwhelming (R2 of 7.2%) there seems to be a positive relationship between the two as shown in Figure 1. What drives this relationship? The service management literature (Rust and Metters, 1996) suggests that the consistency of the service offered to the consumer may be more important than its absolute value. The bank, like any organization, is a bundle of production or service delivery processes. Consumers are concerned with the quality of the collection of service processes they are involved in; no one process matters. Thus, it may be that consistency (i.e., the alignment) of process performance is more important than performance in and of itself. To address this hypothesis, consider the issue of process variability; i.e., the variability of the bundle of processes that are offered to the customers of the institution. R2 7.2% p-value 0.06
12
10 Price-Earnings-Multiple 8
6
0.2
0.4
0.6
0.8
Aggregate Process Performance
12
Figure 1. Process Performance and Financial Performance
Process Variation When an institution performs a set of processes for a customer, there is undoubtedly going to be variation in regards to the level of inputs consumed and the value provided to the customer. For example, it requires more labor and customer’s time to open a checking account than it does to redeem a certificate of deposit. For our analysis, we determined the efficiency with which each bank performed eleven processes and assigned them a performance grade for each. Each individual performance grade is a measure of the bank’s efficiency relative to all other banks that performed that process. We then developed a method to aggregate these eleven performance grades into a single performance measure, which represents a bank’s aggregate process performance (Frei and Harker 1997). However, as discussed above, the variability of the process performance may be more important than individual or average performance. That is, consumers desire consistency and thus, the bank must align its various delivery processes to meet the consumer’s needs. Therefore, we define process variation as the variation in performance across the eleven individual process performance scores for each bank. It is the variation that we have found to be the best predictor of overall firm performance. In many situations, a certain amount of product variation within a service process is normal and typically considered acceptable. For example, a bank may have efficient processes for opening new customer accounts, but may be bad, both in terms of costs and in terms of customer satisfaction, in correcting problems that arise during the relationship with the customer. Thus, the fundamental issue is whether process variation can explain why process performance is related to financial performance. In other words, which is more important for a bank, to do a few things well and, hence, to do other things not so well, or to provide reasonably consistent set of service delivery processes to the customer? The underlying question is to determine what ultimately matters, occasional excellence or consistency. To address this question we consider the data of Section 2 and the analytical model of Section 3 and look at the relation of process variation with customer satisfaction and financial performance. From Figure 2, we see that process variation is correlated with financial performance (price-earnings ratio) in much the same way as aggregate process performance was correlated to financial performance. That is, firms with lower variation (more consistency) tend to have better financial performance (higher price-earnings ratio). In addition, while there is not a relation between process variation levels and service quality overall, there is a significant correlation between these measures for firms with good, consistent processes (see Figure 3). Banks with good processes are those banks with better than average average-process grade, whereas banks with consistent processes, are those banks with lower than average process variation. Thus, for banks with good consistent processes, low process variation is correlated with high customer satisfaction. This result is consistent with the belief in the service quality literature (Rust, Zahorik and Keiningham, 1995) that firms who set expectations and consistently meet them
13
have better customer satisfaction. This result demonstrates that it is not enough to simply deliver expected service, but that the consistency of service also matters in terms of customer satisfaction.
R2 6.9% p-value 0.05
12
10 Price-Earnings Multiple 8
6
0.225
0.300
0.375
Process Variation
Figure 2. Process Variation and Financial Performance
R2 21.8% p-value 0.05
2.8
2.4 Customer Satisfaction 2.0
1.6
0.175
0.200
0.225
0.250
Process Variation
Figure 3. Process Variation and Customer Satisfaction for
Above Average Aggregate Process Performance
Effect of Size on Firm Performance Much of the work on retail banking is structured around the assumption that large and small banks are different ‘animals’ and thus should be treated as such. While this paper supports the assumption that large and small banks often do have different performance, it attempts to indicate the causes for the difference in performance and to identify the areas in which lessons can be learned. The 14
following three observations indicate when firm size is related to variation in process performance and firm performance. Smaller banks have lower process variation than larger banks. As evidenced by Figure 4, there is a significant correlation between process variation and asset size. That is, the smaller banks tend to have less process variation.
200000000
R2 10.4% p-value 0.02
150000000 Asset Size 100000000
50000000
0.150
0.225
0.300
0.375
Process Variation
Figure 4. Asset Size and Process Variation Scatter-Plot
Smaller banks have better firm financial performance than larger banks. As evidenced by Figure 5, there is a significant correlation between financial performance (price-earnings ratio) and asset size. That is, the smaller banks tend to have better financial performance.
200000000
R2 10.6% p-value 0.03
150000000 Asset Size 100000000
50000000
6
8
10
12
Price-Earnings-Multiple
15
Figure 5. Asset Size and Financial Performance Scatter-Plot
Smaller banks have higher customer satisfaction measures than larger banks. As evidenced by Figure 6, there is a significant correlation between customer satisfaction measures and asset size. That is, the smaller banks tend to have better (lower) customer satisfaction measures. R2 8.3% p-value 0.04
120000000
90000000 Asset Size 60000000
30000000
1.50
1.75
2.00
2.25
Customer Satisfaction
Figure 6. Asset Size and Customer Satisfaction Scatter-Plot Relationship of Financial Performance and Customer Satisfaction While there is not a relationship between service quality and financial performance overall, there is a strong correlation between these measures for firms with low-variation, high-grade processes. That is, for firms with good, consistent processes, there is a relationship between service quality and financial performance. Better performing (financially) banks do not necessarily have better customer satisfaction measures. As evidenced by Figure 7, there is not a significant correlation between customer satisfaction and price-to-earnings ratio (R2 of -1.1%, p-value of 0.44). That is, banks with better customer satisfaction do not necessarily have higher financial performance.
16
12
10 Price-Earnings Multiple 8
6
1.6
2.0
2.4
2.8
Customer Satisfaction
Figure 7. Customer Satisfaction and Financial Performance Scatter-Plot Better performing (financially) banks with good, consistent processes have better customer satisfaction measures. As evidenced by Figure 8, there is a correlation between customer satisfaction and price-to-earnings ratio for those banks that have good, consistent processes (albeit a correlation with only slight significance). Banks with good processes are those banks with better than average average-process grade, whereas banks with consistent processes, are those banks with lower than average process variation. Thus, for banks with good consistent processes, better customer satisfaction is correlated with higher financial performance. 11
R2 16.2% p-value 0.14
10 Price-Earnings Multiple
9
8
1.5
1.8
2.1
2.4
2.7
Customer Satisfaction
Figure 8. Financial Performance and Customer Satisfaction Scatter-Plot
This section reinforced the analytical model presented in Section 3 by showing that the relation between service process variation and firm performance is stronger than the relation between service process quality and firm performance. It is by consider both the analytical model and the data that we conclude that process variability is a compelling contributor to overall firm performance. The implication of this result is that processes should not be looked at and improved individually (along 17
the best-practices theme0 but rather processes need to be consider collectively when undergoing process improvement.
5. Conclusion There have been conflicting points of view in the banking industry regarding the relationship between process design and firm performance. In this paper, we empirically test the impact of process variation on customer satisfaction (a surrogate for service quality) and price-to-earnings ratio (a surrogate for firm performance). The data used was gathered from the Wharton Financial Institution Center Retail Banking study of fifty-eight of the largest retail banks in the United States. We sought to investigate the conventional hypothesis that expects aggregate process performance to have a positive effect on bank performance. We found that while aggregate process performance seems to have an effect on firm performance it has no effect on customer satisfaction. However, one of the striking findings of this paper is the persistent and statistically significant positive effect of process variation on firm performance. This finding suggest that service processes with consistent (low variation) process performance can play a role in helping firms deliver high firm performance. This partly explains how smaller banks, going against conventional wisdom, have been able to achieve higher overall firm financial performance than their larger competitors, who have a much higher asset base and more diverse service delivery channels4. In addition, this paper revealed that under certain conditions process variation has a positive effect on customer service. That is, for low-variation, high aggregate process performance banks, process variation is significantly correlated with customer service. This result suggests that the consistency in service is important for setting expectations for service quality but that consistency at a high enough level is also required. These findings suggest a shift in the nature of debate about process design. If the negative performance impact of high process variability is more likely to be found in larger firms, and smaller more consistent competitors can potentially minimize this penalty more successfully than their larger counterparts, it may make more sense to focus holistically on the ‘basket’ of processes rather than optimizing individual processes. This argument is consistent with the notion of Complimentary as proposed by Milgrom and Roberts (1990). The argument here is that firms should invest in process improvement and organizational capabilities that decrease process variation rather than investing in improvements which make a firm ‘best of the breed’ for a single process. The results of this paper suggests the need for a period/phase dependent model, in which early process improvement work in financial services should emphasize variation reduction more than single process yield enhancement, when the two are in conflict. The rationale for this being that as the variation levels falls, it becomes easier for management to discover potentially new 4
Smaller banks have the ability to offer more consistent processes, as they are typically not as sprawling in terms of geography or span-of-control as large banks. In addition, there is more likely to be a single person in charge of all service delivery processes at a small bank which increases the chance that the performance is consistent across these processes (Frei, Harker, Hunter 1997).
18
improvements. The task before managers in the banking industry is to discover the best process improvements that will result in process variation ultimately stabilizing or falling over time. Clearly, understanding and measuring process variability is an important issue given that the advances in technology are creating new applications to custom produce, service and deliver retail bank products. Today there are several service delivery channels in financial institutions: branches, call centers, mail, ATMs, direct (PC) banking, Web-based banking, and sales kiosks. These service delivery channels are subtly different and require different process designs to achieve required performance criteria. For instance, in the high volume channels-branches, call centers, and mailvirtually all service processes are initiated by data entry done by bank employees. With the newer channels, consumers do the data entry and initiate the service processes. This change in process initiation has implications for managers. As financial institutions invest in developing new service delivery channels, they need to understand the impact of process variability on service performance. Acknowledgments
This research was supported by the Wharton Financial Institutions Center through a grant from the Sloan Foundation and has benefited from the comments of Patrick Harker. Of course, all errors and omissions are the responsibility of the authors.
References Bohn, Roger (1995), “Noise and Learning in Semiconductor Manufacturing,” Management Science, 41, 31-42. Davenport, T. H. and Short, J. E. (1990), “The new Industrial Engineering: information technology and business process redesign,” Sloan Management Review 31, 11-27. Frei, F. X. (1996), “The Role of Process Designs in Efficiency Analysis: An Empirical Investigation of the Retail Banking,” Unpublished Dissertation, The Wharton School, University of Pennsylvania, Philadelphia, PA. Frei, F. X. and Harker, P. T. (1995), “Projections Onto Efficient Frontiers: Theoretical and Computational Extensions to DEA,” Working Paper, Wharton Financial Institutions Center, The Wharton School, University of Pennsylvania, Philadelphia, PA. Frei, F. X. and Harker, P. T. (1996), “Measuring the Efficiency of Service Delivery Processes: With Application to Retail Banking,” Operations Group Working Paper 96-04, Simon School of Business, University of Rochester. Frei, F. X. and Harker, P. T. (1997), “Aggregating Process Efficiency Using AHP,” Operations Group Working Paper, Simon School of Business, University of Rochester. Frei, F. X. and Harker, P. T., and Hunter L. (1997), “Inside the Black Box: What Makes a Bank Efficient,” Working Paper, Wharton Financial Institutions Center, The Wharton School, University of Pennsylvania, Philadelphia, PA. 19
Huber, G. P. and Power, D. J. (1985), “Retrospective Reports of Strategic-Level Managers: Guidelines for Increasing Their Accuracy,” Strategic Management Journal, 6, 171-180. Kingman-Brundage, J. (1992), “The ABCs of Service System Blueprinting,” in C. H. Lovelock (Ed.), Measuring Services, Second Edition, Englewood Cliffs: Prentice Hall. Milgrom, P. and Roberts, J. (1990), “The Economics of Modern Manufacturing: Technology, Strategy, and Organization,” American Economic Review, 80, 511-528. Morroni, M. (1992), Production Process and Technical Change (Cambridge, United Kingdom: Cambridge University Press). Rust, R.T. and R. Metters, “Mathematical Models of Service,” European Journal of Operational Research, 91, 427-439.
Rust, R.T.; A.J. Zahorik, and T. L. Keiningham (1995), “Return on quality (ROQ): Making service quality financially accountable,” Journal of Marketing, 59, 58-70. Shostack, G. L. (1987), “Service Positioning Through Structural Change,” Journal of Marketing, 51, 34-43.
20