Atmos. Chem. Phys., 5, 3081–3091, 2005 www.atmos-chem-phys.org/acp/5/3081/ SRef-ID: 1680-7324/acp/2005-5-3081 European Geosciences Union
Atmospheric Chemistry and Physics
Aerosol particles in the Mexican East Pacific Part I: processing and vertical redistribution by clouds D. Baumgardner1 , G. B. Raga1 , J. C. Jimenez1 , and K. Bower2 1 Universidad
Nacional Aut´onoma de M´exico, Mexico City, Mexico Science Group, University of Manchester, P.O. Box 88, Sackville Street, Manchester, M60 1QD, UK
2 Atmospheric
Received: 23 September 2004 – Published in Atmos. Chem. Phys. Discuss.: 29 November 2004 Revised: 15 March 2005 – Accepted: 21 October 2005 – Published: 16 November 2005
Abstract. Airborne measurements of aerosol particle size distributions were made in the Mexican Intertropical Convergence Zone. The volume concentrations of submicron and super micron particles at cloud base were compared with those in near-cloud regions over a range of altitudes. Of 78 near-cloud regions analyzed, 68% and 45% had enhanced volumes of submicron particles and supermicron particles, respectively. In addition, 35% of these regions had supermicron particles removed, presumably by precipitation. In 61% of the cases the enhancement in volume occurred over the size range from 0.1 to 50 µm whereas only submicron volumes were enhanced in 35% of the cases. In regions near clouds that were formed in air of maritime origin the frequency of volume enhancement decreased with increasing altitude and was twice as frequent on the dissipating side of clouds compared to the growing side. No such differences were found in the regions near clouds formed in air originating from the land. The frequency and average magnitude of volume enhancement are in qualitative and quantitative agreement with previous observational and theoretical studies that relate enhancements in particle mass to the uptake by cloud droplets of SO2 accompanied by additional growth by droplet coalescence.
1 Introduction Aerosol particles (AP) have a dominant role in the evolution and optical properties of clouds. The fundamental process by which a cloud droplet forms on an AP, i.e. a cloud condensation nucleus (CCN), has been described theoretically and validated with observations as long as the composition of the particle is known (e.g. Twomey, 1991; Raga and Jonas, 1993a, b). On the other hand, the fate of AP after processCorrespondence to: D. Baumgardner (
[email protected])
ing by clouds, i.e. changes in size, concentration and composition, is less well understood. Clouds remove AP from the boundary layer and redistribute them through a variety of dynamical and microphysical mechanisms, e.g. entrainment, mixing and precipitation (Flossmann, 1998). It is generally accepted that some fraction of the AP incorporated into cloud particles will eventually appear again as AP but in a chemically or physically altered form. For example, aircraft measurements have found that AP sizes increase near clouds in regions of high relative humidity (Baumgardner and Clarke, 1998) and other studies (Saxena et al., 1970; DeFelice and Cheng, 1998; Kaneyasu et al., 2001) found that condensation nuclei (CN) concentrations are often higher in the outflow from evaporating clouds than in the environment further away. The AP mass will change as a result of particle sulfate and SO2 scavenging (Hegg and Hobbs, 1981, 1982; Flossmann et al., 1985, 1987; Flossmann and Pruppaccher, 1988; O’Dowd et al., 2000). There have been a number of observational studies of AP interactions with clouds (e.g., Hegg and Hobbs, 1981, 1983; O’Dowd et al., 2000), but very few in the Pacific Intertropical Convergence Zone (ITCZ) and none in the Mexican East Pacific ITCZ. This region is unique as a result of the variation in AP sources, i.e. when the wind direction is westerly the AP are of maritime origin and CN concentrations are less than 500 cm−3 ; however, northerly and easterly winds bring continental, anthropogenic AP from Mexico or Central America and the average, CN concentrations are greater than 1000 cm−3 . These differences in AP origin have significant consequences on cloud formation and the fate of the AP when they are processed by clouds. This paper, part one of two parts evaluates airborne measurements of AP and cloud particles in the ITCZ of the Mexican East Pacific and shows evidence for changes in the AP total volume concentration as a result of cloud processing. Part two, using model simulations, will discuss the direct and indirect effects of AP in this region of the tropics.
© 2005 Author(s). This work is licensed under a Creative Commons License.
3082
D. Baumgardner et al.: Processing and vertical redistribution by clouds
20°
10°
Research area
0°
100°
90°
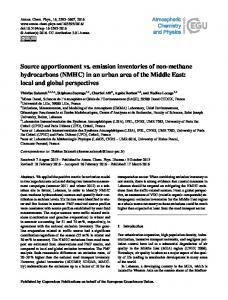
Fig. 1. EPIC-2001 research area during ITCZ flights.
2 Measurement and analysis methodology 2.1
Research area and sampling strategy
The data used in this study were obtained during flights of the US National Science Foundation C-130 research aircraft during the 2001 East Pacific Investigation of Climate (EPIC) project. The program and scientific objectives are described in the EPIC science and implementation plan (Raymond et al., 2004). Nine of the nineteen flights between 1 September and 16 October 2001 were dedicated to AP and cloud studies. These flights were within the ITCZ region, 8◦ –12◦ N, 93◦ – 97◦ W, approximately 800–1000 km from Mexico and Central America (Fig. 1). Measurements in and around clouds were made at the constant levels of 4200 m, 2500 m, 1000 m, igure 1: EPIC-2001 research area during ITCZ flights. 300 m (cloud base) and 30 m a.s.l. The clouds in the research area consisted of small fields of shallow cumulus and lines of deep convection. The current study focuses on these latter clouds that generally developed along lines from the southwest to northeast. The flight trajectories were across and along the cloud lines at each level. The across-the-line patterns normally sampled in the21regions of newer growth and the along-the-line flight legs sampled cells in both developing and decaying stages. In the across-the-line flight tracks the aircraft sampled cloud-free air for at least 20 km on each side of the cloud. 2.2
Instrumentation
The physical properties of AP were derived directly from the composite particle size distribution (PSD) synthesized Atmos. Chem. Phys., 5, 3081–3091, 2005
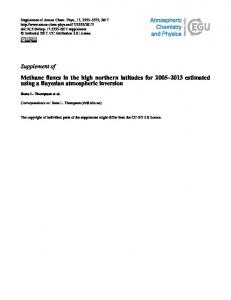
from the measurements by three optical particle spectrometers that were mounted on the wing pods of the C-130: a Passive Cavity Aerosol Spectrometer (PCASP), and two models of the Forward Scattering Spectrometer Probe (FSSP-300 and FSSP-100) that measure in the size ranges 0.1–3 µm, 0.3–20 µm and 2–50 µm, respectively. The concentrations in overlapping size ranges were averaged prior to creating the composite. The concentration of CN, larger than approximately 0.05 µm, was measured with a TSI Model 3760 (Twohy, 1991). All measurements were made at a sample rate of 10 Hz but averaged into one second intervals for the analysis presented here. The technical specifications of the instruments are listed in Table 1. The measurement uncertainties associated with the PCASP have been discussed by a number of authors (Kim and Boatman, 1990; Strapp et al., 1992) as have those of the FSSP-100 and FSSP-300 (Baumgardner et al., 1985, 1992; Baumgardner and Spowart, 1990). The intent of the current study is to evaluate changes in the AP mass that are a result of coalescence or the absorption of gaseous species and not related to uptake of water; hence, the size distributions were adjusted to “dry equivalent” diameters based on the measured relative humidity (RH). A heater on the inlet of the PCASP reduces the RH of the sampled air stream to less than 30% (Strapp et al., 1992) and so we assume that the PCASP is already measuring dried AP. The FSSP-100 and FSSP-300 measure particles at the ambient RH. We had no direct measurements of the chemical composition of the AP so we can’t determine the precise relationship between volume change (used here as an indicator of mass change) and RH. We recognize that the AP in this region is a mixture of sea salt, ammonium sulfate and organic compounds and their origin might be natural or anthropogenic. In order to make the most conservative estimate possible of the dry, AP size, we select a particle composition assumed to be the most hygroscopic of those compounds that might be present. Hence, we assume the particles are primarily ammonium sulfate, particles whose water uptake rate is close to that of NaCl (Tang, 1980). The PSDs measured during each second by the FSSP-300 and FSSP-100 were adjusted by decreasing the size thresholds as a function of the measured RH before synthesizing the composite PSD. The drying factor was taken from the laboratory studies of Tang (1980) that relate the volume change of ammonium sulfate particles to percent RH. Figure 2 illustrates the effect of applying this technique to one of the near-cloud volume distributions discussed below. In this example, the volume concentrations in the submicron size regions are 188 and 25 µm3 mg−1 for the measured and dry equivalent size distributions, respectively. The difference between the measured and dry supermicron regions are 480 and 55 µm3 mg−1 . For those particles that are not ammonium sulfate or NaCl, the estimated, dry volume will be smaller than their actual dry volume. We illustrate this with two particles, A and www.atmos-chem-phys.org/acp/5/3081/
D. Baumgardner et al.: Processing and vertical redistribution by clouds
3083
Table 1. AP and Cloud Particle Instrumentation on the C130 Aircraft. Instrument type
Parameter
Range
Accuracy
CN counter TSI Model 3760 PCASP
Number concentration of aerosol
FSSP-300
Size spectra of aerosols
FSSP-100
Size spectra of aerosols and cloud droplets
0.01 to >3 µm 0 to 2×104 cm−3 0.12 to 3.0 µm1 30 channels1 0.3 to 20 µm 30 channels1 2 to 47 µm 40 channels1
Varies with concentration, about 6% at 3300 cm−3 . ±20% Diameter ±16% Concentration ±20% Diameter ±16% Concentration ±20% Diameter ±16% Concentration
Size spectra of aerosols
1 The PCASP, FSSP-100 and FSSP-300 have had their original electronics replace with the signal processing package (SPP) of Droplet
Measurement Technologies that improves response time, eliminates dead-time and increases the number of size channels.
100
dV/dlogDp (µm3mg-1)
B, whose deliquesced diameters are 1 µm, but the composition of A is ammonium sulfate and particle B is 50% ammonium sulfate and 50% some mildly hygroscopic organic compound. For a given RH, the amount of water on particle B will be less than that on particle A, assuming that water molecules are reacting slower with the organo-sulfate mixture. Neglecting the effect of refractive index on the measurement uncertainty, we assume that both of these will be measured as 1 µm particles and we will reduce their diameters by the same amount of water removed, based on the measured RH. This means that we have erroneously decreased the size of the mixed particle with the result that we are underestimating its true dry size. If the sulfate that was in this mixed particle was a result of cloud processing, then we would lose this information. On the other hand, this is the most stringent test possible, in the absence of knowing the exact composition of the particle, for excluding deliquescence when testing for mass increases that result from cloud processing. We expand upon this argument below.
Water removed Original
10
1
0.1 0.01
0.1
1
Diameter (µm)
10
Figure 2: The two particle distributions of volume concentration as a function of size
Fig. 2. The two particle distributions of volume concentration as a
2.3
Analysis of cloud processing signatures
function of of size illustratethethe of estimating illustrate the effect estimating dryeffect equivalent size fromthe thedry RH,equivalent assuming the size from the RH, assuming the particles are composed completely of ammonium sulfate.
particles are composed completely of ammonium sulfate.
Cloud processing of AP changes their size, concentration or composition. These changes are reflected as differences in the shapes of PSDs, calculated as volume concentrations. More specifically, the PSD can be divided into two regions – the volume concentration of particles with diameter less 1cm defined as has the mixed FSSP100
−3
droplet concentration cm temperature . Air thatdifferent has mixed with cloud is cloud is identified by having a>1 potential than the environment identified by having potential (338 K in this example) by a >1 degree.
temperature different than the environment (338 K in this example) by >1 degree.
as “in-cloud”. This criterion is based on an evaluation of measurements at an altitude of 30 m where there are no clouds and only supermicron sea salt particles will be measured by the FSSP-100, in the absence of any significant vertical mixing of cloudy air from higher altitudes. These super23 micron particles are the first to be activated at low supersaturations during cloud formation, hence an average concentration of 300 m (2) Vr = Vnc − f Vf c − (1 − f )V300 (1) where Vf c is the volume concentration in the far-from-cloud environment at the same altitude as Vnc and f Vf c represents how much of the far cloud air has mixed with the detrained air. If no cloud processing has occurred, we assume that Vnc will simply be some mixture of AP that came from cloud base and AP from the far-from-cloud environment, at the www.atmos-chem-phys.org/acp/5/3081/
f = (CNnc −CN300 )/CN300
24
Z=300 m
(3)
This calculation takes into account changes in the CN concentration with altitude and depends upon our second assumption, i.e. that the concentration of the AP that enter cloud base does not change as a result of cloud processes, Atmos. Chem. Phys., 5, 3081–3091, 2005
3086
D. Baumgardner et al.: Processing and vertical redistribution by clouds
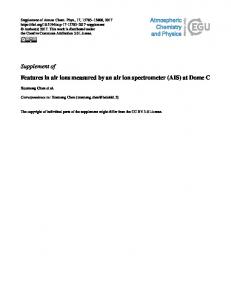
shows the vertical profiles of the CN and PCASP concentrations for the five flights that were evaluated. 4000 Equation (1) was evaluated for each of the near-cloud regions, separating the volume concentrations into their submi3000 G D cron and super micron components. As a result of this analSubmicron ysis, three types of volume changes have been identified that 2000 we associate with cloud processed AP: 1) enhanced volumes D G 1000 of submicron AP, 2) enhanced volumes of supermicron AP D D and 3) removal of supermicron AP. Figure 5a and b illustrate 0.001 0.01 0.1 1 these three types. For example, in the vertical profile shown Volume (µm3mg-1) in Fig. 5a, the measured submicron volume concentrations 5000 (b) at all levels exceed the 300 m concentration far-from-cloud, G D 4000 i.e. submicron volume enhancement. In Fig. 5b, some of the near-cloud regions have enhanced supermicron volume with 3000 Supermicron respect to the 300 m volume, but several of the near-cloud G D volumes are smaller than even the far cloud environment. 2000 This latter characteristic is what we are identifying as superG D 1000 micron particle removal. D D The volume of AP increases primarily through four mech0.01 0.1 1 10 anisms: 1) mixing with environmental air whose particle volVolume (µm3mg-1) ume is higher than at cloud base, 2) growth of particles by 5000 (c) uptake of gases by water droplets and conversion to particle DG 4000 mass, 3) droplet coalescence, or 4) scavenging of interstitial AP by cloud droplets. Given that the far-from-cloud AP vol3000 ume, shown in Fig. 5a, is less than cloud base, the enhanced D G volume in this case is not a result of mixing with the envi2000 ronment. There are other cases, however, where the volume G D concentration of particles is larger at higher altitudes, and 1000 D D would contribute to enhanced volume when mixed with de0 0.1 0.2 0.3 0.4 trained air. The vertical profiles of CN for flights 7 and 9 PCASP/CN (Fig. 4) show this characteristic. Figure 5: Vertical profiles of (A) submicron and (B) supermicron volume The submicron particle volume is derived from the meaFig. 5. Vertical profiles of (a) submicron and (b) supermicron volsurements with the PCASP whose minimum size threshold concentrations comparing near-cloud regions (solid) with the environmental ume concentrations comparing near-cloud regions (solid) with the is 0.1 µm. Enhancement of AP volume will be observed averagesenvironmental (dashed). The averages letters designate region was on the (dashed).if the Thenear-cloud letters designate whether a near-cloud region(D) was on ofthe (G) standard or dissipating (D) around side thewhen particle with sizes less than 0.1 µm grow into the range growing (G) or dissipating side thegrowing cloud. The deviation of the PCASP. This type of volume enhancement is evaluof the cloud. The standard deviation around the averages is shown averages is shown with the horizontal bars. The vertical profiles (C) are the ratios of ated by calculating the ratio of PCASP to CN concentration. with the horizontal bars. The vertical profiles shown in (c) are the PCASP to CN number concentration. When this ratio increases with respect to the reference value, ratios of PCASP to CN number concentration. it indicates that the number of particles larger than 0.1 µm increased more rapidly than the total number concentration. This indicates that particles have increased in size, presumbut does allow for the possibility that there are elevated lay25 ably due to cloud processing, since mixing should change ers of particles, in the far-from-cloud environment, that could by the same amount the relative concentration of CN and mix with detrained air. In addition we are assuming that the PCASP. Figure 5c shows a vertical profile of this ratio for concentrations of CN found at 300 m far-from-cloud are the one of the cases studied. The increase in the ratio from 300 m same as enter at cloud base. Clearly droplet coalescence and to 1000 m suggests that AP volumes are increasing as a reinertial scavenging will remove some fraction of the total sult of particles that grow into the detectable size range of the CN; however, the CN concentrations are dominated by parPCASP. ticles