It enables practitioners to estimate daily ... following factors that impact pile construction productivity were ... Waiting time for other operations i.e., pile axis allocation; ..... Each curve in this figure ... divulge any company names or information because of confiden- ... It shows the details of each cost figure and explains each.
Productivity and Cost Regression Models for Pile Construction Tarek M. Zayed1 and Daniel W. Halpin2
Abstract: The estimating process of pile construction productivity and cost is intricated because of several factors: unseen subsurface obstacles; lack of contractor experience; site planning; and pile equipment maintainability. This study intends to assess cycle time, productivity, and cost for pile construction considering the effect of the above factors using regression technique. Data were collected through designated questionnaires, site interviews, and telephone calls to experts in different construction companies. Many variables have been considered in the pile construction process. Seven regression linear models have been designed and validated to assess productivity, cycle time, and cost. Consequently, three sets of charts have been developed based upon the validated models to provide the decision maker with a solid planning, scheduling, and control tool for pile construction projects. This research is relevant to both industry practitioners and researchers. It provides sets of charts and models for practitioners’ usage to schedule and price out pile construction projects. In addition, it provides the researchers with the methodology of designating regression models for the pile construction process, its limitations, and future suggestions. DOI: 10.1061/共ASCE兲0733-9364共2005兲131:7共779兲 CE Database subject headings: Piles; Construction; Productivity; Costs; Statistical analysis; Predictions; Regression models.
Introduction Subsurface obstacles, lack of contractor experience, site planning difficulties, and other factors play the most important role in assessing pile construction productivity and cost. Some of these factors are explained and summarized in the following statements. The site preinvestigation usually consists of statistical samples around the foundation area that do not cover the entire area. Soil types differ from site to the other based on cohesion or stiffness, natural obstacles, and subsurface infrastructure obstacles. Lack of experience in adjusting pile axis, length, and size present a further complication. Mechanical and drilling problems of pile machine should be considered. Problems due to site restrictions and disposal of excavated spoil have a great effect on productivity. The rate of steel installation and pouring concrete is impacted by the experience of steel crew and method of pouring. All these problems, no doubt, greatly affect the production of concrete piles on site. There is a lack of research in the field of assessing productivity and cost of pile construction. Therefore, the objectives of current 1
Assistant Professor, Dept. of Building, Civil, and Environment Engineering, Concordia Univ., 1257 Guy St., Montreal, QC, Canada H3G 1M7. 2 Head, Division of Construction Engineering and Management, School of Civil Engineering, Purdue Univ., West Lafayette, IN 479071294. Note. Discussion open until December 1, 2005. Separate discussions must be submitted for individual papers. To extend the closing date by one month, a written request must be filed with the ASCE Managing Editor. The manuscript for this paper was submitted for review and possible publication on October 7, 2003; approved on February 16, 2005. This paper is part of the Journal of Construction Engineering and Management, Vol. 131, No. 7, July 1, 2005. ©ASCE, ISSN 0733-9364/2005/ 7-779–789/$25.00.
study are: 共1兲 analyze pile construction productivity factors and 共2兲 assess productivity, cycle time, and cost using the regression analysis technique based upon most of the above factors. Current research develops sets of charts and models for practitioners’ usage to schedule and price out pile construction projects. These charts have significant effect on managing pile construction projects. It enables practitioners to estimate daily production, schedule, and optimize time distribution of pile machine to different projects, and estimate duration and cost of pile construction projects. In addition, it provides researchers with the methodology of designing regression models for pile construction process, its limitations, and future suggestions.
Pile Installation Productivity Factors Based on studies of the construction process and literature, the following factors that impact pile construction productivity were identified 共Peurifoy et al. 2002兲: • Soil type 共i.e. sand, clay, stiff clay, …etc兲; • Drill type and height of drilling tool 共e.g., auger, bucket兲; • Method of spoils removal, the size of hauling units, and space considerations at the construction site; • Pile axis adjustment 共adjust the equipment above the pile axis location兲; • Equipment operator efficiency; • Weather conditions; • Concrete pouring method and efficiency; • Waiting time for other operations 共i.e., pile axis allocation兲; • Job and management conditions; • Cycle time; • Pile size; and • Pile depth.
JOURNAL OF CONSTRUCTION ENGINEERING AND MANAGEMENT © ASCE / JULY 2005 / 779
Table 1. Piling Process Productivity Variables Attributes Matrix Pile size 共兲a 共in.兲
18
30
48
60
Soil type Pile depthb 共ft兲 Pouring method
clay middle sand 30 40 50 60 Tremie Funnel 共wet method兲 共dry method兲 Auger length 共height兲c 共ft兲 3 4 5 6 a Pile depths: 30, 40, 50, and 60 ft equal to 9.14, 12.19, 15.24, 18.29 m, respectively. b Diameter: 18, 30, 48, and 60 in. equal to 0.46, 0.76, 1.22, and 1.53 m, respectively. c Auger heights: 3, 4, 5, and 6 ft equal to 0.92, 1.22, 1.53, and 1.83 m, respectively.
Productivity Variables Attributes Matrix There is large number of variables that affect the estimation process of pile construction productivity and cost. It is impossible to consider all of them in one research. Current study concentrates only on some of the major variables, such as pile size, soil type, pile depth, pouring system, and auger height as shown in Table 1. Pile sizes 共兲 include 0.46, 0.76, 1.22, and 1.53 m 共18, 30, 48, and 60 in.兲. Soil types incorporate clay, middle, and sand. Middle soil type represents all types between pure clay and sand, such as silt, sandy clay, silty sand, and others. Pile depths cover the following lengths: 9.14, 12.19, 15.24, and 18.29 m 共30, 40, 50, and 60 ft兲. Two pouring systems or techniques are used: tremie and funnel. Tremie technique is used in wet method; however, funnel is used in dry method. Various auger heights are considered, such as 0.92, 1.22, 1.53, and, 1.83 m 共3, 4, 5, and 6 ft.兲. Current study only considers the above-mentioned factors according to the specified limits when estimating piling process productivity. Five variables with 17 attributes are recognized. Therefore, collected data have been divided into several data sets to cope with the selected variables and their attributes. Data have been divided into four main sets based on pile size, one set for each size. Within each set, data are classified into three categories according to soil type attributes: clay, middle, and sand. Each category has at least 30 data points to indicate the remaining variables, such as pile depth, pouring method, and auger height.
Data Collection Current study collected data through questionnaire, site interviews, site visits, and telephone calls to contractors and consultants who are specialists in concrete bored pile construction and design, respectively. Reviewers were asked to provide information about cycle time, productivity, and soil characteristics for a pile project 共typical average project兲 that is already completed or is currently in process. Accordingly, each questionnaire, site visit, or telephone call represent a full set of information about at least one pile project. Only 96 out of 150 contractors expressed their commitment to review and answer the questionnaire, reply to the telephone calls, or accept the site visit. The number of replies was 34 out of 96 questionnaires with a reply percent of 35.42%. For further information, the reader is referred to Zayed 共2001兲 and Zayed and Halpin 共2004兲.
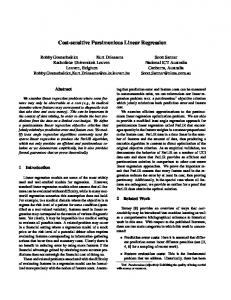
Fig. 1. Regression model framework for concrete pile construction
Study Methodolgy To designate regression models for estimating pile construction productivity and cost, a three-phase framework is developed as shown in Fig. 1. The first phase includes model building, which consists of: 共1兲 collecting quantitative and qualitative data and selecting model’s variables; 共2兲 checking the significance of model variables based on statistical criteria; and 共3兲 building regression models. In the second phase, the developed models are validated through comparing their results to the collected validation data points. If these results do not match; then, the model should be improved to produce better results. In the third phase 共sensitivity analysis phase兲, the effect of changing an input variable value on outputs will be checked to determine the model limitations; and to build a range of inputs that corresponds to the same output, if applicable.
Regression Models Design Regression is a data oriented technique because it deals directly with the collected data without considering the process behind these data. Regression is a mature technique that has been used in many scientific applications. Regression models can be linear or nonlinear, which represent a relation between dependent variable共s兲 and independent variable共s兲. Regression models for the piling process consider one dependent variable 共productivity,
780 / JOURNAL OF CONSTRUCTION ENGINEERING AND MANAGEMENT © ASCE / JULY 2005
drilling time, cage erection time, or pouring time兲 against several independent variables 共auger height, soil type, pile size and depth, and pile construction method兲. The following subsections describe the methodology of building these regression models.
Variables Selection for Regression Models The variables of a regression model can be tested statistically to select the best number of variables that best fit the available data. Six different models have been designed for each data set. Four of these models represent the relation of cage, tremie erection, funnel erection, and pouring times against pile depth. Time variable is dependent and depth is independent. The relation of drilling time to depth and auger height is represented in the fifth model considering different soil types. The sixth model represents the relation between productivity as a dependent variable to depth and auger height as independent variables. Another productivity model has been designed for productivity against all the available cycle time variables, such as drilling, cage, tremie or funnel erection, pouring times, adjusting pile axis time, and machine relocation time as well as depth and auger height. This productivity model includes eight independent cycle time variables. Statistical stepwise selection procedure has been used to select the best number of independent variables that best fit productivity against cycle time activities. The MINITAP® statistical package is used to perform this selection process. Four selection criteria are used to distinguish between different proposed models. These criteria are R square, adjusted R square, mean square error 共S or MSE兲, and Mallow’s collected Productivity 共CP兲. The reader is recommended to consult Neter et al. 共1996兲 or any other regression references for the definition of each criterion. The best model that can represent the collected data set is selected according to the largest R square and adjusted R square, the minimum MSE, and the closest CP to the number of independent variables. Hence, if the selected model has only five independent variables, the best model is the model with CP close to five. All these criteria have been considered when selecting the best model to achieve the above requirements. The best model is selected to represent each prepared data set, which is used to calculate the process productivity as explained in the following subsections. Other models, which have one or two independent variables, do not require all these steps of selection for the independent variables. On the other hand, depth and auger height variables should be restrained in productivity models because they are essential inputs in the process; therefore, there is no need to do stepwise selection procedure for them.
Building of Regression Models Two statistical packages were used to perform this step of current research. The SAS® package has been used to build all the models while the MINITAP® package is used to perform lack of fit 共LOF兲 test for models with replications. This test guarantees the robustness of the developed model in representing current data set. The SAS® codes are designated to build six models for different conditions as explained above in the previous subsection. Due to wide spectrum of piling process variables, many regression models have been designed. The variety of variables in current study only addresses pile sizes 0.46, 0.76, 1.22, and 1.53 m 共18, 30, 48, and 60 in.兲, soil types 共clay, middle, and sand兲, and construction methods 共dry and wet兲. For example, a productivity model for pile size -18 in clay soil using the wet method was developed. According to this classification, there are 24 productivity models
that cover the combination of two construction methods, four pile sizes, and three soil types. These productivity models are shown in Table 2 along with their statistical analysis. Productivity models address the relation of productivity to depth and auger height. Similarly, drilling time models have been built according to soil types and pile sizes. Current study only builds 12 models for drilling time, as shown in Table 3. Drilling time models represent the relation of drilling time against both depth and auger height. The four remaining models show the relation of cage, tremie erection, funnel erection, and pouring times against pile depth for different pile sizes. Therefore, 16 models have been built for four pile sizes and four time variables, as shown in Table 4. Hence, the total number of regression models that have been designed in the current study counts for 52 models. Linear statistical models have been used for several reasons: 共1兲 they can easily be used by construction site engineers and management; 共2兲 visual data inspection shows linear trends in data 共using scatter diagrams兲; and 共3兲 statistical analysis for quadratic and cubic models does not enhance outputs more than linear models; however, they are more complicated particularly for practitioners.
Statistical Analysis of Piling Process Regression Models The regression models were designed and their statistical features were checked as shown in Tables 2, 3, and 4. These statistical features can be used to check the statistical robustness of these models. These statistical features include: 共1兲 p value of F test for each model as a whole 关P共F兲兴; 共2兲 R square for the model 共coefficient of determination兲; 共3兲 p value of t-test for the coefficients of regression models 关P共t兲兴; and 共4兲 p value of the LOF test. These are the criteria that are used to check the models’ statistical validity as discussed below. Test Regression Models Statistically Productivity regression models draw the relation of productivity against depth and auger height. The interaction between depth and auger height has been checked to determine whether it is statistically valid to be embedded in the model. This interaction does not meet the criteria 关F-test for the whole model and t-test for model’s coefficients support the null hypothesis 共coefficients= 0兲兴 to be included in the productivity models. Similarly, it fails to be included in the drilling time models. Hence, productivity and drilling time models include two independent variables as shown in Tables 2 and 3. Three different criteria are used to test the model as a whole, such as: 共1兲 p value for F test 关P共F兲兴; 共2兲 coefficient of determination 共R2兲, and 共3兲 p value for lack of fit test 关P共F兲 LOF兴, as shown in Table 2. Furthermore, three other different criteria are used to check the models’ coefficients 共e.g., p value of t-test 关P共t兲兴 for intercept and coefficients of the two independent variables兲. Statistical validity for the developed regression models are checked using P共F兲, R2, and P共F兲 LOF. To determine P共F兲 for the model as a whole, a test of hypothesis is carried out to accept or reject the null hypothesis. Assume that 0 , 1 , 2 are the regression models’ coefficients in the linear relation. Therefore, to test regression models’ linear relationship, the null hypothesis 共H0兲 assumes that 0 = 1 = 2 = 0 where the alternative hypothesis 共Ha兲 assumes that not all of them equal zero. Based on SAS package outputs that are included in Table 2, the p value for the first model is 0.0001. This means that Ha is accepted at 10, 5, and 1% levels of significance where there is a linear relation between productivity and both depth and auger height. Hence, the linear
JOURNAL OF CONSTRUCTION ENGINEERING AND MANAGEMENT © ASCE / JULY 2005 / 781
Table 2. Piling Process Productivity Models Statistical Regression Analysisa Number
Case description
1
Wet-18-C
2
Wet-18-M
3
Wet-18-S
4
Dry-18-C
5
Dry-18-M
6
Dry-18-S
a
Sample size is at least 30
Productivity model 8.4174–0.0766 depth+ 0.8347 Auger height 9.1232–0.1046 depth+ 0.8722 Auger height 7.4366–0.0672 depth+ 0.9239 Auger height 12.4190–0.1061 depth+ 0.5939 Auger height 12.9042–0.1072 depth+ 0.4595 Auger height 12.3319–0.1093 depth+ 0.5984 Auger height points for each model.
P 共F兲
R2
P 共t兲 intercept
P 共t兲 depth
P 共t兲 auger
P 共F兲 lack of fit
0.0001
0.8887
0.0001
0.0001
0.0001
0.815
0.0001
0.9179
0.0001
0.0001
0.0001
0.960
0.0001
0.9044
0.0001
0.0001
0.0001
0.970
0.0008
0.4957
0.0001
0.0008
0.0613
1.000
0.0001
0.8856
0.0001
0.0001
0.0002
0.875
0.0001
0.8272
0.0001
0.0001
0.0001
0.789
variables’ coefficients 共depth and auger height兲. The hypothesis t-test of null hypothesis 共H0兲 assumes that 0 = 0 while the alternative hypothesis 共Ha兲 assumes that 0 ⫽ 0 is performed for the intercept. Similarly, the other two t-tests assume null hypotheses of 1 = 0 and 2 = 0 and the alternative hypotheses of 1 ⫽ 0 and 2 ⫽ 0 are checked for the independent variables’ coefficients 共depth and auger height兲, respectively. The outcomes of these t-tests are shown in Tables 2, 3, and 4 in the form of a p value for each test 关P共t兲兴. The results indicate that most of the models have p values of 0.0001 for the three tests. Consequently, alternative hypothesis 共Ha兲 is accepted at 10, 5, and 1% levels of significance where depth and auger height variables have linear relations individually with productivity and drilling time. This means that 0 ⫽ 0, 1 ⫽ 0, and 2 ⫽ 0 at 99% confidence. Some of the p values for several variables in a group of models have values less than 0.08, which still can be accepted at 90% confidence or at 10% level of significance. Accordingly, all the designed models are tested for their robustness to fit the data sets. Based on statistical checks, all the designed regression models perform well in representing current data. The validation process is an important step to guarantee that the developed models best fit the available data. All models are tested statistically and practically to determine whether they are efficient in predicting real world results. The following subsection discusses the validation procedure for all the regression models.
relationship is accepted with 99% confidence that it is the best fit for the data. All models in Tables 2, 3, and 4 concluded Ha at 1% level of significance that indicated the utmost convenience of linear relation to the data. R square for the same model is 0.8887 where it represents the coefficient of multiple determination that measures the proportional reduction of total variation in productivity using depth and auger height as independent variables. In other words, it represents the total variability in productivity explained by depth and auger height. This does not necessarily imply that the fitted model is not a useful one. Checking most of the models in the three tables indicates that R square is above 0.8 for most of them. This implies that data vary little around the fitted models. Some of the models have an R-square value less than 0.50, which indicates that the data vary greatly around the fitted model but this does not mean that these models are not useful. A LOF test has been performed for productivity models because they have productivity data replications at the x axis levels of both depth and auger height. The F-test has been carried out to test the models’ lack of fit to determine whether these models best fit the data. The p value of the F-test is shown in the last column of Table 2. If the p value is less than the level of significance, the model fails to fit the data. If not, the model is a best fit for the data. All models in this table are best fit where they pass the LOF test. For further details, the reader is referred to Neter et al. 共1996兲.
Validation of Regression Models
Test Regression Models’ Coefficients Statistically After regression models are statistically checked, the models’ coefficients have to be checked to confirm that the models are a good fit for the data. Each independent variable’s coefficient as well as the intercept are checked for every designed model. Three t-tests are accomplished for the intercept and the two independent
The validation process is performed by comparing the outputs of developed models to actual collected data from pile construction site. Therefore, the collected data set is divided into two main sets: model building 共70% of collected data set兲 and validation 共30% of collected data set兲 data sets. The model-building data set
Table 3. Piling Process Drilling Time Models Statistical Regression Analysis Case description
Drilling time model
1
Clay-18
2
Middle-18
3
Sand-18
15.5+ 0.464 depth− 4.02 Auger height 14.63+ 0.499 depth− 4.194 Auger height 14.705+ 0.499 depth− 3.834 Auger height
Number
P 共F兲
R2
P 共t兲 intercept
P 共t兲 depth
P 共t兲 auger
0.0001
0.9328
0.0001
0.0001
0.0001
0.0001
0.9342
0.0001
0.0001
0.0001
0.0001
0.9059
0.0001
0.0001
0.0001
782 / JOURNAL OF CONSTRUCTION ENGINEERING AND MANAGEMENT © ASCE / JULY 2005
Table 4. Piling Process Cage, Tremie, Funnel, and Pouring Time Models Statistical Regression Analysis Number
Case description
Cage, tremie, funnel, and pouring time model
P 共F兲
R2
P 共t兲 intercept
P 共t兲 depth
1 2 3
Cage-18 Tremie-18 Funnel-18
共−3.6+ 0.24 depth兲 6.6041+ 0.1403 depth 2.873+ 0.043 depth
0.0001 0.0001 0.0001
0.4224 0.6816 0.6469
0.0068 0.0001 0.0001
0.0001 0.0001 0.0001
is used to build all regression models where the other set 共new project data兲 is used to validate these models. Both sets are different and randomly selected to validate the developed models using a completely new data set. Regression models’ statistical significance does not imply that they are ready to be used in real practice. Models’ results have to be validated and compared with real world data to ensure that the designed models are good enough for real construction practice use. The validation process includes substituting validation data inputs to the designed models, concluding the outputs, and comparing them with real world collected data. If the models’ results are close to the real world data, then the models are valid and can be used in real construction practice. If not, they cannot be used and other models have to be designed to fit this process. This validation process has been carried out for all the designed models. The outcome of this process shows that all the developed models are valid and reasonable for real practice use. To exactly compare predicted results of productivity models to collected data, a validation factor 共VF兲 was calculated for each data point using Eq. 共1兲 as follows: validation factor 共VF兲 = PMR/CP
共1兲
where PMR= productivity model result and CP= collected productivity. The VF has been calculated for each validation data 共30% of collected data兲 point considering its corresponding productivity model results. This has been done for different soil types: clay, middle, and sand. Table 5 shows the calculated validation factor for clay, middle, and sand soils using wet and dry methods in different pile sizes. It shows that the VF equals 0.96 for -18 bores in clay soil using the wet method, while it is 0.92 for the
dry method. It is noticed that the model fits productivity for the wet method with 96% fitness while it is 92% for the dry method. The concept of VF has been designed to check fitness degree of designed models. The value of VF for more than 52% of the models’ outputs is more than 95% accurate; however, 83% of the models outputs have been predicted with more than 90% accuracy.
Regression Models Applications Productivity and Times Prediction Since regression models are validated statistically and in practice, they are good enough to predict productivity and cycle time elements, such as drilling, cage erection, tremie erection, funnel erection, and pouring times. Therefore, the designed models are used to estimate the above elements according to project conditions. For example, if a project is constructed in clay soil for -18 piles using the dry method of construction, the proper models related to these conditions have to be used. These models and their predicted variables are shown in Table 6. They are used to predict productivity, drilling time, and cost for different depths and auger heights in -18 piles with clay soil using the dry method. The application of these models to a specific set of conditions is explained in the following subsections.
Predicted Productivity for -18 Piles Prior to any prediction of pile construction productivity, project conditions have to be reasonably defined. This study considers
Table 5. Validation Factor Using Regression Technique Validation points
Wet-18
Dry-18
1 2 3 4
0.96 0.94 1.02 0.98
0.92 0.94 0.94 0.96
5 6 7 8
0.96 0.94 1.06 1.01
9 10 11 12 13 14
1.17 1.12 0.94 0.94 1.03 1.00
Wet-30
Dry-30
Wet-48
Dry-48
Wet-60
Dry-60
Validation factor for clay soil 0.98 1.06 0.88 1.11 1.07 0.95 0.97 0.97 1.02 1.10 1.08 0.95
0.86 0.92 0.99 1.05
0.88 0.95 1.02 0.95
1.00 1.12 1.03 1.14
1.11 1.00 1.04 1.03
Validation factor for middle soil 0.95 1.00 0.95 1.08 1.03 1.08 1.09 0.96 0.94 0.98 1.00 1.07
0.94 0.98 1.03 1.07
1.12 1.08 0.90 1.01
1.12 1.08 0.90 1.01
1.21 1.09 1.15 1.16 0.95 0.97
Validation factor for sand soil 0.95 1.02 0.94 1.06 1.04 0.92 0.94 0.96 1.03 0.94 0.97 1.00 — — — — — —
0.97 0.98 0.89 0.99 — —
1.00 0.88 1.04 1.07 — —
0.00 0.00 1.00 0.88 — —
JOURNAL OF CONSTRUCTION ENGINEERING AND MANAGEMENT © ASCE / JULY 2005 / 783
Table 6. -18 Piles Regression Models and Its Predicted Subjects Model
Subject predicted
12.4190− 0.1061 depth+ 0.5939 Auger height Productivity 15.5+ 0.464 depth− 4.02 Auger height Drilling time 共−3.6+ 0.24 depth兲 Rebar cage erection time 6.6041+ 0.1403 depth Tremie erection time 2.873+ 0.043 depth Funnel erection time 共−0.843+ 0.218 depth兲 Concrete pouring time
several conditions to select the proper productivity model. Pile size, soil type, and method of construction are three major conditions that impact the selection process of the appropriate model共s兲 upon which the proper model can be based. If a project has -18 关pile size= 18 in. 共0.46 m兲兴 piles in clay soil, the project manager has to determine whether the dry or wet method should be used. Suppose the manager selects the wet method for a reason; hence, he/she has to define the auger height that is available or necessary to be used. The designer determines the pile’s depth and provides it for the project manager. At this moment, all the variables and conditions have been defined accurately for the decision maker to predict project productivity. According to the previous case, the following productivity model is used as: productivity = 8.4174 − 0.0766X1 + 0.8347X2 共holes/day兲 共2兲 Suppose that a pile has a depth of 9.14 m 共30 ft.兲 and auger height of 1.53 m 共5 ft.兲, then, productivity can be predicted as 10.3 holes/ day. Varying depth from 9.14 m 共30 ft.兲 to 18.29 m 共60 ft.兲 with 3.05 m 共10 ft.兲 increments and auger height from 0.92 m 共3 ft.兲 to 1.83 m 共6 ft.兲 with 0.07 m 共25 ft.兲 increments, Fig. 2 is created to facilitate productivity calculation based on these specified conditions. It shows the relation of productivity to auger height given different pile depths. Each curve in this figure represents productivity using different auger heights in a specified depth. Therefore, each curve addresses one specified depth, such
as 9.14, 12.19, 15.24, and 18.29 m 共30, 40, 50, or 60 ft.兲. For example, a project of 12.19 m 共40 ft.兲 depth and 1.53 m 共5 ft.兲 auger height has a productivity of 9.52 holes/ day as shown in Fig. 2. A set of charts has been developed to cover productivity for other pile sizes in different conditions.
Predicted Drilling and Other Times for -18 Piles Similar to productivity, drilling time charts have been developed according to project conditions and design information provided. Drilling time is calculated using the developed models based on the project’s available conditions. For example, in a project of -18 piles in clay soil using the wet method, the following drilling time model can be used: drilling time = 15.5 + 0.464X1 − 4.02X2 共min兲
共3兲
Model 共3兲 is used to create the chart in Fig. 3. Using this figure, drilling time for a pile of 9.14 m 共30 ft.兲 depth and 1.53 m 共5 ft.兲 auger height is 9.2 min. Therefore, this chart is informative for estimators to organize piling machine work within the company’s projects and inside the same project. Similar charts are designed for different soil types and pile sizes. Curves of rebar cage erection, tremie erection, funnel erection, and pouring times are included in one chart for each pile size. The appropriate model for each time activity is selected according to project conditions. For example, in a project of -18 piles in clay soil, the following time activities’ models are: cage erection time = − 3.6000 + 0.2400X1 共min兲
共4兲
tremie erection time = 6.6041 + 0.1403X1 共min兲
共5兲
funnel erection time = 2.8730 + 0.0430X1 共min兲
共6兲
pouring time = − 0.8430 + 0.2180X1 共min兲
共7兲
Fig. 2. Predicted productivity for -18 in clay soil using wet method 784 / JOURNAL OF CONSTRUCTION ENGINEERING AND MANAGEMENT © ASCE / JULY 2005
Fig. 3. Predicted drilling time for -18 in clay soil
The estimator has to select the proper model, which matches project conditions based on whether tremie or funnel will be used to pour concrete. Fig. 4 shows the curves that determine cage, tremie, and pouring times using the wet method. At a specified depth, the required time can be determined from the corresponding curve. For example, tremie creation time for a pile of 12.19 m 共40 ft.兲 depth using the wet method is 12.50 min.
Piling Process Cost Estimation The construction cost of piles varies widely according to location and time. In other words, drilled shaft construction cost is different from place to place in the United States and from time to time in the same place due to many factors. Some of these factors are inflation, different market prices, and materials availability and
Fig. 4. Predicted cage, tremie, and pouring times for -18 in clay soil JOURNAL OF CONSTRUCTION ENGINEERING AND MANAGEMENT © ASCE / JULY 2005 / 785
Table 7. Factors that Affect Piling Process Cost Factor Subsurface 共soil兲 conditions Site conditions
Geometry of pile 共depth兲 Specifications including inspection procedure
Expected weather conditions Locations of the project and its closest means of travel and unions. Governmental environmental regulations Availability of proper equipment Contractor experience and economic conditions. Contract requirements
Table 8. Cost of Piling Process Activities
Factor description It has a great effect on the cost because of drilling difficulties in different soil types. It includes trafficability, underground lines, trees, ground surface elevations, overhead lines, and nearby structures. All these subfactors affect cost greatly. Cost varies for different pile depths and sizes. The way specifications is written down is very important in cost estimation because the contractor will determine his/her prices according to the inspection procedure in the project. Weather conditions. Locations to the closest means of travel and unions. This is important regarding the cost of spoil soil removal. Number of pieces of equipment that can fit in the site is critical in productivity estimation and hence cost estimation. Contractor financial status. It includes bonding and insurance capacities, terms of payment, and terms of reference in the contract.
prices. Therefore, the current study concentrates on collecting piling process costs from different reviewers all over the United States. The final outcome of cost collection was disappointing because reviewers answered technical questions and refused or were conservative in providing cost information. They considered cost data confidential information and not for public usage even if it was clear from the beginning that the current study would not divulge any company names or information because of confidentiality. Consequently, the collected information related to cost was not proper to build analysis upon. Since the current study should consider cost analysis for the piling process, it has to look for another means of information for piling process costs. Reese and O’Neill 共1988兲 in conjunction with the Federal Highway Administration and the International Association of Foundation Drilling 共ADSC兲 have done a study on drilled shafts. It presented a cost estimate procedure for piles. The current study used Reese and O’Neill’s 共1988兲 cost figures as a base for cost analysis. Because their cost figures were collected in 1987 prices, the current study used a conversion factor to reallocate these cost figures to 2000 prices. Prior to approaching cost analysis, it is better to address the factors that influence piling process costs. The current study considers the major cost factors based on Reese and O’Neill 共1988兲 as shown in Table 7. The study of Reese and O’Neill 共1988兲 collected cost data from ADSC contractors neglecting mobilization and demobilization costs because they depended on project location. The current study considers the average cost figures developed by Reese and O’Neill 共1988兲. Table 8 shows the cost figures that have been indicated in Reese and O’Neill 共1988兲 and its conversion using the RSMeans 2000 conversion factor. The outcome conversion factor that converts cost figures from year
Average cost 共$ / yd3兲 Year 1987
Cost item
Conversion factorf
Average cost 共$ / yd3兲 Year 2000
Drilling cost 共DMSUC兲a $62.00 1.3637 $84.55 $96.00 1.3637 $130.92 Drilling cost 共DMSC兲b Drilling cost 共WMSS兲c $113.00 1.3637 $154.10 $139.00 1.3637 $189.56 Drilling cost 共WMSC兲d $57.00 1.3637 $77.73 Rebar cage coste Concrete pouring coste $23.00 1.3637 $31.37 Notes: drilling cost= machine cost+ crew cost; placing cage cost= crane cost+ crew cost; placing concrete cost= tremie/ funnel cost+ crew cost + pump cost; the available average cost cover typical diameter from 12 to 72 in.; and typical depth ranges from 15 to more than 50 ft. a DMSUC= dry method in soil uncased. b DMSC= dry method in soil using case. c WMSS= wet method in soil using slurry. d WMSC= wet method in soil using case. e This cost is per hole. f This factor is based on RSMeans 共Mahoney 2000兲.
1987 prices to year 2000 prices is 1.3637. The resulted cost figures as of year 2000 have been used to calculate the cost of the piling process in current study. Most of the costs in Table 8 are in $/cubic yard except for the rebar cage cost, which is estimated in $/hole. It shows the details of each cost figure and explains each abbreviation. The converted total costs for constructing a complete pile are shown in Table 9. Cost per cubic yard has been taken from Table 8 and multiplied by the volume of each pile to get the total cost per hole in the following equation: TCl = 2.02 ⫻ 10−4关共DCl + PC兲 ⫻ 2 ⫻ D兴 + RC
共8兲
where TC= total cost; DC= drilling cost; PC= pouring cost; D = pile depth; and RC= rebar cage placing cost. The cost model in Eq. 共8兲 has been applied to the four construction methods of piling process: 共1兲 dry method soil uncased 共DMSUC兲; 共2兲 wet method soil slurry 共WMSS兲; 共3兲 dry method soil cased 共DMSC兲; and 共4兲 wet method soil cased 共WMSC兲. Drilling and concrete pouring costs are substituted in the cost model Eq. 共8兲 in $/cubic yard while the pile diameter and depth are embedded into the model in inches and feet, respectively. The results of applying the cost model Eq. 共8兲 are shown in Table 9. It is clear that the total cost per pile is different from one construction method to the other for different diameters and depths. Cost curves have been constructed to predict cost/hole in different depths within different pile sizes. Fig. 5 shows the total cost curves for various pile sizes: 18, 30, 48, and 60 in. and with different depths: 9, 14, 12.19, 15.24, and 18.29 m 共30, 40, 50, and 60 ft.兲 using two construction methods: DMSUC and WMSS. The continuous curves represent DMSUC costs and the dotted curves represent WMSS costs. Similarly, Fig. 6 shows similar information for the other two construction methods: DMSC and WMSC.
Illustrative Example Three projects of 105, 149, and 86 pile holes with -18 and 12.19, 15.24, and 18.29 m 共40, 50, and 60 ft.兲 depth in clay, middle, and sand soils, respectively, need to be constructed. How many working days does the contractor need the piling machine in each project? Knowing that the dry method can only be used in
786 / JOURNAL OF CONSTRUCTION ENGINEERING AND MANAGEMENT © ASCE / JULY 2005
Table 9. Cost of Piling Process Construction Methods Total cost 共$/hole兲 共as year 2000 prices兲 at depths 共ft兲a Construction method
Diameter 共in.兲b
30
40
50
60
DMSUC: Dry method in soil uncased
18 30 48 60
$305.29 $709.85 $1,695.95 $2,606.19
$381.15 $920.55 $2,235.35 $3,449.01
$457.00 $1,131.26 $2,774.76 $4,291.83
$532.86 $1,341.96 $3,314.16 $5,134.65
DMSC: Dry method in soil using case
18 30 48 60
$396.32 $962.69 $2,343.23 $3,617.58
$502.51 $1,257.68 $3,098.40 $4,797.52
$608.71 $1,552.67 $3,853.57 $5,977.47
$714.90 $1,847.65 $4,608.73 $7,157.42
WMSS: Wet method in soil using slurry
18 30 48 60
$441.83 $1,089.12 $2,666.88 $4,123.27
$563.20 $1,426.24 $3,529.92 $5,471.78
$684.56 $1,763.37 $4,392.97 $6,820.29
$805.93 $2,100.50 $5,256.02 $8,168.80
18 $511.44 $656.01 30 $1,282.47 $1,684.05 48 $3,161.86 $4,189.90 60 $4,896.68 $6,502.99 a Pile depths: 30, 40, 50, and 60 ft equal to 9.14, 12.19, 15.24, 18.29 m, respectively. b Diameter: 18, 30, 48, and 60 in. equal to 0.46, 0.76, 1.22, and 1.53 m, respectively.
$800.58 $2,085.63 $5,217.94 $8,109.31
$945.14 $2,487.21 $6,245.98 $9,715.62
WMSC: Wet method in soil using case
the project of clay soil but the wet method can be used for all of them, the contractor decided to use the wet method for 36 holes of the clay soil project and the dry method for the rest due to the water table. How many holes/day, cubic yards/day, and linear feet/day can the contractor do in each project? How many days will the contractor take to perform the three projects? Compare the results of both parts?
Solution
holes use the dry method. Drilling time does not depend on the construction method because it affects only the pouring tool that can be used. Therefore, the drilling time will be the same for both dry and wet methods. According to Fig. 2, drilling time is 22.67, 17.98, 13.68, or 9.94 min/hole using 0.92, 1.22, 1.53, and 1.83 m 共3, 4, 5, or 6 ft.兲 auger height, respectively. Hence, this project needs the piling machine for 5, 4, 3, or 3 days, respectively. Table 10 shows the calculation of these values. Hence, the drilling time value per day is calculated in the following equation:
Based on the set of charts developed, the drilling time for the machine in each project is calculated as follows. Project (1) This project has 105 holes with 12.19 m 共40 ft.兲 depth in clay soil. The first 36 holes use the wet method while the other 69
Fig. 5. Dry method soil uncased/wet method soil slurry construction methods costs
project drilling time =
N ⫻ TDT 共days兲 60 ⫻ WH
共9兲
Fig. 6. Dry method soil uncased/wet method soil slurry construction methods costs
JOURNAL OF CONSTRUCTION ENGINEERING AND MANAGEMENT © ASCE / JULY 2005 / 787
Table 10. Drilling Time for Illustrative Example Project number
Number of holes
Drilling time per hole 共min兲b
Deptha 共ft兲
Auger 3 ft
Auger 4 ft
Auger 5 ft
Total drilling time 共day兲b Auger 6 ft
Auger 3 ft
Auger 4 ft
Auger 5 ft
Auger 6 ft
5.0 8.4 5.9
3.9 7.1 5.3
3.0 5.8 4.6
2.2 4.5 3.9
1 105 40 22.67 17.98 13.68 9.94 2 149 50 27 22.8 18.61 14.42 3 86 60 33.14 29.31 25.48 21.64 a Pile depths: 30, 40, 50, and 60 ft equal to 9.14, 12.19, 15.24, 18.29 m, respectively. b Auger heights: 3, 4, 5, and 6 ft equal to 0.92, 1.22, 1.53, and 1.83 m, respectively.
Table 11. Productivity in Holes/Day
Method Wet
Project number
Number of holes
Deptha 共ft兲
1
36
40
2
149
3
86
Productivity 共holes/day兲 in clay soilb Auger 3 ft
Auger 4 ft
Auger 5 ft
Total pilling process time 共days兲b
Auger 6 ft
Auger 3 ft
Auger 4 ft
Auger 5 ft
Auger 6 ft
7.86 8.69 9.33 10.36 Productivity 共holes/day兲 in middle soil
4.6
4.1
3.9
3.5
50
6.51
22.9
20.2
18.1
16.3
60
6.18
13.9
12.1
10.7
9.6
7.38 8.25 9.13 Productivity 共holes/day兲 in sand soil 7.1
8.02
8.95
Productivity 共holes/day兲 in clay soil Dry 1 69 40 9.96 10.55 11.14 Pile depths: 30, 40, 50, and 60 ft equal to 9.14, 12.19, 15.24, 18.29 m, respectively. b Auger Heights: 3, 4, 5, and 6 ft equal to 0.92, 1.22, 1.53, and 1.83 m, respectively.
Total pilling process time 共days兲
11.74
6.9
6.5
6.2
5.9
a
Table 12. Productivity in Cubic Yards or Linear Foot/Day
Method Wet
Productivity 共yd3 / day兲 in clay soilb
Productivity 共ft/day兲 in clay soilb
Project number
Number of holes
Deptha 共ft兲
1
36
40
20.6 22.8 24.4 27.1 Productivity 共yd3 / day兲 in middle soil
314
348 373 414 Productivity 共ft/day兲 in middle soil
2
149
50
21.3
326
369 413 457 Productivity 共ft/day兲 in sand soil
3
86
60
24.3
Auger 3 ft
Auger 4 ft
Auger 5 ft
Auger 6 ft
Auger 3 ft
24.2 27.0 29.9 Productivity 共yd3 / day兲 in sand soil 27.9
31.5
35.1
371
Productivity 共yd / day兲 in clay soil
426
Auger 5 ft
Auger 6 ft
481
537
Productivity 共ft/day兲 in clay soil
3
Dry 1 69 40 26.1 27.6 29.2 Pile depths: 30, 40, 50, and 60 ft equal to 9.14, 12.19, 15.24, 18.29 m, respectively. b Auger heights: 3, 4, 5, and 6 ft equal to 0.92, 1.22, 1.53, and 1.83 m, respectively.
Auger 4 ft
30.7
398
422
446
470
a
where TDT= total drilling time and WH= working hours/day. Then, the outcome of project drilling time is calculated using Eq. 共9兲 is as follows: 关105共holes兲 ⫻ 22共min/hole兲兴 = 5 days project drilling time = 关60共min/h兲 ⫻ 8共h/day兲兴 Then, the machine is needed for 5 working days in the site considering the above-mentioned conditions. Project (2) This project has 149 holes with 50 ft. depth in middle soil. Drilling time is 27, 22.8, 18.61, or 14.42 min per hole using 共0.92, 1.22, 1.53, and 1.83 m 共3, 4, 5, or 6 ft.兲 auger height, respectively. Hence, this project needs the piling machine for 9, 8, 6, or 5 days,
respectively. Table 10 shows the calculation of these values using 3 ft. auger height is calculated using Eq. 共9兲 as follows: project drilling time =
关149共holes兲 ⫻ 26.93共min/hole兲兴 = 9 days 关60共min/h兲 ⫻ 8共h/day兲兴
Then, the machine is needed for 9 working days in the site under the conditions considered. Project (3) This project has 86 holes with 60 ft. depth in sand soil. Drilling time is 33.14, 29.31, 25.48, or 21.64 min/hole using 0.92, 1.22, 1.53, and, 1.83 m 共3, 4, 5, or 6 ft.兲 auger height, respectively. Hence, this project needs the piling machine for 6, 6, 5, or 4 days,
788 / JOURNAL OF CONSTRUCTION ENGINEERING AND MANAGEMENT © ASCE / JULY 2005
respectively. Table 10 shows the calculation of these values. Accordingly, the project manager has the flexibility to select the convenient auger height and time that the machine is required on the site. Furthermore, the technical office of the company can plan its piling machines time among different sites. Based on productivity figures, the machine productivity is calculated as follows. 1. Project (1): This project has 105 holes with 40 ft. depth in clay soil. The first 36 holes use the wet method while the other 69 holes use the dry method. Fig. 2 shows that productivity of constructing piles of diameter 0.46 m 共18 in.兲 with 40 ft. depth is 9.96, 10.55, 11.14, and 11.74 holes/ day for the dry method and 7.86, 8.69, 9.33, and 10.36 holes/ day for the wet method using 0.92, 1.22, 1.53, and 1.83 m 共3, 4, 5, and 6 ft.兲 auger height, respectively. Table 11 shows productivity and time calculations for the three projects. Hence, this project will be accomplished using wet method in 36 holes, which take 5, 5, 4, or 4 days using 0.92, 1.22, 1.53, and 1.83 m 共3, 4, 5, or 6 ft.兲 auger height, respectively. Furthermore, the other 69 holes that have to be accomplished using the dry method will take 7, 7, 7, or 6 days to complete 12, 12, 11, or 10 days for the 105 holes in Project 共1兲. The total piling process time in days is calculated as follows: piling process time = N/Pr
2.
3.
共10兲
The application of Eq. 共10兲 is indicated in Table 11 which shows the productivity corresponding to the required depth in each project using different auger heights and construction methods. The total pile installation duration 共TD兲 consists of the drilling time using the piling machine and the other activities’ times that are accomplished using a crane. Therefore, this time represents the TD that the contractor needs to spend in each project. It is a good tool that can be used to estimate the project duration from a piling contractor perspective. Project (2): This project has 149 holes with a 50 ft. depth in the middle soil. Productivity is 6.51, 7.38, 8.25, or 9.13 holes/ day using 0.92, 1.22, 1.53, and 1.83 m 共3, 4, 5, or 6 ft.兲 auger height, respectively. Hence, this project needs TD of 23, 21, 19, or 17 days to be accomplished using 0.92, 1.22, 1.53, and, 1.83 m 共3, 4, 5, or 6 ft.兲 auger height, respectively, as shown in Table 11. Project (3): This project has 86 holes with 18.29 m 共60 ft.兲 depth in sand soil. Productivity is 6.18, 7.10, 8.02, or 8.95 holes/ day using 0.92, 1.22, 1.53, and, 1.83 m 共3, 4, 5, or 6 ft.兲 auger height, respectively. Hence, this project needs the piling process time of 14, 13, 11, or 10 days respectively, as shown in Table 11. The corresponding productivity in cubic yards/day or linear foot/day is indicated in Table 12.
Conclusions To assess piling process productivity, cycle time, and cost, a regression technique is used to designate several regression models. Fifty two regression models were designed to assess the piling process productivity and cycle time. These models have been validated to assure their appropriateness in the assessment process. The concept of VF has been designed to check the level of fit for these models. The value of VF for more than 52% of the designated models’ outputs is approximately 95% accuracy. Consequently, 83% of the models outputs have been predicted with more than 90% accuracy.
Several sets of charts that represent productivity, cycle times, and cost have been developed. A comprehensive discussion of the application of these regression models to productivity, cycle time, and cost is available in Zayed 共2001兲. This research is relevant to both industry practitioners and researchers. It provides sets of charts and models for practitioners’ usage to schedule and price out pile construction projects. In addition, it provides the researchers with the methodology of designing regression models for pile construction process, its limitations, and future suggestions.
Notation The following symbols are used in this paper: CP ⫽ collected productivity; D ⫽ pile depth 共ft兲; DCl ⫽ drilling cost per cubic yard for different methods l 共$ / yd3兲; N ⫽ number of pile holes; PC ⫽ pouring cost per cubic yard for concrete 共$ / yd3兲; PMR ⫽ productivity model result; Pr ⫽ productivity per day; RC ⫽ rebar cage placing cost 共$/hole兲; TCl ⫽ total pile’s cost for different methods l 共$/hole兲; TDT ⫽ total drilling time; VF ⫽ validation factor; WH ⫽ working hours per day; X1 ⫽ depth 共ft兲 as regression variable; X2 ⫽ Auger height 共ft兲 as regression variable; and ⫽ pile diameter 共ft兲;
Subscripts and Superscripts i ⫽ 1 , 2 , 3 , . . . , n; l ⫽ different construction methods 共dry method in soil uncased, dry method in soil using case, wet method in soil using slurry, and wet method in soil using case兲. l = 1, 2, 3, and 4; p ⫽ number of expressions 共number of variables plus intercept兲; and r ⫽ number of different depths, r = 1 , 2 , 3 , 4 for 30, 40, 50, and 60 ft. 共12.19, 15.24, and 18.29 m兲 depths, respectively.
References Mahoney, W. D. 共2000兲. Means construction cost data, R. S. Means, Kingston, Mass. Neter, J., Kutner, M. H., Nachtsheim, C. J., and Wasserman, W. 共1996兲. Applied linear statistical models, IRWIN, McGraw-Hill, New York. Peurifoy, R. L., Ledbetter, W. L., and Schexnayder, C. J. 共2002兲. Construction, planning, equipment, and methods, 6th Ed., McGraw-Hill, New York. Reese, L. C., and O’Neill, M. W. 共1988兲. “Drilled shafts: Construction procedures and design methods.” FHWA.HI-88-042, ADSC-TL-4. Zayed, T. M. 共2001兲. “Assessment of productivity for concrete bored pile construction.” PhD thesis, School of Civil Engineering, Purdue Univ., West Lafayette, Ind. Zayed, T. M., and Halpin, D. W. 共2004兲. “Process versus data oriented techniques in pile construction productivity assessment.” J. Constr. Eng. Manage., 130共4兲, 490–499.
JOURNAL OF CONSTRUCTION ENGINEERING AND MANAGEMENT © ASCE / JULY 2005 / 789