AbstractâIn order to support a software development team in its day-to-day operations ..... via an initial application of page rank with α = 1 along the edges of the ...
Profile Mining in CVS-Logs and Face-to-Face Contacts for Recommending Software Developers Bjoern-Elmar Macek, Martin Atzmueller, and Gerd Stumme Knowledge and Data Engineering Group (KDE), University of Kassel, Germany {macek, atzmueller, stumme}@cs.uni-kassel.de
Abstract—In order to support a software development team in its day-to-day operations, different data sources can be exploited. In this paper, we focus on CVS logs and communication profiles between developers provided by RFID-proximity information. We provide a novel approach for combining the data sources into a graph, and apply the pagerank algorithm for capturing interesting knowledge about resource and developer profiles. Additionally, we discuss the application in the software developer setting, and also for project management. The proposed approach is evaluated in the context of a real-world developer setting.
I. I NTRODUCTION Knowledge and experience management play a significant role in software development teams: On the one hand, specific profiles of developers concerning resources, packages, and projects provide an overview on the area that the respective developer is working on, e.g., for an overview on the activity of a team. On the other hand, resource profiles, i.e., characterizations about the familiarity of developers with specific resources, can increase the effectiveness of other team members by suggesting persons that are familiar with specific resources. In this way, knowledge management and knowledge transfer, e.g., transfer of projects, instructing new team members, or participation in open-source projects, can be successfully implemented. In this paper, we propose an approach for analyzing the communication and commit structure of a development group using reality mining techniques. In this context, the development group uses CVS as a code versioning system; additionally, conversations between developers are captured using active RFID tags developed by the SocioPatterns1 consortium. Using the tags, we are able to store the time and duration of a conversation, so that this information can be analyzed further. In the sketched scenario, the two basic assumptions are the following: The added and removed lines of code (LOC) that a developer commits for a specific resources serves as a proxy for her familiarity with this specific portion of code, e.g., [12], [15]. Additionally, conversations between developers serve as a way for transferring information or knowledge from one developer to another. Therefore, such interactions also help to increase the familiarity of developers with the source code. We provide two novel classes of graphs built from structural data for mining developer and resource profiles concerning the ’familiarity’ with specific resources, packages and/or projects. By defining a special query on these graphs, we can calculate 1 http://www.sociopatterns.org
either a set of developers that are familiar with a specific portion of source code, or we can analyse the quality of code coverage by a given subgroup of software developers. The proposed method is able to retrieve two sorts of profiles: Developer profiles, including the top-k resources for each developer, and a set of the top-k developers for a certain resource, package, or project denoting the familiarity with the code element, as a recommendation. Utilizing the graph structure, the PageRank [6] algorithm is applied for extracting these profiles. To the best of the authors’ knowledge, this is the first time, that PageRank has been applied for this purpose. Furthermore, as another novel element we apply RFID-based technology (described above) for modeling the real-life communication. This enables the capture of conceptual knowledge which is mostly propagated via conversations and cannot be extracted by mining software repositories. We evaluate the approach in the context of a small developer group with a medium sized project, including both software repository logs and RFID contact information. The evaluation results demonstrate the effectiveness and impact of the proposed approach. The rest of the paper is structured as follows: Section II discusses related work. After that, Section III presents the proposed method for mining developer and resource profiles. Next, Section IV describes its application for profiling and recommendation. In Section V we present an evaluation of the proposed approach. Finally, Section VI concludes with a summary and interesting directions for future work. II. R ELATED W ORK In [16] and [7], Cattuto et al. analyze the social graph structures constructed by the contact and location information, which were generated by the active RFID tags, that were also used in our scenario. We apply the same technology which was developed within the Sociopatterns project to interpret RFID proximity signals as conversation and location information. Several approaches like [22], [11] use email communication protocols to measure expertise and detect flow of expertise information, but any other medium that is appropriate in terms of privacy and explanatory power can of course be used, too. In the following we focus on face-to-face communication, because we think, that most of the relevant conversations within a local development group is made directly and not via email.
There are several different approaches trying to solve the problem of finding help for a software development related problem. Minto and Murphy [20] exploit the information, that several files might be related to each other if they are checked in together often. Let d be the developer in need of help, then the introduced algorithmn produces a ranking of the developers, in which those persons score high, that committed to the same or related files as d often. This indicates, that they already know how to help each other quite well. But the ranking produced is obviously independent from the problem itself and does not provide good recommendations, if d needs information from someone working on a completely distinct set of code. We try to overcome this issue by taking the problem related files into account for a recommendation. In [12], Girba et al. detect and visualize different phases of software collaboration using line-of-code-based measures derived from a code repository. Those phases can be easily identified by interpreting the activity diagrams presented, but require manual reviewing by an expert to enable him or her to produce some kind of valid recommendation for assigning a development task to a well suited developer. Lappas et al [17] present a social network based approach by defining the team formation problem, that uses profile information of team members containing the set of skills they have. A solution contains those persons that together as a group meet all requirements for the given task. To maximize the social compatibility of the team members, they minimize the communication cost between developers, a measure that was introduced to capture social information. There was no explicit definition or case study given for this measure. In [18], McDonald and Ackerman investigate the process of knowledge transfer in a working team. They describe the personal process of deciding which person can help best in two phases: expertise identification and selection. In the first phase you determine the people who can help you. In the second you choose among them. In this paper, we identify experts directly by analyzing the face-to-face contact logs, instead of predicting it from a set of personal attributes. III. M ETHOD A. Repository Preliminaries A Concurrent Version System (CVS) supports software development by storing and managing all submitted source code changes. The process of submitting work is also called commit or activity. In order to measure the size of the commit, we define the number of changed lines of code as the sum of added and removed lines of code. As in every ordinary file system, the files contained within a CVS project are grouped together by a folder hierarchy, which resembles a tree, in the following named resource tree GR . A part of the complete pathname is interpreted in Java projects as the name of something called package. These packages provide a unique namespace for the files they contain and are represented as nodes within GR . For our use case Conferator, the package eu.ubicon of the project ubicondb would be represented as a node in the hierarchy tree with the name
��������
����� !
��
������
�" #"$�%
� � ��
� ��
�&��%
������� �
Fig. 1.
����� � � ����� �
����������� �� �
������ � � �� �
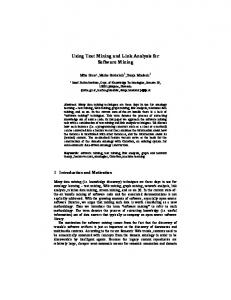
Resource Tree of Project ubicondb.
ubicon and a parent with the name eu. We exemplify the structure introduced in Figure 1. The complete pathname of a package is defined for our purposes as the project name followed by a dot and the respective package name: e.g. ubicondb.eu.ubicon. The complete pathname of a file equals its name appended to the complete pathname of the package it is contained in. We denote by F the set of all files, by P C the set of all packages and by P J the set of all projects. A resource is either a file, a package or a project and we define the set of all re· C ∪P · J. We denote by ≥ the partial order sources by R = F ∪P on R that is induced by the project/package/subpackage/file relation: We write r ≥ r0 if r0 is a file, subpackage or package that is contained in r. We write r � r0 if r > r0 and there is no package r00 with r > r00 > r0 . Definition 1 (Activity): An activity a ∈ A is an entity with the properties a.dev, a.file and a.ts ∈ D, where a.file is the modified file and a.dev is the developer who committed modifications to the repository. The timestamp of the commit is contained in a.ts. Given an activity a, the function loc(a) returns the total number of changed lines of code, which equals the sum of changed, added and removed lines. Definition 2 (Commit Relevant Activities): The commit relevant activities Ad,r for developer d ∈ D and resource r ∈ R are defined as follows: Ad,r = {a ∈ A | a.file ≤ r, a.dev = d} So Ad,r represents all CVS activities that changed a file f ≤ r and were submitted by developer d. We formally extend the order relation between resources to developers by f � d ⇐⇒ Ad,f 6= ∅
Definition 3 (Commit Sizes): For every r ∈ R the function loc(r) returns the total number of changed lines of code, which were committed to r or any of its successors. X loc(r) = loc(a) a|a.file≺r
The commit size function loc(d, f ) returns for developer d ∈ D and file f ∈ F the total number of LOC, that d changed in f: X loc(d, f ) = loc(a) a∈Ad,f
With these definitions given, we construct two types of weighted graphs on R ∪ D: the dependency and the contribution graph. The higher the weight on edge (v1 , v2 ), the higher v1 ’s dependency on or contribution to v2 . This will be used in Section IV to model the flow of endogenous and exogenous information through the graph. We speak about the first, when information is created via knowledge transfer within a group, and the latter, if experience is gained outside the social network: via programming in our case. Fig. 2. Dependency graph for an example project with edges from seven files to three developers.
B. Dependency Graph A dependency graph GD consists of resource and developer nodes. Since the edges of the graph represent members of the depends relation, we discuss for both cases, how an edge is to be interpreted and how the weight is to be calculated. A resource r directly depends on another resource r0 , if r � r . We define the strength of the dependency as the fraction: 0
depends(r, r0 ) =
loc(r0 ) loc(r)
In other words, depends(r, r0 ) equates to the percentage of developer activity in child resource r0 compared to the total activity in the parent resource r. Intuitively, a file f depends on a developer d, if d committed changes to f . We measure the amount of dependency as follows: loc(d, f ) depends(f, d) = loc(f )
Concerning the edges from developer to file nodes it is an intuitive way to choose the value contributes(d, f ) proportional to the LOC that a developer changed of a file f : loc(d, f ) 0 d0 ∈D loc(d , f )
contributes(d, f ) = P
For every resource in GR there exists at most one parent node. So every resource contributes with a normalized value of 1 to its parent. ( 1, if r2 � r1 contributes(r1 , r2 ) = 0, else The contribution graph is formally defined as the graph GC = (R ∪ D, ≺) with edge weights defined by contributes. An example of the resulting graph is shown in Figure 3.
So the dependency graph is formally defined as the weighted, directed graph GD = (R ∪ D, �) with edge weights given by depends. It is easy to see, that the sum of weights of all outgoing edges for every resource node equals 1. The outdegree of the developer vertexes is 0. In Figure 2 a hypothetical example is given. This definition and all further applications can be extended to contain more than only one resource tree.
D. Communication Preliminaries
C. Contribution Graph
The quality of the heuristic for determining code-relevant conversations among the set of all conversations has a great impact on the quality of the application results. As the RFID technology that we applied does not register the content of a
The contribution graph GC consists of the same nodes as GD . The directions of the edges are inverted, and the weight of an edge is now defined by its contribution value contributes.
Another important part of our graph model is that we capture the flow of information that occurs during conversations. Definition 4 (Conversation): A conversation c ∈ C is an object, where c.dev = (d1 , d2 ) ∈ D × D states the two developers in conversation, c.from the timestamp of the beginning of the conversation and c.til of its ending.
Let r be the investigated resource, then based on the commitrelevant conversations concerning r and its child resources, we define the communication relation ←: d1 ← d2 ⇐⇒ C(d1 ,d2 ),r 6= ∅ We also write d2 → d1 if d1 ← d2 . The resulting graphs are denoted as G∗D = (R ∪ D, � ∪ ←), G∗C = (R ∪ D, ≺ ∪ →). As these graphs depend on the resource tree and the commitrelevant contacts, which both depend on the inspected resource r ∈ R, G∗D , G∗C are also defined with respect to r. The role associated with d1 is the one who needs help, while d2 is a person who might provide it. Next we define the commit relevant conversation duration function duration as follows: X c.til − c.from duration(d1 , d2 , r) = c∈C(d1 ,d2 ),r
We represent the conversation information in the graph by creating weights for the directed edges between the developer nodes based on the duration function. Fig. 3. Contribution graph for an example project with edges going from the bottom to the top.
conversation, we have to estimate its code-relevancy by its time and its duration. If one takes into account all contacts one will also include all the conversations, that are of a more social and less technical and work related nature. We assume, that for discussing a code relevant topic, you need to talk for at least five minutes with the person, who can help you, because shorter conversations can hardly include a remarkable amount of information about a piece of code, that was written by members of the development team. This is assumption A1 . We also assume, that most of the code relevant topics come up when people need help with something they are currently working and committing on (A2 ). Based on A2 , we define the commit relevant conversations. Since the duration of a working day is generally about eight hours, we define the interval of interest for code relevant communication, in which the percentage of code relevant topics is most probably at its peak, to the eight hours before a commit. Definition 5 (Commit-relevant conversations): The set of commit-relevant conversations C(d1 ,d2 ),r for a given pair of developers (d1 , d2 ) and resource r is defined as the subset of C containing all conversations within eight hours before a commit of a file f ≤ r performed by d1 . C(d1 ,d2 ),r = {c ∈ C |c.dev = (d1 , d2 ), c.til − c.from ≥ 5min c.from ∈ ∪a∈Ad1 ,r [a.ts − 8h, a.ts]} The set S of all commit-relevant conversations is then Cr = d1 ,d2 ∈D C(d1 ,d2 ),r .
E. SNA - Communication Edges There are several ways to model the flow of information via communication and a lot of them may make sense here. Because of A2 we assume, that during the time interval of a working day before a commit the percentage of development related conversations is at its peak and so is statistically most significant. We assume A2 is close to the truth for a lot of teams. A measure that certainly differs for several teams in science and economy is the amount of knowledge transfered within the groups. Some groups consist of more social people than others and their conversation topics may be more diverse. Because of this, we introduce the knowledge transfer rate φ ∈ R+ , 0 ≤ φ < 1, which is a parameter of this communication model. The higher it is, the more collaborative is the team and the more time is spent on knowledge transfer. For G∗D and G∗C we extend the weight defining functions for conversation edges as follows:
depends(d1 , d2 ) =
contributes(d1 , d2 ) =
1 − φ, φ ·
Pduration(d1 ,d2 ,r) , d∈D duration(d,h,r)
0 φ ·
if d1 = d2 else if d1 = d2
P duration(d2 ,d1 ,r) , d∈D duration(d,d1 ,r)
else
In G∗C , our construction yields outgoing edges from developers to two kinds of nodes: to the files they committed on and to the developers, who were asked for help. The weight for the edges between the developers sums up to φ, while we defined the weights of the other kind in such a way, that the sum of outgoing edges is 1. We multiply those weights with 1 − φ in order to ensure the property of the adjacency matrix
dependency or contribution during one iteration of PageRank, it is reduced by the factor α, so that the same package after i jumps is smaller by factor of αi , than it would be, if there was no damping factor. This has several implications for our applications. One of them, which applies for each of them, is the fact, that the transitive influence of communication is greatly reduced for an α close to 0. Because of our empirical results we chose α = 0.4. B. Recommender
Fig. 4. Communication edges between developers for φ = 0.1. The broken reflexive edges are added in G∗D , while the edges to the files exist in G∗C .
having a 1-norm of 1. So we modify contributes with d ∈ D and f ∈ F like this: contributes(d, f ) = (1 − φ) · P
loc(d, f ) 0 d0 ∈D loc(d , f )
Figure 4 illustrates the construction for our example. IV. A PPLICATIONS Because we will apply PageRank [6] on the graphs, we briefly recall its basics. A. Page rank preliminaries
In order to answer questions of the kind “Who can help me best with a development problem concerning resource r?” or “Who can fix this bug in resource r?”, we start the first of two phases. We create G∗D , then remove all edges between developers, and assign dependency to r ∈ R with the sum of all dependencies being 1. The probability is now propagated via an initial application of page rank with α = 1 along the edges of the resource tree to the developer nodes, which accumulate the dependency distributed from the files. The resulting distribution of probability over the developer nodes is assigned to the 2nd phase’s PageRank’s random surfer vector ~q, which again has a 1-norm of 1. In phase two we apply PageRank with α = 0.4 and the previously defined ~q until convergence. The developers propagate their CVS activity related probability values over the communication edges to the people who helped them, because the requested resource also depends on their knowledge. The higher the probability distribution for a developer d in G∗D , the higher the dependency of the queried set of resources on d. The ranking produced by sorting D descending according to the calculated distribution is interpreted as the order in which a recommender would present the developers to a user who is looking for help.
The equation describing one iteration is C. Profiler ~ei+1 = α · ~ei · W + (1 − α) · ~q, where ~ei is the probability distribution after i iterations of page rank (pr) with given damping factor α, the random surfer vector ~q and the edge weight matrix W. It is easy to see, that for all dependency and contribution graphs the adjacency matrix W has a 1-norm of 1. In the sequel, we will see, that the same is true for ~q, so that the result of the PageRank application can be interpreted as a probability distribution. In the following ~q is interpreted as a query vector and the produced rank is interpreted as dependency or contribution depending on which graph pr was applied to. Obviously ~ei+1 is defined as the linear combination of two terms td = ~ei · W and tq = ~q. The term td represents the process of distributing the probability of a node n to all its successors n0 ≺ n with respect to the weights w(n, n0 ) which are contained in W. The process of assigning probability to the nodes with respect to the surfer vector becomes manifest in tq . In [3], the effect of the damping factor α is analyzed, leading to the result, that for every edge traversal of a package of
The next application is an automated profiler, which is applied for a given developer d and a set of relevant resources R. For the first phase, we remove all edges (d, f ) ∈ ECr ∩ D × F between developers and files and apply PageRank to GCR with ~qi = 1, if i is the dimension of ~q that is associated with vertex d and ~qi = 0, else. The result is a contribution ranking, indicating how much d contributed to the work of his colleagues represented as a probability distribution over D. In phase two we return all previously removed edges and remove all communication edges. We derive the contribution of d to a given resource r ∈ R by summing the rank of all developers, who are predecessors of r in the resulting graph. These profiles can be used as input for algorithms like the one presented in [17] in the environment of development teams. This work targets the prediction of the productivenes of teams based on certain communication and team structure measures as well as a manually maintained set of skills. Our approach can be used to generate a profile containing the projects or modules, a developer is familiar with based on his contribution to them. Figure 5 shows a developer profile of the first author
Fig. 5. A developer profile of the Conferator use case. The size of the pieces of the pie chart indicate the relative amount of effort the developer has put into coding or helping others with the observed resources.
of this paper, that was generated using the contribution tree as discussed above. V. E VALUATION We now compare the page rank algorithm results with the ones we generate by creating a ranking dependent only on the number of committed line changes of the queried project over all developers. By comparing the different results with a ground truth we measure how much information can be gained by inspecting the influences of communication on the experience somebody has with a given set of code. A. Use Case - Conferator We evaluate our approach with the development of the first version of the social conference system Conferator [2], which enables the participants to create their personal schedule by picking talks, they are interested in, adding friends, sharing their social contact information and recalling the persons they met, by viewing their own contact history during the event, which gets automatically created by the same RFID technology that was used for our approach to capture conversations. The team consists of 10 developers, whose social and development activities were observed for about 3 months. There were about 9119 commits with 110770 changed lines of code in total. The number of observed conversations during that time is 65668. The system itself consists of nine Java based projects of several different kinds: RFID streaming processes, localization and contact recognition libraries as well as the web application front end.
you work together with them, we had to find a more respectful way with regard to privacy, that does not require the expert to order a list of people or directly choose between any two of them. After discussing the risen opinions to the possible social implications, all agreed on the following voting system. For every step of the process, four sets containing three developers will be presented to the expert as well as the name of a project. The expert is now required to choose one of those four sets, answering the question which of these threepeople-teams could help best with a problem concerning the given project. The expert has also the possibility to take none of them, if he or she is uncertain. If a team is elected, every member will gain one vote. At the end of the process, the ranking is produced by ordering the developers by the sum over all votes for every project. In order to provide a uniform distribution of developers over the teams, we created the set of all possible team and project combinations to rule out artifacts in the data like the following: if someone with high experience with the queried source code is too often presented to the voting expert together in one team with somebody with low or none experience, the low experienced developer is ranked too high. The first team is uniformly sampled without replacement from the set of all possible teams. The next three are chosen the same way, but from the subset, containing only those teams with the same project associated as the first one. This ensures, that all combinations are presented before one team gets picked more often by chance, while other developers are totally underrepresented. As soon as no teams can be drawn from the set, it gets refilled. The total number of casted team-votes from 8 experts was 247 so that the total count of developer votes is 741 in our use case. Definition 6 (Ranking rloc): The LOC based ranking rloc for a queried resource r is created as follows: X rlocr (d) = loc(d, f ) f ∈F :r≤f
Since this ranking can only recommend people based on their commits, non-committing team members will never be included within an rloc ranking. Since there are several projects, where only very few people committed code, which results into very short rankings and low overall significance, the developers who obtained the ranking value 0 are ordered by their total amount of committed LOC in all resources. Definition 7 (Ranking pr): The contact and LOC based ranking pr is produced via n iterations of PageRank on a dependency graph GD for a queried resource r.
B. Ground Truth As ground truth, we rely on an expert ranking, that can take more external unprotocoled information into account. In the evaluated Conferator case, all developers are part of the same research team. Its members at the same time are part of both groups: the experts and the ones being rated. Since rating and ranking people is a socially challenging task, especially if
The problem with 0-ranked developers (as it applies for rloc) occurs very seldom for pr, because the communication structure is so dense, that is very unlikely, that there exists no path from a committing to a non-committing developer. In general one should choose the number of iterations n greater than the length of the longest path in GD to make sure the
�� ��
��
��
��
��
� ��� ����
Fig. 7. The plot of τ comparing rloc and pr with the ground truth for all projects. The projects are sorted in ascending order over their value τ (prP , gtP ) − τ (rlocP , gtP ).
probability gets distributed over all edges. Normally finding the longest path in a graph is an NP hard problem, but since GD mainly consists of a forest whose |D| leafes are connected with each other, the longest path can be approximated with |D|. In our experiments we used n = 20, because as already mentioned before, there are 10 developers (|D| = 10) within the Conferator team. Of course the termination parameter � of page rank can also be used. C. The Surplus of Communication The target application of the page rank algorithm on the dependency graph is to assign priorities to developers for a recommender. Therefore, we calculated the top-k precision values preck for our previously discussed ground truth gt, every project p ∈ P J and recommender ranking ra, with ra(i) > ra(j), i < j: S S |( 1≤i≤k rap (i)) ∩ ( 1≤i≤k gtp (i))| preck (rap ) = k Figure 6 illustrates the obtained results. As shown in the figure, the top-1 precision values of both recommenders are the same: they detect the best recommendation in 79 of all cases, which intuitively makes sense, since the top committer certainly do have the most experience with the queried set of code. For k = 3 the pr ranking outperforms rloc in 31 of all cases; otherwise, it is at least as good as rloc. For peerRadar-webapp, rloc could provide a better result top5, while pr is more similar to the ground truth in nearly half of the projects. We also applied Kendall’s τ to our rankings and computed the p-value. Kendall’s τ ranges from −1, meaning the compared rankings are inversely correlated, to 1, which means that they are positively correlated. The plots of τ are given in Figure 7. We can see, that pr is closer to the ground truth than rloc for five of the nine projects, while in two cases rloc produces a closer ranking. Another measure for relatedness is the p-value, that determines, if the null hypothesis ”the given rankings are uncorrelated”, can be rejected, which is the case, if p is smaller than 5%. Alltogether, seven of the pr rankings are significantly correlated with the ground truth, while this also applies for four of the nine rloc rankings. As discussed above the interpretations of the top-k precision and the corresponding τ and p-values obviously both speak for pr.
� ��� ����
Fig. 8. The plot of the p-value. Statistical significant relatedness to the ground truth is proven for all rankings with the appropriate value under the dotted red mark at 5%.
As a summary it can be said, that for our use case pr outperformed rloc in the majority of recommender queries for all measures applied. This indicates, that conversation logs indeed carry important information. VI. C ONCLUSIONS In this paper, we have presented an approach for analyzing the communication and commit structure of a development group using reality mining techniques. We proposed two graph models that capture the information collected by mining software repositories combined with the analysis of RFID logs of human face-to-face contacts. These models enable profiling and recommendation applications for software developers. As shown in the evaluation, the explanatory and predictive power of exogenous experience captured by CVS logs combined with the endogenous flow of experience captured by logged communication yields very promising results for future use cases. Of course other sources of data can be used in very similar ways such as SVN, GIT or other versioning systems. It is also possible to use email, chat logs or other kinds of communication protocols to model knowledge transfer, but since this kind of information has different properties and can even be exploited by analyzing the content of a conversation, the creation of edges should also differ from our proposed approach. In the future, we aim to address the questions of further evaluation as well as allowing a finer resource granularity on the function level, which enables us to add call graph edges between nodes of different resources. We expect, that by adding this relationship, the result of the queries will capture the knowledge of a developer about how to use the code somebody else has written, which also is of great importance for a more complete picture of a developer’s experience with software. Although the rankings produced by our applications did not vary too much by changing α, we aim to explore this issue further. Also, it seems also very promising to personalize the modelled communication behaviour by defining φ for every pair of developers in order to capture the individual development relatedness of their conversations. Furthermore, we plan to generate rankings using sliding windows for identifying phases of collaboration as presented in [12] in order to support project managers in their work.
����
����
����
���� ��
������������ ���
�� �������� ���
Fig. 6.
�� �������� � � � � ������� ������ ���
� �������
����� � ������� ����������
� �����
� ������� �������
�� � ������������� ���
The top-k (k =1, 3 and 5) precision values for the rankings pr and rloc on all projects.
VII. ACKNOWLEDGMENTS This work has been supported by the VENUS research cluster at the interdisciplinary Research Center for Information System Design (ITeG) at Kassel University. We utilized active RFID technology which was developed within the SocioPatterns project, whose generous support we kindly acknowledge. Our particular thanks go the SocioPatterns team, especially to Ciro Cattuto, who enabled access to the Sociopatterns technology, and who supported us with valuable information concerning the setup of the RFID technology. R EFERENCES [1] O. Arafat and D. Riehle. The commit size distribution of open source software. In HICSS, pages 1–8. IEEE Computer Society, 2009. [2] M. Atzmueller, D. Benz, S. Doerfel, A. Hotho, R. J¨aschke, B. E. Macek, F. Mitzlaff, C. Scholz, , and G. Stumme. Enhancing Social Interactions at Conferences. it - Information Technology, 53(3):101–107, 2011. [3] R. Baeza-Yates, P. Boldi, and C. Castillo. Generalizing pagerank: damping functions for link-based ranking algorithms. In Proceedings of the 29th annual international ACM SIGIR conference on Research and development in information retrieval, SIGIR ’06, pages 308–315, New York, NY, USA, 2006. ACM. [4] O. Baysal and A. J. Malton. Correlating social interactions to release history during software evolution. In Proceedings of the Fourth International Workshop on Mining Software Repositories, MSR ’07, pages 7–, Washington, DC, USA, 2007. IEEE Computer Society. [5] C. Bird, A. Gourley, P. Devanbu, M. Gertz, and A. Swaminathan. Mining email social networks. In Proceedings of the 2006 international workshop on Mining software repositories, MSR ’06, pages 137–143, New York, NY, USA, 2006. ACM. [6] S. Brin and L. Page. The Anatomy of a Large-Scale Hypertextual Web Search Engine. Computer Networks and ISDN Systems, 30:107–117, 1998. [7] C. Cattuto, W. V. den Broeck, A. Barrat, V. Colizza, J.-F. Pinton, and A. Vespignani. Dynamics of person-to-person interactions from distributed rfid sensor networks. CoRR, abs/1007.3680, 2010. [8] K. Crowston and J. Howison. The social structure of open source software development teams. In First Monday, 2003. [9] M. D’Ambros. Commit 2.0: enriching commit comments with visualization. In Proceedings of the 32nd ACM/IEEE International Conference on Software Engineering - Volume 2, ICSE ’10, pages 529–530, New York, NY, USA, 2010. ACM.
[10] C. R. de Souza, S. Quirk, E. Trainer, and D. F. Redmiles. Supporting collaborative software development through the visualization of sociotechnical dependencies. In Proceedings of the 2007 international ACM conference on Supporting group work, GROUP ’07, pages 147–156, New York, NY, USA, 2007. ACM. [11] B. Dom, I. Eiron, A. Cozzi, and Y. Zhang. Graph-based ranking algorithms for e-mail expertise analysis. In Proceedings of the 8th ACM SIGMOD workshop on Research issues in data mining and knowledge discovery, DMKD ’03, pages 42–48, New York, NY, USA, 2003. ACM. [12] T. Girba, A. Kuhn, M. Seeberger, and S. Ducasse. How developers drive software evolution. Principles of Software Evolution, International Workshop on, 0:113–122, 2005. [13] A. E. Hassan. The road ahead for mining software repositories. In Proceedings of the Future of Software Maintenance (FoSM) at the 24th IEEE International Conference on Software Maintenance (ICSM), 2008. [14] A. E. Hassan and R. C. Holt. Predicting change propagation in software systems. In Proceedings of the 20th IEEE International Conference on Software Maintenance, pages 284–293, Washington, DC, USA, 2004. IEEE Computer Society. [15] A. Hindle, D. M. German, and R. Holt. What do large commits tell us?: a taxonomical study of large commits. In Proceedings of the 2008 international working conference on Mining software repositories, MSR ’08, pages 99–108, New York, NY, USA, 2008. ACM. [16] L. Isella, J. Stehle, A. Barrat, C. Cattuto, J.-F. P. Pinton, and W. V. den Broeck. What’s in a crowd? analysis of face-to-face behavioral networks, 2010. cite arxiv:1006.1260. [17] T. Lappas, K. Liu, and E. Terzi. Finding a team of experts in social networks. In Proceedings of the 15th ACM SIGKDD international conference on Knowledge discovery and data mining, KDD ’09, pages 467–476, New York, NY, USA, 2009. ACM. [18] D. Mcdonald and M. Ackermann. Just talk to me: A field study of expertise location, 1998. [19] D. W. McDonald and M. S. Ackerman. Expertise Recommender: A Flexible Recommendation System and Architecture. In Proc. 2000 ACM Conference on Computer Supported Cooperative Work, pages 231–240. ACM, 2000. [20] S. Minto and G. C. Murphy. Recommending emergent teams. In Proceedings of the Fourth International Workshop on Mining Software Repositories, MSR ’07, pages 5–, Washington, DC, USA, 2007. IEEE Computer Society. [21] M. E. J. Newman. Scientific collaboration networks. I. Network construction and fundamental results. Physical Review E, 64(1):016131+, June 2001. [22] L. Zenk and C. Stadtfeld. Dynamic organizations. how to measure evolution and change in organizations by analyzing email communication networks. Procedia Social and Behavioral Sciences, 4:14–25, 2010. [23] M. Zhou and A. Mockus. Growth of newcomer competence: challenges of globalization. In Proceedings of the FSE/SDP workshop on Future of software engineering research, FoSER ’10, pages 443–448, New York, NY, USA, 2010. ACM.