to setup hosts' behavior profiles of the observed IP nodes by clustering hosts into clusters of ... using collected and combined information freely available on the Web. ... flows we may get a list ten times less than the original list SrcIPs that initiate 90% ..... models and applications," Computer Communication Review. pp.
Profiling IP Hosts Based on Traffic Behavior Ahmad Jakalan, Jian Gong, Shangdong Liu School of Computer Science & Engineering, Southeast University, Nanjing, 210096, China
{ahmad, jgong, sdliu}@njnet.edu.cn Abstract The objective of this research is to study the behavior of IP Network nodes (IP hosts) from the prospective of their communication behavior patterns to setup hosts’ behavior profiles of the observed IP nodes by clustering hosts into clusters of similar communication behaviors. There are many potential applications of this work, the results of this research will be useful to the network management and Network security situation awareness in addition to the applications in studying the network user behavior. Keywords: Computer Network security, Host profiling, traffic profiling.
1.
Introduction
IP networks Host behaviour profiling refers to observing measured flow data from Internet backbone and extracting information which is representative of the communication behavior or usage patterns of the observed hosts. It is useful in understanding the behavior of the monitored network and in deriving guidelines of normal and abnormal activities within that context. IP Profiling at a large scale faces several challenges like the huge number of active hosts observable in the backbone traffic flows and the sporadically appearance of the observed hosts. Host profiling and clustering aims at identifying dominant and persistent hosts behaviours and creating groups with similar behaviours, this is very useful for many applications of Internet security such as Network Security Situational Awareness NSSA, DDoS defense, worm and virus detection, botnet detection, etc. For example worm infection or any attack on the network might cause a sharp change in the host’s behavior, so detecting attacks on the network will be easier if we can profile hosts behaviors so that sharp changes in hosts’ behaviours will be detected. This study is based on CERNET backbone data, but the method could be applied on general Internet traffic analysis.
2.
Related Works
Different researches appeared for profiling Internet traffic for different reasons, detecting network traffic anomalies was the main purpose of most of them. BLINC[1] identify application footprints in traffic streams by classifying traffic flows according to the applications that generated them. CAI Jun et al. [2]
measures the dynamic changes of host communities for the purpose of anomalous detection. Xu Kuai et al. [3, 4] identify common traffic profiles as well as anomalous behavior patterns based on behaviour profiles of Internet backbone traffic in terms of communication patterns of end-hosts and services. Xu Kuai et al. [5] characterize the behaviour of the significant clusters and groups the clusters into classes with distinct behavior patterns. Xu Kuai et al. [6, 7] applied spectral clustering algorithms on the one-mode projection of bipartite graphs to find the clustered behaviours of end hosts in the same network prefixes. Unsupervised data mining techniques were applied also for profiling end points[8, 9], Guillaume D et al. [8] applied minimum spanning tree (MST) clustering technique on nine dimensional feature space evaluating host Internet connectivity. Karagiannis et al. [9] build and continuously update activity graphlets that capture all the current flow activity, and then compress the large activity graphlets to retain only essential information which they called a profile graphlet. The infinite dimension of graphlets make it difficult to apply unsupervised clustering in addition to that only simple patterns can be identified while neither new class nor any mixture of traffic can be discovered. Songjie Wei et al. [10] applied Dice similarity function to calculate the similarity of hosts’ communications to create profiles and then used hierarchical clustering techniques on the profiles to build a dendrogram containing all the hosts. Vanessa F et al. [11] identify anomalous behavior where the behavior of a host raises an alert only when a group of host profiles with similar behavior (cluster of behavior profiles) detect the anomaly, rather than just relying on the host’s own behavior profile to raise the alert. The user behavior networks that connect users with servers across the Internet were studied in [12] to classify the clients into normal and abnormal communities. Many other works exist on profiling Internet backbone traffic [13-17] for profiling and classifying endpoints characteristics by extracting the information about endpoints from elsewhere using collected and combined information freely available on the Web. It is wellknown that the Internet traffic is heavy-tailed, most significant clusters will dominant the traffic behavior, so that the paper will concentrate on the behavior profiling of these most significant host clusters.
3.
Methodology
The main purpose to study the behavior of a single IP address is to be able to setup a profile of the IP addresses. The problem here is how to define the details of these profiles and which metrics needed. The content of this profile should be selected carefully to help the further work. The most important points should be considered when building this profile includes the data structure and the content of the profile, and how often it should be updated. Because it is not reasonable to setup a profile for each observed IP address, so they are classified. Classification or clustering of IP profiles will be based on their network traffic behavior to identify the service behind this IP address. Individual host’s behaviors could change over time but the profile of a legitimate host tends to fall into the same category for a moderately long time. Grouping hosts into categories is useful to
build models of legitimate Internet communications. These models will be useful in the detection of suspicious changes in the backbone traffic, which are usually a sign of an Internet-wide security problem. An accurate categorization of Internet hosts can help differentiate and identify malicious Internet hosts (and their users) from the mass of legitimate ones. Machine learning will be applied for clustering profiles. For machine learning approaches, feature selection is a very important step that needs to be specific to the problem. A combination of features will be used, some of them are directly extracted features, and others are calculated from the collected features using simple calculations or statistical analysis or obtained after applying techniques from the information theory. It’s not possible to study all IP addresses or all clusters obtained, so the attention of study will be focused on the most significant IP addresses that initiate most of the observed traffic, and we want to study them over a long enough period of one hour to get more representative and reliable profiles.
4.
Extraction of the most significant IP addresses
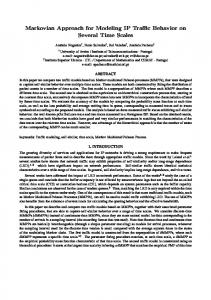
It’s not possible to profile every IP address appears over the internet, even each IP address in the trace, so we focus on the most significant IP addresses. We adopted a cost effective method to extract the most active IP addresses that initiate most of the flows in the trace. We have found that excluding 10% of the flows will reduce the number of IP addresses that need to be analyzed in a very efficient way. Figure 1 shows the number of significant SrcIPs, DstIPs from the total and distinct number of IP addresses observed in the trace of one day within periods of one hour, and because our study focuses on active flows initiated by the IP address, so we extracted the significant SrcIPs. Let n denotes to total number of flows, m is the number of distinct elements of srcIPs, If 𝑋 = {𝑥1 , 𝑥2 , … , 𝑥𝑚 } is the complete list of distinct SrcIPs, let P( 𝑥𝑖 ) denotes the possibility of appearance of 𝑥𝑖 in the flows of the trace during the period of study. We select an epsilon value ε = 0.1 to exclude the srcIPs that initiate flows less than 10% of the total flows, and analyze IP addresses that initiate more than 90%. The remaining significant srcIPs S is the list of SrcIPs that initiate flows more than 90% of the total flows 𝑆 = {𝑥 | ∑ p(xi ) > 1 − 𝜀} As we notice in Figure 1 that for periods of one hour over one day, the maximum number of flows may reaches tens of millions with about one million of different source IP addresses. Figure 1 shows that if we exclude 10% of the flows we may get a list ten times less than the original list SrcIPs that initiate 90% of the total flows captured by Netflow. For our study, to get a more reliable and more reasonable results we have excluded 10% of flows and studied the 10% of SrcIPs that initiate more than 90% of the total flows.
500
Total Flows Sig_SrcIP_90%
Src_IP Sig_DstIP90%
23:00
21:00
19:00
17:00
15:00
13:00
11:00
09:00
07:00
05:00
03:00
5
01:00
50
time
10base log scale (Thousands)
5000
Dst_IP Sig_SrcIP_80%
Figure 1 a logarithmic scale to base 10 to display the significant clusters of interest of Source and destination IP addresses that initiate 90% and 80% of flows to the total number of IP addresses and the total number of flows over one day with periods of one hour
5.
Selection and extraction of communication pattern features
For the efficiency of processing and ease of interpretation we need to keep the number of feature space as low as possible, but on the other side to allow the discrimination of different host behaviors it should present host behavior carrying rich enough information. Our focus will be on active communication initiated by the profiled host. We found the following features are the most important to represent host behavior communication patterns: 1. Number of peers (or the count of unique Destination IP addresses): IP addresses to which at least one packet is sent from this IP. This feature distinguishes the host community of peers that receive traffic from this IP. The importance of this feature comes from that this feature distinguishes one-to-one communications (like P2P or downloads) from one-to-several (web browsing) and one-to-many (netscans). 2. The ratio of the entropy of the first Destination IP byte to the entropy of the fourth Destination IP byte H(IP1)/H(IP4). 3. The ratio of the entropy of the second Destination IP byte to the entropy of the fourth Destination IP byte H(IP1)/H(IP4). 4. The ratio of the entropy of the third Destination IP byte to the entropy of the fourth Destination IP byte H(IP1)/H(IP4). These features reflect the social role of a host, they characterize the dispersion observed in the list of peers (or Destination IP addresses) associated with a SrcIP. Distribution of peers over the IP space is not random in real cases, the first and second bytes usually correspond to locations or ISPs, while the third one correspond to companies or organizations, while the fourth one represents hosts in the same sub-network. Most regular traffic entropy measured on the second and the third bytes tend to be just a little lower than that on the third and the fourth, so a large difference in these entropies is likely to betray scanning. 5. The ratio of the number of source ports per the number of peers: servers usually receive requests from clients on a single, and use the predefined
6.
7.
8.
9. 10. 11.
12. 13.
14.
15.
specific port as a source port in the response for classical protocols, while clients usually open a different random port for each connection to a server. The desperation of distribution in source ports: The number of distinct source ports itself may not reflect valuable meaning, for example a host providing a web service on port 80 will use this port to send http traffic, at the same time it may be using other ports for traffic of other different services, but for example mostly it is using port 80, when using only the distinct number of ports, this port will be represented as one of these ports used by this host and will not reflect the frequency of using this port while entropy of ports represent the frequency of used ports. The ratio of the number of destination ports per the number of peers reflects the role of the host. Scanning open ports on a single or some IP addresses will result a high value of this feature, while a very low value may represent a scan of a single port on many IP addresses. The desperation of distribution in destination ports: similar to feature number 3 also this feature reflects the distribution of destination ports. Figure 2 displays the Entropies of the Source and Destination Ports VS. Distinct source and destination ports. We can notice some strange values that represent non-equally distributed ports. The mean number of packets per flow distinguishes elephant flows from mice flows (non-connected flows and could be an attack). The mean packet size: small-size packets mostly consist of signaling or scan traffic while large-size packets are data exchange. The mean number of flows per peer reflects consistency of traffic between these two hosts. While the flow is created by Netflow during a specific period of time, so new flow is created to the same destination IP address if the connection stays active for a period longer than Netflow’s predefined period of the flows. Mean duration of flow differentiate between connected vs. nonconnected flows which is possible to be attacks. The entropy of protocols used by this IP to communicate with other IP addresses distinguishes service providers that mostly use single protocol from other clients that may use different protocols. IP protocol value comes from the flow record value (where 6=TCP, 17=UDP). The entropy of type of application distinguishes service providers from clients that normally use more applications simultaneously. (The type of application comes from the flow record where FTP=1, www=2, Mail=3, P2P=4, Service=5, Interactive=6, Multimedia=7, Voice=8, others=0). Number of sent SYN-ACK: When two computers attempting to communicate they negotiate the parameters of the network TCP socket connection before transmitting data, in all situations the service provider whose service is requested should send the SYN-ACK message when it accepts the request of its clients to start or end the session.
6.
Clustering Results and discussion
The above presented features values vary with large ranges like number of peers, and vary in narrow ranges like entropies. So the values of features need to be normalized to get values within the range [0, 1] by dividing each feature on the maximum value of the feature. We applied DBSCAN clustering algorithms implemented by weka[18] on the features extracted in the previous section to cluster hosts based on behaviors, clusters were labeled with numbers. It’s easily possible to notice some significant clusters like those presented in Table 1: Table 1 some selected clusters, values here are the real values before normalization Cluster label 6 19 1 2 17 132 234 803 Number of elements Averages of the values of extracted Features of the cluster 1549 2343 1 3 Number of peers 0.271 0.364 0 0.072 H_IP1/4 0.401 0.447 0 0.070 H_IP2/4 0.995 0.805 0 0.083 H_IP3/4 0.001 0.0242 50 0.891 Number of srcprts per peers 0 0.005 4 0.067 H_srcprt 1 31 Number of dstprts per peers 0.00084 6.38 0 8.34 0 4.117 H_dstprt 1 2 1.2 440 Mean pkts per flow 75 1225 590 1454 Mean pkt size (byte) 1 8 56 44 Mean flows per peer 0.0006 4559 6526 14695 Mean duration of flow (ms) 0 0.0004 0 0 H_prot 0 0.0053 0.0027 0.008 H_toa 0 636 0.0256 2.42 Number of SYN-ACKs
6.1. Scanning a single port The cluster labeled with number 6 the number of elements in this cluster is not big 17 SrcIPs, the traffic behavior of the hosts in this cluster is anomalous. We may notice the big number of peers, and the small size of packets, no SYNACK signals sent from these IPs, a single source port were used in transmission to a single destination port on the destination IPs. A single packet is sent in each flow from the SrcIP with a very low duration of flow. All SrcIPs in all of their transmission used only one protocol and a single type of application, and a single flow is made to DstIPs. We may notice also that the changes in the third and fourth bytes of DstIPs is much bigger than the changes in the first two bytes, we may notice that the change in the third destination IP is very slightly lower that of the fourth byte which means a scan over class B.
6.2. Server traffic behaviour The cluster with label 19 includes 132 elements, they show a server traffic behavior, they send traffic to a very high number of peers (clients in this situation) with a very low entropy of source ports and the maximum entropy of
destination ports which means the change in the ports on the servers is very low while the changes in the ports on clients is very high (a new dstPrt port for each connection). We notice that the hosts in this cluster send a big number of SYNACK signals which can’t be sent from the host that initiate a connection (client) but can be sent from the hosts that provide a service to other clients here we call them as servers. Also we may notice that the packets transmitted are medium in size not small and not big which means a normal traffic and a medium duration of flows. The changes in protocol and type of application are very low.
6.3. Clients sending http like requests The size of cluster with the label 1 is medium with 234 hosts each host is transmitting to a single destination flows with a small packet-size but a slightly long duration of flows more than the duration required to send in average two packets with a medium to small packet size. We may notice that each host in this cluster is sending the packets to a single port on the receiver, using a different source port per flow, and also they tend to use a single protocol and a single type of application, so we may say that the hosts within this cluster are clients each one is requesting a service from a single server under a single protocol and a single application which may be http request.
6.4. P2P Traffic Cluster with label 2 is considered to be relatively a big cluster of hosts initiating big traffic with a small number of peers, we may notice that the packet size tend to be so big and the number of packets per flow is also very big with a very long duration of flows and a big number of flows per destination IP, a single type of protocol and a single type of application with a relatively small number of SYN-ACK equals to the number of peers. This form of traffic is similar to that of P2P traffic.
7.
Conclusion
The contribution of this paper includes: (1) the selection of most important features or host behavior communication patterns to be utilized in clustering to characterize accurately and efficiently groups of host behavior traffic. (2) We presented an algorithm to extract most significant IP nodes to be analyzed instead of analyzing the complete list of millions of IP nodes that exist in the trace. 3) We analyzed IP nodes traffic behavior on a relatively long period of traces, which help to extract a more stable host’s behavior. While previous studies focus only on host behavior for a relatively short period of 5 to 15 minutes, we extract host’s behavior patterns over an hour which needs big data analysis to provide results in a reasonable time.
Acknowledgement(s) This work was supported by Jiangsu Key Laboratory of Computer Networking Technology, Southeast University. The research was sponsored by National Grand Fundamental Research 973 program of China Grant No. 2009CB320505, the National Nature Science Foundation of China Grant No. 60973123.
References [1] [2] [3] [4] [5]
[6] [7] [8]
[9] [10] [11]
[12]
[13]
[14]
[15]
[16] [17] [18]
T. Karagiannis, K. Papagiannaki, and M. Faloutsos, "BLINC: multilevel traffic classification in the dark." pp. 229-240. W. X. Liu, and J. Cai, “A New Method of Detecting Network Traffic Anomalies,” Applied Mechanics and Materials, vol. 347, pp. 912-916, 2013. K. Xu, Z.-L. Zhang, and S. Bhattacharyya, “Profiling internet backbone traffic,” ACM SIGCOMM Computer Communication Review, vol. 35, no. 4, pp. 169, 2005. K. Xu, Z.-L. Zhang, and S. Bhattacharyya, "Profiling internet backbone traffic: Behavior models and applications," Computer Communication Review. pp. 169-180. X. Kuai, Z. Zhi-Li, and S. Bhattacharyya, “Internet Traffic Behavior Profiling for Network Security Monitoring,” IEEE/ACM Transactions on Networking, vol. 16, no. 6, pp. 1241-1252, 2008. K. Xu, F. Wang, and L. Gu, "Network-aware behavior clustering of Internet end hosts." pp. 2078-2086. K. Xu, F. Wang, and L. Gu, “Behavior Analysis of Internet Traffic via Bipartite Graphs and One-Mode Projections,” IEEE/ACM Transactions on Networking, pp. 1-1, 2013. G. Dewaele, Y. Himura, P. Borgnat, K. Fukuda, P. Abry, O. Michel, R. Fontugne, K. Cho, and H. Esaki, “Unsupervised host behavior classification from connection patterns,” International Journal of Network Management, vol. 20, no. 5, pp. 317-337, 2010. T. Karagiannis, K. Papagiannaki, N. Taft, and M. Faloutsos, "Profiling the end host," Passive and Active Network Measurement, pp. 186-196: Springer, 2007. S. Wei, J. Mirkovic, and E. Kissel, “Profiling and Clustering Internet Hosts,” DMIN, vol. 6, pp. 269-75, 2006. V. Frias-Martinez, S. J. Stolfo, and A. D. Keromytis, "Behavior-profile clustering for false alert reduction in anomaly detection sensors," Proceedings - Annual Computer Security Applications Conference, ACSAC. pp. 367-376. J. L. Liu, and J. Cai, “Complex Network Community Structure of User Behaviors and Its Statistical Characteristics,” in Proceedings of the 2011 Third International Conference on Multimedia Information Networking and Security, 2011, pp. 366-370. Y. Jin, N. Duffield, J. Erman, P. Haffner, S. Sen, and Z.-L. Zhang, “A Modular Machine Learning System for Flow-Level Traffic Classification in Large Networks,” ACM Trans. Knowl. Discov. Data, vol. 6, no. 1, pp. 1-34, 2012. M. Iliofotou, B. Gallagher, T. Eliassi-Rad, G. Xie, and M. Faloutsos, “Profiling-ByAssociation: a resilient traffic profiling solution for the internet backbone,” in Proceedings of the 6th International COnference, Philadelphia, Pennsylvania, 2010, pp. 1-12. I. Trestian, S. Ranjan, A. Kuzmanovic, and A. Nucci, “Googling the internet: profiling internet endpoints via the world wide web,” IEEE/ACM Trans. Netw., vol. 18, no. 2, pp. 666-679, 2010. I. Trestian, S. Ranjan, A. Kuzmanovi, and A. Nucci, "Unconstrained endpoint profiling (googling the internet)." pp. 279-290. R. Erbacher, S. Hutchinson, and J. Edwards, "Web traffic profiling and characterization," ACM International Conference Proceeding Series. M. Hall, E. Frank, G. Holmes, B. Pfahringer, P. Reutemann, and I. H. Witten, “The WEKA data mining software: an update,” ACM SIGKDD Explorations Newsletter, vol. 11, no. 1, pp. 10-18, 2009.