Profiling of Real-World Web Applications Hugo Menino Aguiar
João Costa Seco
[email protected]
Lúcio Ferrão OutSystems SA
CITI - Faculdade de Ciências e Tecnologias Universidade Nova de Lisboa
[email protected]
[email protected]
ABSTRACT
1.
Non-functional requirements of enterprise web applications, like performance, are usually assessed and analyzed in simulated environments before being released into production. However, it is not easy to simulate a real-world environment and the effective use of the system, leading to poor and expensive performance data collection. Moreover, in agile methodologies, where development is focused in the fast time to market and getting early feedback from end-users, upfront estimation and forward thinking about scalability is not in the top priorities. This constrains even more performance analysis and tests, as developers are only aware of performance issues when critical feedback from production systems is given back to development. This commonly leads to enterprise web applications with scalability problems, and low responsiveness. This paper presents a structured way of giving continuous and real world performance feedback to developers of enterprise web applications. By having early access to real performance metrics, developers easily detect stress points in applications, allowing for timely tuning actions, before reaching critical conditions for end-users. Metrics also help developers assessing the impact of changing intensively used parts of existing applications.
The increasing dependency of business on web technologies causes a greater need for accurate assessment of factors associated with the success of enterprise web applications. Non-functional requirements like performance is one of these factors. However, performance evaluation is usually only a concern when problems arise as a consequence of bad enduser experience. Only in special cases there is the anticipation of performance issues, by earlier experiences or obvious expectations, and a thorough performance evaluation is performed. Hence, correctness and performance are usually assessed and analyzed in simulated environments before being released into production. However, it is not easy to simulate real-world environments and the effective use of the system, thus leading to poor and expensive performance data collection and estimation of the whereabouts of application bottlenecks. Agile methodologies focus in the fast time to market of software development and evolution based on early feedback from end-users. This causes development and maintenance to be quite modular and raises another concern which is the developers’ awareness about performance issues when editing other developer’s code. When developers work on a web application with considerable history, they are not usually aware about the usage and responsiveness of the existing system. Since they are not informed about the performance of the application in production, they commonly introduce features that lead to performance gaps that have to be corrected later. The fact that no runtime application performance data is usually available, means that execution bottlenecks are only detected when end-users give critical (negative) performance feedback. This paper tries to answer two different questions:
Categories and Subject Descriptors C.4 [Performance of Systems]: Measurement Techniques; D.3.4 [Programming Languages]: Processors—Compilers; D.4.8 [Operating Systems]: Performance—Monitors
General Terms Performance, Measurement, Languages
Keywords Profiling, Web applications, Agile Development, Measuring time and frequency
INTRODUCTION
• Can we collect real world data about performance of web applications without significant impact in the enduser experience? • Can we give feedback to developers in a way that impact analysis is improved and that anticipation of performance issues is achieved?
Permission to make digital or hard copies of all or part of this work for personal or classroom use is granted without fee provided that copies are not made or distributed for profit or commercial advantage and that copies bear this notice and the full citation on the first page. To copy otherwise, to republish, to post on servers or to redistribute to lists, requires prior specific permission and/or a fee. PADTAD’10 July 12, Trento, Italy. Copyright 2010 ACM 978-1-4503-0136-7/10/07 ...$10.00.
Profiling of web applications is not an easy and common task in regular industrial environment. There may be some explanations for that fact among which we find the heterogenous context of web applications usually containing interface code, business logic and databases. Collecting data in all tiers of an application and gathering it in a meaningful
way is not a trivial task. On the other hand, performance degradation caused by instrumentation and data collection is usually the reason for not collecting real-world data. In this work, we design and implement a profiling system for the OutSystems Agile Platform [3] which integrates the development of web applications in one single programming language and one development environment that supports the whole life cycle of applications. By presenting a unified solution, the Agile Platform has connections between development and production environments which allows to implement a complete collect, transport and visualization solution. The implementation of this work also benefits from services, already present in the Platform, to handle the data transport between the different layers of the architecture. Web applications are developed using a domain specific language (DSL) [12, 14] that integrates interface design, business logic and database manipulation operations in a single language. Applications are then compiled to standard main-stream technologies and applications are set to run on a standard application server architecture. By instrumenting the compiler with efficient collecting profiling techniques, code implementing probes are placed in the applications to collect runtime performance data. The higher level of abstraction provided by the OutSystems programming language, leads developers to be unaware of many implementation details and to focus on the meaning of their programs. It is true that the platform takes care of many code optimizations, but there are some cases where the optimizer is simply not enough and where applications would benefit from a clever design. By collecting simple runtime data at the level of the DSL, as execution counts and duration, and considering as targets its course grain elements, and avoiding low level monitoring we achieve two important milestones, we keep the interference level and the performance impact in production environments at an acceptable level and we produce information that is tightly connected to the programming elements and is easily shown to developers in the development tool. The final objective of this work is therefore to collect data efficiently, without causing impact on performance, and showing it to developers in the context where it is most necessary and useful. We next present the Agile Platform in some detail in section 2, then discuss the decision process about which metrics to include in the profiling system in section 3. Given this context, we present the proposed system for collection, transport and visualization of profiling data in section 4.
2.
AGILE PLATFORM
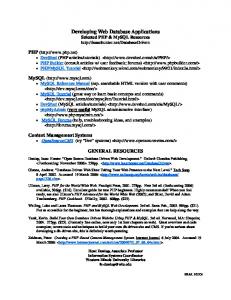
The OutSystems Agile Platform [3] is composed by several heterogeneous parts that contribute to integrate the development, staging and execution of web applications. We focus first on the development tool of the Agile Platform, the Service Studio, and the OutSystems programming language. We then describe the runtime support system, the Platform Server, whose architecture is depicted in Figure 1, which includes a Database Server, several Front-end Servers for load-balancing purposes, and a Deployment Controller Server. In particular we describe the inner components of each front-end server : the Service Center, an administration tool to manage applications running in a system, and the Web
Figure 1: Architecture of the Platform Server using multiple front-end servers. Application Server that hosts the running applications. We also explain how the deployment process works in production environments and present the applications’ life cycle.
2.1
Service Studio
Service Studio is the development environment of the OutSystems Agile Platform. It allows a developer to design a complete web application in a single environment. Web page like interfaces, business logic, database tables and security settings are all set in this single and integrated environment. The user interface of Service Studio is graphically oriented, all elements are visually defined by dragging and dropping smaller elements and defining specific properties. Another important fact about this component is that it works while integrated in a runtime environment and thus allows connections to existing resources in the supporting environment. Applications created using Service Studio can be compiled and published to the Platform Server and accessed via web browsers.
2.2
Visual Programming Language
Service Studio implements a domain-specific language designed to represent web applications through high level constructs. The elements of the language are Screen flows which define a high level web of connections between web pages, Screens and Web Blocks which graphically define the interface of an application, Action flows that define pieces of logic of an application, and Entities that define the data model. All these elements are integrated by the tool with clear benefits to correctness that in most cases is forced by design. Figure 2 depicts the Screen flow of a simple web application implementing an address book where the end-user can create, update, remove contacts from a database. A Screen Flow defines the entry point of an application, in this case it is screen Contact List, and which are the next possible screens for each situation. For example, screen Contact List may lead to screens Contact Show, Contact Edit, Category List, or Contact Import. Screens are web pages programmed to interact with the application code in the server. Action flows define a piece of behavior that may be triggered by an end-user when interacting with a screen, by following a link and loading a new page or by pressing a button. Action flows are visually modeled using basic programming elements, e.g. assignments, queries, conditional and loop constructs. Fig-
Figure 2: Example of a Screen Flow ure 3 shows an Action Flow that inserts a new contact in our sample database. This Action Flow is called when the user presses button ”save” in screen Contact Edit after filling all necessary information in a form. Notice that action CreateOrUpdateCONTACT (predefined by the system) tries to update the entity and if it fails it creates a new one. For more information about the language constructs and Service Studio please refer to chapter Designing actions in [4].
2.3
Platform Server
Platform Server is the runtime support system for OutSystems web applications. A Platform Server may be installed in a farm configuration for scalability and high availability purposes. In this configurations a load balancer distributes web requests among multiple front-ends. The components and services of the Platform Server are (see Figure 1): the front-end servers, the deployment controller server and the database server : • Front-end Server: A front-end server is a typical web application server with some extra elements: – Service Center - a console to administrate the Platform Server ; it provides centralized access to all Platform resource information as application versioning and management, runtime activity and runtime execution reports. – Log Service - a service to asynchronously store errors generated by all running applications. • Deployment Controller Server: Is in charge of compiling web application projects, and deploying the compilation result in the front-end servers. • Database Server: A relational database management system, such as Microsoft SQL Server or Oracle. Our profiling system must collect performance data in each front-end server. The way we collect, aggregate the data and transport it will be addressed in section 4.
Figure 3: Example of an action flow
2.4
1-Click Publish
1-Click Publish (1CP) is the process for deployment of a web application into an environment. In OutSystems a web application project is known as an eSpace. An eSpace is edited using Service Studio and can be published to a development environment, to be tested and analyzed, or published to a production environment. When the developer invokes the 1CP process, Service Studio contacts Service Center, which uses a compiler, to generate the web application code and to deploy it to different front-ends. The environment architecture and the 1-Click Publish process is depicted in Figure 4. The 1CP process comprises the following steps: 1. Developer invokes the process 1-Click Publish that sends the eSpace definition to Service Center. 2. The compiler in the web server, receives the eSpace and generates a standard .NET or J2EE application code. 3. The 1CP operation ends with the deploy process - an operation that updates the eSpace published version (area that contains the last published version for a specific eSpace). In the end, the application is accessible through web browsers. Both development and production environments contain the ingredients depicted in Figure 4: an web server with a database, an application server that runs inside the web
5. Runtime performance data is shown in Service Studio. Developer can then visualize information about the performance that each programming element of the application has in production. We next refer to several ways of measure performance and compare them to the way we extend the Agile Platform to collect, aggregate and present metrics.
3.
Figure 4: Environment implementation and 1-Click Publish server and that contains Service Center and the running web applications. The compiler is also an ingredient of the environment, and is called by Service Center.
2.5
OutSystems Applications Life Cycle
The life cycle of OutSystems web applications is depicted in Figure 5. Development starts in the Service Studio that is typically connected to a controlled development environment. The application code is compiled and published in that environment for the first testing phase. Depending on the actual staging architecture the code is manually transported to a production environment ant put in use. In the standard installation, there are ad-hoc processes for collecting users’ feedback and getting it back to the development teams. We propose an extension of this life cycle where data is mechanically collected and transported to the development environment. Remember that Service Studio always runs connected to an environment and therefore it can retrieve collected data and show it to the developer. In this way, the availability of this performance information, anticipates the need of explicit feedback from users to detect bottlenecks and stress points of the application. We next present the main steps of Figure 5 in more detail. Nevertheless we do not intend to replace the explicit feedback given by end-users but only to anticipate needed changes to the applications. 1. Developers use Service Studio, to design, create, modify and test web applications. When necessary, applications can be published to the development environment to be tested and analyzed. 2. When applications pass a test phase and there is a decision to deploy it, the delivery manager, transports it to the production environment. 3. The application runs for a period of time in the production environment where the profiling system measures and stores relevant metrics. 4. Metrics are transported back to the development environment.
MEASURING WEB APPS
Several tools for profiling web applications have been created and are highly popular, but most of these are useful for marketers and managers. They usually provide metrics about traffic of data on the network and marketing effectiveness by following users paths. This kind of profilers can determine, for instance, the direct impact of a specific marketing campaign by analyzing the entry point of each user. Google Analytics [2] is perhaps the most significative example inside the this category - its a solution that analyzes traffic data, helps clients to better target their ads, to strength marketing initiatives, and to create websites that better match their market goals. In this study we want to apply a classic profiling strategy to web applications by measuring other kind of properties. We implement profiling techniques that will retrieve relevant metrics for developers and IT managers. There are different kinds of metrics that can be collected through profiling, we next explain what are the metrics chosen and the reason for that choice. In general, developers want to have as much information as we can get, and in more detail as possible, so that developers can change with effectively the web application when necessary, assuring its success and performance, increasing its life time. However, our approach is to increase developers awareness on simple performance information rather than providing complex and expensive to get information. This goal is the result of a survey filled by the most experienced group of OutSystems developers that aimed at understanding what kind of information would help them most to anticipate inefficiency. The results of the survey were clear. Developers considered more relevant to have execution counts and average execution time for actions and screen preparations (special kind of action) and to keep the impact of the data collection as low as possible. This means that it is absolutely necessary to measure as few properties as possible. The execution counts and average execution time of actions allow developers to understand what is heavier on a web application, either by being executed more often or by taking more time to execute. By showing this information to developers will result in two clear benefits: 1. It decreases the risk of code modifications having unexpected and significant impact on performance. Developers will know they are changing sensible code and will correctly identify the risk of changing it. 2. Developers will be able to monitor and identify bottlenecks of the applications before reaching critical status for end-users. To achieve this goal it is important that we show execution counts and average time together. Consider the two following situations:
Figure 5: Simplified OutSystems application life cycle • ”last week the average execution time of function X was 6 seconds”
lection is diminished by associating counters to high level programming elements.
• ”last week the average execution time of function Y was 1 second”
3.2
A proactive team would probably try to optimize function X instead of function Y . However, if function X was executed 10 times in that period in opposition to 10000 times of function Y , our optimization on function X would have almost no impact on the end-users experience. An careful optimization on function Y would certainly have more impact.
3.1
Instrumenting code
We collect data by instrumentation of the code generated by the DSL compiler. We change the compiler to generate data collection code and extend the runtime support structure to gather and transport such data until it is shown to the developer. During the compilation process, the Platform Server installs performance counters and timers in the runtime support system of the application and generates code that use them according to the usage of applications. Code instrumentation is one of the most common techniques to register the behavior of programs and to measure its performance [5, 6, 7]. However, instrumentation of code usually has an huge impact on the performance of the systems [13] due to that, this type of profiling is not usually performed on production environments. Other works [8, 9, 15] use sampling to reduce the cost of instrumentation. A sampling profiler proceeds by statistical analysis. In regular intervals of time, it looks at which code is currently being executed, this kind of profiling implementation may lead to wrong performance measures. Gprof [10] is an example of a profiler that uses both instrumentation and sampling. Instrumentation is used to gather caller information and the actual timing values are obtained by sampling. A work that discusses the advantages and disadvantages of these techniques is presented by Hall [11]. In our work we use code instrumentation because we are interested, in the first place, in giving a flow of continuous real-data information to the developers, and probabilistic results are not as accurate as desired. Another and perhaps the most important one is that the impact of the data col-
Execution counts and execution time
To capture the number of times that each block of code is executed and the total time execution of each block of code, we instrument the applications with probes. This probes are inserted within the generated code for each programming element we intend to have measurements from. When end-users interact with web applications, these probes are reached and data is recorded and stored in a structured way. There are several techniques to measure execution time which are characterized by four key attributes [13]: • Accuracy - Defines how far is the measured time from the actual execution time of a procedure. When a measurement is made, there is usually some amount of error, the measurement is usually a result of actual execution time +/- some amount of error, where some amount of error corresponds to the accuracy. • Difficulty - Defines the necessary effort to obtain measurements. A method that only requires the user to run the code and it produces an answer, is considered easy. A method that requires usage of a logic analyzer and filtering of data to obtain answers is considered hard. • Granularity - Defines the size of the part of the code being measured. For example, coarse granularity methods would generally measure execution time per process, per procedure or per function basis. A method with fine granularity can measure execution time of a loop or even a single instruction. • Resolution - Represents the measure limitation. For example, a stop watch measures with a 0.01 sec resolution, while a logic analyser might be able to measure with a resolution of 50 nsec. The design of the software can also have a major impact on the ability to obtain measurements of execution time. If a software has a single entry and exit point for any part of it that needs to be measured, and those points are designed consistently for all code segments that have similar functionality thus achieve accurate metrics can be possible.
Figure 6: Example of data structures to store metrics Software Analyser method is a term used for software tools designed for measuring execution time as CodeTest [1]. Usually software analysers are based on the system clock and thus the resolution is on the order of a millisecond. A good analyser not only provides information about functions and processes, but also means to measure execution time of loops, blocks of code and statements. For example, in our context, timing trace must be correlated with the OutSystems DSL elements to identify which element is responsible for each period of execution. Each programming language provides a mechanism to retrieve the current time from the system. These mechanisms save the system time on specific instants and then compute the time intervals by subtracting the values of the system taken at different moments. The Java, for example, creates an object that can be used as a stopwatch to measure the time execution of code blocks.
4.
PROPOSED SOLUTION
We now describe how our system collects, aggregates, and transports data from the production environment to the development environment, and how they are made available to the developer, crossing different architectural layers of the Agile Platform avoiding significant impact.
4.1
Collecting runtime performance data
In order to minimize the impact of profiling on applications’ performance, we adopt an architecture with different levels of priority to collect, aggregates, and transport data from the running application back to the developer. Profiling code inlined in the application code to count the number of times an action gets executed or the time it takes to terminate is crucial and runs with the highest priority, and hence must be designed to have minimum impact on execution time. Collected data is stored close to the programming elements being monitored. This data must then be aggregated and transported across the Platform Server architecture. This is performed in persistent state, with less and less priority and more and more spread in time. We next explain in greater detail each step of the process. Each running application (an eSpace) is hosted by a run-
Figure 7: Front-end data flow ning environment which holds a data structure containing a counter for the executions and the total execution time for all its programming elements being monitored. We use nonblocking algorithms to update counters and timers in memory and thus decrease the number of preemption situations that otherwise would degrade the system’s performance. In order to transport the data through the different architecture layers of the Agile Platform we then use services that run on low priority and do not compete with the processing of web applications. Figure 6 represents the data structures of applications that are running in a front-end server. Since the application server recycles running applications in regular time intervals we store data into persistent state whenever necessary. Approximately every 15 minutes, all measurements in the running environment are pushed to the nearest Log Service and stored in the database and all counters and timers are put to zeros. The next step is to store data in a secondary persistent state, the filesystem. This intermediate step of storing results in the Log Service could be by-passed, but the Log Service is optimized to avoid the impact of logging information on the application’s performance, however this service runs with low priority in the front-end server so it never competes with the normal processing of web applications. Figure 7 shows the data flow inside a front-end server. Every 60 minutes, the Log Service appends a predetermined file with the collected data. Whenever a file contains performance data about 24 hours, a new file is created. The system maintains a pool of 7 files, where the oldest is replaced by a new one each day. Hence, we have information about the number of times that an action is executed in a day and the total time of the actions executions. Our goal is to have a continuous flow of information of about one week.
4.2
Transporting metrics to Service Studio
Our goal is to provide metrics inside Service Studio. In Figure 8 we can see both the development and production environments. Each arrow represents a request for data that is executed whenever a developer opens an eSpace in Service Studio. This process follows the steps:
1. On opening Service Studio, a request for metrics is made to the Service Center of the development environment. 2. If data is available in the development environment’s database, it is immediately provided to Service Studio. 3. Otherwise, the Service Center in the development environment requests for metrics to the Service Center of the production environment. 4. If there is no cached information, Service Center of the production environment communicates with the Log Services of the different frond-end servers requesting the runtime performance data. 5. Each Log Service retrieves the runtime performance data from the file system. A sequence diagram is depicted in Figure 9, this figure is more detailed and shows two runtime scenarios when the developer opens an eSpace inside Service Studio. The first scenario represents the situation when metrics are available on the development database. The second scenario represents the situation when there is no data in the development database for a given eSpace, or date is too old and it is necessary to bring data from the production environment to the development environment. The first scenario is trivial and represents the workflow of Figure 8. We next describe the second scenario in more detail: 1. W hen the developer opens an eSpace with Service Studio, a request for performance data for the given eSpace is sent to the Service Center of development. 2. The development Service Center requests performance data, for the given eSpace, from the production environment. 3. The production Service Center communicates with each front-end server configured, that hosts the running application (eSpace), by contacting the Log Service and requesting the performance collected data. Remember that there is a Log Service running in each front-end server. 4. Each Log Service gets the performance data from the file system of the respective front-end server. 5. Inside each front-end server, the running Log Service aggregates the collected performance data. 6. Each Log Service send the performance data to the production Service Center. 7. The production Service Center send the performance data to the development Service Center. 8. The development Service Center aggregates the performance data received. 9. The development Service Center send the performance data to Service Studio. 10. The development Service Center caches the performance data in the development database.
Figure 8: Solution architecture Note that this process is asynchronous. The developer can work on Service Studio while the data is being imported. The transport of data is done on demand to avoid unnecessary communication and process between the two environments. For example if a development team stop the development process during a period of time, it isn’t necessary to transport the runtime performance data of the web application to the development environment.
5.
CONCLUDING REMARKS
We have presented the architecture of a profiling system that collects real world data from web applications. By focusing on a DSL we expect to reduce the impact of measurements on the performance and the end-user experience. By giving feedback to developers proactively we aim at improving the whole agile development cycle. We don’t present definite results since the prototype implementation phase is not over yet. However, we believe that we will achieve positive results. The goals that we consider to make this a successful project, are: 1. To be able to collect metrics at runtime, without significant degradation on the server and applications performance. 2. To be able to gather and transport data from a production environment to a development environment. 3. To decorate Service Studio with profiling information, without cluttering the existing environment and without significant impact to its performance. 4. To achieve positive results on the agile maintenance process of enterprise web applications. This goal is subdivided in: helping developers to easily detect stress points and bottlenecks; allowing developers to fix them before reaching critical status for end-users; and increasing the developers’ awareness when changing intensively used code.
Acknowledgments. We thank to the research and development team of OutSystems for their insightful comments and discussion. This work is partially supported by ICTI FCT/MCTES (CMUPT NGN44-2009-12).
6.
Figure 9: Specification of the runtime scenarios
REFERENCES
[1] CodeTEST Software Analysis Tools, Jan 2010. http://www.codewarrior.com/MW/Products/Integration.htm. [2] Google Analytics, Jan 2010. http://www.google.com/analytics/. [3] OutSystems, Jan 2010. http://www. OutSystems.com/. [4] Service Studio Help, OutSystems Agile Platform 5.0, Jan 2010. http://www.outsystems.com/help/servicestudio/5.0. [5] M. Arnold and B. G. Ryder. A framework for reducing the cost of instrumented code. In PLDI ’01: Proceedings of the ACM SIGPLAN 2001 conference on Programming language design and implementation, pages 168–179, New York, NY, USA, 2001. ACM. [6] T. Ball and J. R. Larus. Optimally profiling and tracing programs. ACM Trans. Program. Lang. Syst., 16(4):1319–1360, 1994. [7] G. O. Blandy, M. A. Saba, and R. J. Urquhart. Code instrumentation system with non intrusive means and cache memory optimization for dynamic monitoring of code segments. Number 5940618, August 1999. [8] M. Burrows, U. Erlingsson, S.-T. A. Leung, M. T. Vandevoorde, C. A. Waldspurger, K. Walker, and W. E. Weihl. Efficient and flexible value sampling. SIGPLAN Not., 35(11):160–167, 2000. [9] E. Duesterwald and V. Bala. Software profiling for hot path prediction: less is more. In ASPLOS-IX: Proceedings of the ninth international conference on Architectural support for programming languages and operating systems, pages 202–211, New York, NY, USA, 2000. ACM. [10] S. L. Graham, M. Kessler, and K. McKusick. Gprof: a call graph execution profiler. ACM SIGPLAN Notices, 17(6):120–126, 1982. [11] R. J. Hall. Call path profiling. ACM, Proceedings of the 14th international conference on Software Engineering, pages 296–306, 1992. [12] M. Mernik, J. Heering, and A. M. Sloan. When and how to develop domain-specific languages. ACM Computing Surveys, 37(4):316–344, 2005. [13] D. B. Stewart. Measuring execution time and real-time performance. In In: Proceedings of the Embedded Systems Conference (ESC SF), pages 1–15, 2002. [14] A. van Deursen, P. Klint, and J. Visser. Domain-specific languages: An annotated bibliography. ACM SIGPLAN Notices, 35:26–36, 2000. [15] J. Whaley. A portable sampling-based profiler for java virtual machines. In JAVA ’00: Proceedings of the ACM 2000 conference on Java Grande, pages 78–87, New York, NY, USA, 2000. ACM.