Profiling protein function with small molecule microarrays Nicolas Winssinger*†, Scott Ficarro*, Peter G. Schultz*†‡, and Jennifer L. Harris*‡ *Genomics Institute of the Novartis Research Foundation, 10675 John Jay Hopkins Drive, San Diego, CA 92121; and †Department of Chemistry, The Scripps Research Institute, and The Skaggs institute for Chemical Biology, 10550 North Torrey Pines Road, La Jolla, CA 92037 Edited by Christopher T. Walsh, Harvard Medical School, Boston, MA, and approved June 18, 2002 (received for review May 13, 2002)
T
echnologies to investigate cellular events on a genome-wide scale have emerged as powerful tools. At the transcriptional level, mRNA expression analysis using oligonucleotide arrays (1–3) has already had a large impact on our ability to rapidly assess the molecular basis of a cellular or organismal phenotype and in the discovery of novel drug targets (4, 5). At the proteomic level, considerable efforts have been focused on both en masse quantification and identification of proteins in a given sample and characterization of protein function. Chromatography in conjunction with mass-spectroscopy has been successful in analyzing the content of proteins in a given sample (6, 7). The complexity of annotating and analyzing the function of proteins en masse has stimulated a variety of approaches, including maps of protein–protein (8, 9) and protein–DNA (10) interactions, microarrays of spotted proteins (11), and genome-wide analysis of protein structure (12). However, there are few reports of technologies aimed at measuring enzymatic activities on a genome-wide scale (13–15). Protein function can be regulated on many different levels, including spatial and temporal expression, posttranslational modifications, protein–protein interactions, and cofactor requirements. Regulation by posttranslational modification is particularly relevant for classes of enzymes such as proteases and kinases where there can be a poor correlation between the presence of an enzyme and its enzymatic activity or function. A method that combines the ability to monitor changes in the active state of enzymes as well as the abundance of the active enzymes would be particularly useful in dissecting intricate pathways and identifying relevant proteins involved in that pathway for use as drug targets or as diagnostic biomarkers. Specifically, we reasoned that an optimal method should satisfy the following criteria: it should distinguish between inactive and active proteins; it should allow the rapid separation and identification of multiple proteins; it should not require that the assay be performed on a solid surface because of differences in protein recognition and binding that can arise because of these surfaces; it should be adaptable to multiple solution systems so that the proteins can be assayed under a given set of physiological conditions; and finally, the method should require minimal sample volume. We recently reported (16) a new approach to microarray libraries of small molecules that has the potential to satisfy these criteria. In this method, a small molecule is cowww.pnas.org兾cgi兾doi兾10.1073兾pnas.172286899
valently tethered to a peptide nucleic acid (PNA; ref. 17) tag whose sequence encodes the structure of the molecule and localizes it to a specific site upon hybridization to an oligonucleotide array. As shown in Fig. 1, we reasoned that libraries of mechanism-based inhibitors could be used to probe the presence or absence of functionally active enzymes. An enzyme present in an active state forms a covalent adduct with a suitable member of the mechanism-based inhibitor library. The library members that do not form adducts with an enzyme are then removed by size-exclusion filtration, and the PNA-encoded inhibitor-protein adducts are then hybridized to an oligonucleotide microarray. Because every PNA is labeled with a single fluorescein molecule, the fluorescence intensity of a particular microarray feature should directly reflect the amount of the corresponding functional protein present in the sample. With the current microarray technology, one could potentially screen 400,000 enzyme activity probes in a volume of 300 l. We decided to focus our attention initially on cysteine proteases. An acrylate moiety (Fig. 2) was selected as the mechanism-based ‘‘warhead’’ based on its chemoselectivity for nucleophilic thiols (18, 19). To examine the ability of this method to monitor changes in active-enzyme amounts quantitatively and to do so in complex physiologically relevant samples, we investigated the cytotoxic lymphocyte-mediated cell death. Our results demonstrate that the probe array can be used to monitor proteolytic activities in complex biological processes that are not regulated at the protein synthesis level. Materials and Methods Preparation of Compounds 1–7. Unless otherwise indicated, the chemicals were purchased from Aldrich, and reactions were performed at room temperature. The Fmoc-protected amino acrylic acids were prepared from the corresponding Fmocprotected amino acid (Nova Biochem) by means of a four-step sequence. Esterification of the amino acid with ethane thiol and water-soluble carbodiimide (Nova Biochem) in dichloromethane afforded the thioester which was reduced to the corresponding aldehyde with 10% palladium on charcoal and triethylsilane in dichloromethane (20). The aldehyde was condensed with allyl (triphenylphosphorsnylidene) acetate in toluene at 80°C to obtain the allyl-protected trans-acrylate. The geometry of the olefin was verified by NMR (J ⫽ 11.5 Hz). The allyl group was removed by using palladium tetrakis (Strem Chemicals, Newburyport, MA) and tributyltin hydride in dichloromethane. The peptide PNA conjugates were synthesized on rink amide methylbenzhydr ylamine resin (Nova Biochem) by using Fmoc-Lys(Mtt)OH as the first and branchpoint residue. The PNA synthesis was carried out by using an Applied Biosystems Expedite synthesizer according to the manufacturer’s recommendations.
This paper was submitted directly (Track II) to the PNAS office. Abbreviation: PNA, peptide nucleic acid. ‡To
whom reprint requests may be addressed. E-mail:
[email protected] or schultz@ scripps.edu.
PNAS 兩 August 20, 2002 兩 vol. 99 兩 no. 17 兩 11139 –11144
BIOCHEMISTRY
The regulation of protein function through posttranslational modification, local environment, and protein–protein interaction is critical to cellular function. The ability to analyze on a genomewide scale protein functional activity rather than changes in protein abundance or structure would provide important new insights into complex biological processes. Herein, we report the application of a spatially addressable small molecule microarray to an activity-based profile of proteases in crude cell lysates. The potential of this small molecule-based profiling technology is demonstrated by the detection of caspase activation upon induction of apoptosis, characterization of the activated caspase, and inhibition of the caspase-executed apoptotic phenotype using the small molecule inhibitor identified in the microarray-based profile.
Fig. 1. Screening of PNA-encoded libraries. Individual small molecules (red shapes) are tethered to a unique PNA sequence (blue bars), which encodes both their synthetic history and their location upon hybridization to an oligonucleotide microarray. The PNA are capped with fluorescein (yellow oval) for fluorescence detection. The library of PNA-encoded small molecules is incubated with a protein mixture of interest, passed through a sizeexclusion filter to separate the small molecule-PNA adducts bound to a macromolecule from the unbound ones, and the high molecular weight fraction is hybridized to the oligonucleotide microarray.
Enzyme and Apoptotic Lysate Preparation. Human caspase-3 was
cloned, expressed, and purified by methods described by Zhou et al. (21). Human granzyme B was cloned and expressed in Pichia pastoris by using methods described in ref. 22, with the exception that a C-terminal 6⫻ His tag was incorporated to facilitate purification on Ni(II) resin. The Jurkat cytosolic cell lysates were prepared by lysing 10 ⫻ 106 cells in a buffer consisting of 10 mM Hepes (pH 7.4), 130 mM NaCl, and 1% Triton X-100. The soluble cytosolic fraction was separated from the insoluble membrane and nuclear fraction through centrifugation at 14,000 ⫻ g for 10 min. The soluble cytosolic lysate was adjusted to 1 mg兾ml by the addition of PBS and 5 mM DTT. To make the granzyme B-activated apoptotic lysate, recombinant granzyme B was added to a final concentration of 0.1 nM and incubated for 30 min or until caspase activity reached a plateau, as monitored by Ac-DEVD-acc fluorescence (23). Incubation of Mechanism-Based Probes (1–7) with Enzyme and Lysate Samples. Compounds 1–7 (see Fig. 2) were incubated at 1.0 M
in 20 l with purified caspase-3, purified granzyme B, cytosolic lysate from Jurkat cells, or granzyme B-activated apoptotic Jurkat lysates for 2 h in PBS (pH 7.4) supplemented with 5 mM DTT. The sample then was loaded on an Ultrafree 30-kDa molecular weight cutoff filter (Millipore) and washed with 1⫻ PBS buffer (3 ⫻ 500 l). The volume of the sample retained in the 30-kDa filter then was adjusted to 200 l with PBS, and fluorescein-conjugated DNA control probes were added to the sample. The sample mixture then was added to a GenFlex tag 11140 兩 www.pnas.org兾cgi兾doi兾10.1073兾pnas.172286899
Fig. 2.
Chemical structure of selected protease inhibitors 1–7.
array (Affymetrix, Santa Clara, CA) and was visualized after a 6-h incubation. Capture of Protein Functionally Interacting with Probe 6a. Granzyme
B-activated apoptotic Jurkat lysates (prepared as described above) were incubated with compound 6b for 1 h. Ultralink immobilized monomeric avidin resin then was added to the sample and incubated at room temperature for 1 h. The resin then was washed with 10⫻ resin volume of PBS, and captured proteins were eluted with 5 mM biotin.
Identification of Protein Functionally Interacting with Probe by Mass Spectrometry. Captured proteins were denatured with 8 M urea
in 100 mM ammonium carbonate and then reduced by adding DTT to a final concentration of 10 mM and incubating for 45 min at 50°C. Iodoacetamide was added to a final concentration of 30 mM, and the resulting solution was allowed to stand at room temperature for 45 min. Proteins were digested with sequencing grade modified trypsin (Promega) according to the manufacturer’s instructions. Tryptic peptides were analyzed by nanoflow RP-HPLC兾micro electrospray ionization (ESI)兾MS on a liquid chromatography quadrupole ion trap mass spectrometer (ThermoFinnigan, San Jose, CA). Briefly, 10 pmol of tryptic peptide was loaded onto a microcapillary column (360 m O.D. ⫻ 75 m I.D. fused silica) packed with 6-cm 5–20 m C18 particles (Waters). This column was connected to an analytical column (360 m odd. ⫻ 50 m i.d. fused silica packed with 8-cm 5 m C18) with an integrated ESI emitter tip. The construction of this type of column and its use in ESI-MS has been described (24). Peptides were eluted into the mass spectrometer with an HPLC Winssinger et al.
gradient consisting of 0–70% acetonitrile with 0.1 M acetic acid in 20 min. When peptide signals were detected, the HPLC flow rate was changed from 400 l兾min to 50 l兾min, lowering the flow through the analytical column to approximately 10 nl兾min. The ESI voltage (1.6 kV) was applied to the mobile phase before flow splitting. The mass spectrometer was programmed to record continuous cycles of MS scans (m兾z 300–2,000) followed by MS兾MS scans of the three most abundant ions in each MS scan (collision energy ⫽ 35%). MS兾MS spectra were matched to peptide sequences in NCBI’s nonredundant protein database (www.ncbi.nlm.gov兾blast兾db兾nr.Z) by using the SEQUEST algorithm (25). Inhibition of the Caspase-Executed Apoptotic Phenotype. Jurkat cytosolic lysate was incubated with and without 1.0 M compound 6c for 10 min. Granzyme B then was added to the lysates, and caspase activity was monitored by Ac-DEVD-acc fluorescence. Aliquots were removed before the addition of granzyme B and 1, 5, 10, and 20 min after the addition of granzyme B. Upon removal of the aliquots, the reactions were quenched by the addition of gel-loading buffer and heat denaturation. Controls for the stability of proteins in the lysate without the addition of granzyme B and in the presence of the inhibitor also were collected. Samples were run on SDS兾10–20% PAGE, transferred to nitrocellulose, and probed with anti-caspase-3 antibody to the N terminus of the P17 subunit (Sigma) and anti-DFF45 C terminus antibody (Sigma). Whole Jurkat cells (5 ⫻ 105) were incubated for 12 h with and without 10 ng兾ml anti-Fas antibody, CH-11 (Kamiya Biomedical, Seattle), and 1 M Cbz-Asp(OMe)Glu(OMe)-Val-Asp(OMe)-FMK (Enzyme Systems Products, Livermore, CA). Cells were prepared for fluorescence-activated cell sorter (FACS) by staining with Annexin V conjugated to enhanced green fluorescent protein (MBL, Naka-Ku Nagoya, Japan) and propidium iodide. The stained cells then were analyzed by flow cytometry.
Results and Discussion
Winssinger et al.
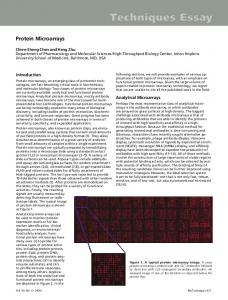
Fig. 3. Quantification of protease activity. (A) Probes 1–7 (20 l at 1.0 M) were incubated with various concentrations of caspase-3 (10 –500 nM), passed through a size-exclusion filter, and hybridized to a GenFlex (Affymetrix) microarray (seen in a false color scale). The probes at the top of the image are control probes. The intensity has been standardized in the five images for qualitative viewing purposes. (B) Correlation of protease activity and observed probe intensity. Plot of the fluorescence intensity (x axis) vs. caspase-3 concentration (y axis) with an SE of 10%.
contrast of the images shown in Fig. 3 was standardized for comparison purposes. The probe corresponding to 10 nM concentration of caspase-3 is not visible at the image intensity shown; however, at an intensity of 19 fluorescent units, the feature is 2-fold brighter than the background. Thus, for the case of caspase-3, 0.2 pmol of enzyme was sufficient for detection with this method. Profile of Crude Cell Lysates. To determine whether PNA-encoded
activity-based probes were capable of sensitively and specifically measuring differences in protein function in biological samples, we studied an in vitro system of cytotoxic lymphocyte-mediated cell death. Cytotoxic lymphocytes kill virus-infected or tumor cells through the induction of apoptosis by two contactdependent mechanisms: directed release of granules from the cytotoxic lymphocyte onto the surface of the target cell, and interaction of the Fas ligand with the Fas receptor (27). The predominant mechanism is that of granule release, where the granule protein perforin facilitates the entry of granzyme B, a granule serine protease, into the cytosol of the targeted cell. Granzyme B then initiates apoptosis primarily through the PNAS 兩 August 20, 2002 兩 vol. 99 兩 no. 17 兩 11141
BIOCHEMISTRY
Evaluation of the Sensitivity and Linearity of the Method. Peptideacrylates (AcrXxx, Fig. 2) covalently and irreversibly modify cysteine proteases through Michael addition to the active-site cysteine. Specificity of the acrylates for particular proteases can be achieved through modification of the peptide moiety. It is important to note that such acrylates are remarkably stable to nonactivated thiols such as DTT, glutathione, or thiols that are found in biological samples and buffers. Thus, combinatorial peptide libraries containing the acrylate warhead may aid in the discovery of as-yet-unidentified enzymes. In addition, peptide-acrylates specifically targeting particular proteases can be designed by using the optimal peptide sequence determined from substrate specificity libraries (23, 26). For the purpose of this study, several peptide-acrylates were designed to selectively target several cellular proteases, members of the cathepsin family, and the caspase family. To demonstrate that PNA-encoded activity probes can determine the differences in active protein concentrations quantitatively, PNA-inhibitor adducts 1–7 (Fig. 2), including the caspase-3 inhibitor (6a), were incubated with purified caspase-3 at multiple discrete concentrations ranging from 10 to 500 nM. The incubation was carried out in 20 l of PBS buffer with 5 mM DTT by using 20 pmol of each probe (1 M) for 2 h. The unbound probes were removed by a simple filtration through a 30-kDa molecular weight cutoff filter. The retained sample then was hybridized to a GenFlex oligonucleotide microarray (Affymetrix) and imaged by fluorescein fluorescence directly. As shown in Fig. 3, a good correlation was observed (SD of less than 10%) between the concentration of active caspase-3 in the assay solution and the fluorescence of the corresponding site on the microarray chip. It is important to note that the intensity and
Fig. 4. Crude cell lysate profiling. (A) Direct hybridization of compounds 1–7; (B) Incubation of compounds 1–7 with granzyme B, size exclusion, hybridization. (C) Incubation of compounds 1–7 with purified caspase-3, size exclusion, hybridization. (D) Incubation of compounds 1–7 with Jurkat crude cell lysate, size exclusion, hybridization. (E) Incubation of compounds 1–7 with crude cell lysate from Jurkat cells pretreated with granzyme B, size exclusion, hybridization.
cleavage-activation of the latent proapoptotic cytosolic cysteine protease caspase-3 (28). Molecular regulation of this process occurs at the posttranslational level. Indeed, this process is largely independent of protein synthesis and, therefore, would yield inadequate results by traditional mRNA expression profiling. This process can be conveniently modeled in vitro through the incubation of the cytosolic fraction of cellular lysates with granzyme B. Crude cell lysates from Jurkat cells were activated with granzyme B to initiate the apoptosis pathway. Based on the selectivity of the probes, incubation of the library with purified granzyme B alone did not give any signal, as expected (Fig. 4B), whereas incubation with purified caspase-3 showed an intense signal only for the probe corresponding to the caspase-3 inhibitor (Fig. 4C). With this negative and positive control at hand, we proceeded to profile apoptotic crude cell lysates from Jurkat cells and compare it to the a nonactivated sample (Fig. 4 E and D). The experiments were carried out by using 20 l of lysates at a 1 mg兾ml concentration (⬇105 cells per profile) with 20 pmol of each probes for 2 h. As in the previous experiments, the unbound probes were removed by filtration through a 30-kDa molecular weight cutoff filter, and the retained sample was then hybridized to a GenFlex oligonucleotide microarray (Affymetrix) and imaged directly by f luorescein f luorescence. Although the signal corresponding to the cathepsin inhibitors was virtually identical in the two samples, there was a dramatic difference in intensity for the probe corresponding to the caspase-3 inhibitor. Target Identification and Validation. Most profiling experiments
attempt to assign the biochemical origin of a perturbed cellular
11142 兩 www.pnas.org兾cgi兾doi兾10.1073兾pnas.172286899
Fig. 5. MS兾MS spectra of (A) triply charged and (B) doubly charged SGTDVDAANLRETFR peptides derived from human caspase-3. Prominent y92⫹ 2⫹ and y11 ions in the MS兾MS spectrum of the doubly charged precursor in B are consistent with facile cleavage C-terminal to aspartic acid residues reported in the literature (24). *, loss of the elements of water; #, loss of ammonia.
state by comparing its profile to that of an unperturbed sample. A general issue in such profiling experiments is whether the observed differences in profiles are causal or circumstantial. A feature of the approach described here is that the activity of a particular enzyme is measured by the amount of enzyme trapped by a mechanism-based inhibitor on a microarray. Such an inhibitor may be used to isolate the enzyme by affinity chromatography and as an in vitro or in vivo inhibitor to assess whether there is a correlation between the profile and phenotype. To demonstrate these two points, we used compound 6, which stood out as a clear difference between apoptotic and nonapoptotic profiles. Thus compound 6b, where the PNA has been substituted for biotin, was incubated with the same apoptotic crude cell lysates that were used in the profile. The labeled adduct then was immobilized on an avidin resin and washed to remove nonspecific adherents. The immobilized protein then was released by incubation with excess biotin and digested with trypsin. The tryptic peptides were analyzed by electrospray ionization mass spectrometry. Tandem mass spectra corresponding to doubly and triply charged SGTDVDAANLRETFR and NKNDLTREEIVELMR peptides were identified with the Winssinger et al.
database-searching program SEQUEST (Fig. 5). SEQUEST and BLAST (www.ncbi.nlm.nih.gov兾blast兾Blast.cgi) searches confirmed that these peptides could only be derived from caspase-3, validating the affinity-capture method (29). Having established a practical protocol to characterize a protein corresponding to a particular probe rapidly, we turned our attention to the use of that probe as an inhibitor of the lymphocyte-mediated cell death. The lysates where treated with caspase-3 inhibitor 6c (Fig. 2) before granzyme B activation, and apoptosis was measured by monitoring the cleavage of downstream substrates of caspase-3. As shown in Fig. 6A, caspase-3 is proteolytically converted by granzyme B to its P20兾P12 active enzyme (refs. 30 and 31; Fig. 6A Upper); however, the proteolytic degradation of DFF-45 (32) is clearly inhibited by compound 6c 1. Lockhart, D. J., Dong, H., Byrne, M. C., Follettie, M. T., Gallo, M. V., Chee, M. S., Mittmann, M., Wang, C., Kobayashi, M., Horton, H. & Brown, E. L. (1996) Nat. Biotechnol. 14, 1675–1680. 2. DeRisi, J., Penland, L., Brown, P. O., Bittner, M. L., Meltzer, P. S., Ray, M., Chen, Y., Su, Y. A. & Trent, J. M. (1996) Nat. Genet. 14, 457–460. 3. Lockhart, D. J. & Winzeler, E. A. (2000) Nature (London) 405, 827–836. 4. Welsh, J. B., Sapinoso, L. M., Su, A. I., Kern, S. G., Wang-Rodriguez, J., Moskaluk, C. A., Frierson, H. F., Jr., & Hampton, G. M. (2001) Cancer Res. 61, 5974–5978. 5. Dhanasekaran, S. M., Barrette, T. R., Ghosh, D., Shah, R., Varambally, S., Kurachi, K., Pienta, K. J., Rubin, M. A. & Chinnaiyan, A. M. (2001) Nature (London) 412, 822–826. 6. Aebersold, R. & Goodlett, D. R. (2001) Chem. Rev. 101, 269–295. 7. Haynes, P. A. & Yates, J. R., III (2000) Yeast 17, 81–87. 8. Uetz, P., Giot, L., Cagney, G., Mansfield, T. A., Judson, R. S., Knight, J. R., Lockshon, D., Narayan, V., Srinivasan, M., Pochart, P., et al. (2000) Nature (London) 403, 623–627.
Winssinger et al.
We thank Teresa Chen, Michael Hornsby, Heath Klock, Andrew Martin, Anthony Orth, and Scott Lesley for cloning, expression, and purification of human caspase-3 and human granzyme B. We thank Christopher Trussell for his assistance with the FACS analysis. We thank Dwain Braasch for helpful discussions on PNA–DNA interactions. We thank Affymetrix for their generous donation of GenFlex tag arrays. Funding was provided by the Genomics Institute of the Novartis Research Foundation (to J.L.H. and S.F.), the Skaggs Institute for Chemical Biology (to P.G.S.), and a fellowship from the National Institutes of Health (to N.W.). 9. Ito, T., Chiba, T., Ozawa, R., Yoshida, M., Hattori, M. & Sakaki, Y. (2001) Proc. Natl. Acad. Sci. USA 98, 4569–4574. 10. Iyer, V. R., Horak, C. E., Scafe, C. S., Botstein, D., Snyder, M. & Brown, P. O. (2001) Nature (London) 409, 533–538. 11. Zhu, H., Bilgin, M., Bangham, R., Hall, D., Casamayor, A., Bertone, P., Lan, N., Jansen, R., Bidlingmaier, S., Houfek, T., et al. (2001) Science 293, 2101–2105. 12. Stevens, R. C. (2000) Curr. Opin. Struct. Biol. 10, 558–563. 13. Kam, C. M., Abuelyaman, A. S., Li, Z., Hudig, D. & Powers, J. C. (1993) Bioconjugate Chem. 4, 560–567. 14. Adam, G. C., Cravatt, B. F. & Sorensen, E. J. (2001) Chem. Biol. 8, 81–95. 15. Lo, L.-C., Pang, T.-L., Kuo, C. H., Chiang, Y.-L., Wang, H.-Y. & Lin, J. J. (2002) J. Proteome Res. 1, 35–40. 16. Winssinger, N., Harris, J. L., Backes, B. J. & Schultz, P. G. (2001) Angew. Chem. Int. Ed. Engl. 40, 3152–3155. 17. Nielsen, P. E., Egholm, M., Berg, R. H. & Buchardt, O. (1991) Science 254, 1497–1500.
PNAS 兩 August 20, 2002 兩 vol. 99 兩 no. 17 兩 11143
BIOCHEMISTRY
Fig. 6. Inhibition of the apoptosis phenotype. (A) Inhibition of downstream caspase-3 mediated autoprocessing and cleavage of DFF-45 upon incubation of granzyme B-activated Jurkat lysates with inhibitor 6c. The blots were probed with anti-caspase 3 and anti-DFF45 and then visualized. (B) Inhibition of Fas-mediated apoptosis by caspase inhibitor [Z-D(OMe)E(OMe)-V-D(OMe)-FMK]. Cells were stained with both Annexin-V-EGFP and propidium iodide.
(Fig. 6A Lower). It is interesting to note that the covalent caspase-3-inhibitor adduct is detectable on this gel with a band corresponding to 22 kDa. The autoproteolysis of caspase-3 P20 subunit to the mature P17 fragment also is inhibited by 6c. We then turned our attention to a whole-cell assay of apoptosis. Jurkat cells were incubated for 12 h with the inhibitor (1 M) before the induction of apoptosis with a Fas-activating antibody. The extent of apoptosis was measured by using two different stains, Annexin V to measure phosphatidyl-serine relocation to the extracellular leaflet (early apoptosis) and propidium iodide, a membrane-impermeable DNA stain that measures the integrity of the phospholipid bilayer (indicator of late-stage apoptosis). The proportion of apoptotic cells were then measured by fluorescence-activated cell sorter (FACS). Treatment of Jurkat cells with a Fas ligand induced more than 50% apoptosis (Fig. 6B Center) relatively to the nontreated sample (Fig. 6B Left). Although the highly charged nature of compound 6c seemed to prevent membrane permeability, a close ‘‘prodrug’’ analogue, wherein the aspartic and glutamic acid are methylated (CbzAsp(OMe)-Glu(OMe)-Val-Asp(OMe)-FMK), did inhibit this Fas-mediated apoptosis (Fig. 6B Right). In this study, we have shown that, from an observed difference in profile between the apoptotic sample and the nonapoptotic sample, the corresponding inhibitor could be used to isolate and identify caspase-3 by affinity-capture from crude cell lysates and characterize it by mass spectrometry. Finally, inhibition of the apoptosis phenotype supports the critical role that caspase-3 plays in apoptosis as revealed in our profile. Although the function of capsase-3 in apoptosis has been extensively studied, it validates the approach presented herein and establishes a working protocol for subsequent discovery work based on this method. In conclusion, we have demonstrated that PNA-encoded small molecule microarrays can be a powerful tool to monitor enzymatic activity in a highly miniaturized and parallel format. We have developed and validated a methodology to characterize enzymes identified from such small molecule-based microarray. More importantly, we have demonstrated that small moleculebased profiling facilitates subsequent chemical biology investigations by providing a small molecule inhibitor to an identified enzyme of interest.
18. Dragovich, P. S., Webber, S. E., Babine, R. E., Fuhrman, S. A., Patick, A. K., Matthews, D. A., Lee, C. A., Reich, S. H., Prins, T. J., Marakovits, J. T., et al. (1998) J. Med. Chem. 41, 2806–2818. 19. Leung, D., Abbenante, G. & Fairlie, D. P. (2000) J. Med. Chem. 43, 305–341. 20. Fukuyama, T., Lin, S.-C. & Li, L. (1990) J. Am. Chem. Soc. 112, 7050–7051. 21. Zhou, Q., Snipas, S., Orth, K., Muzio, M., Dixit, V. M. & Salvesen, G. S. (1997) J. Biol. Chem. 272, 7797–7800. 22. Harris, J. L., Peterson, E. P., Hudig, D., Thornberry, N. A. & Craik, C. S. (1998) J. Biol. Chem. 273, 27364–27373. 23. Harris, J. L., Backes, B. J., Leonetti, F., Mahrus, S., Ellman, J. A. & Craik, C. S. (2000) Proc. Natl. Acad. Sci. USA 97, 7754–7759. 24. Martin, S. E., Shabanowitz, J., Hunt, D. F. & Marto, J. A. (2000) Anal. Chem. 72, 4266–4274. 25. Eng, J., McCormack, A. & Yates, J. R. (1994) J. Am. Soc. Mass. Spec. 5, 976–989.
11144 兩 www.pnas.org兾cgi兾doi兾10.1073兾pnas.172286899
26. Harris, J. L., Alper, P. B., Li, J., Rechsteiner, M. & Backes, B. J. (2001) Chem. Biol. 8, 1131–1141. 27. Froelich, C. J., Orth, K., Turbov, J., Seth, P., Gottlieb, R., Babior, B., Shah, G. M., Bleackley, R. C., Dixit, V. M. & Hanna, W. (1996) J. Biol. Chem. 271, 29073–29079. 28. Nicholson, D. W. & Thornberry, N. A. (1997) Trends Biochem. Sci. 22, 299–306. 29. Tsaprailis, G., Nair, H., Somogyi, A., Wysocki, V., Zhong, W., Futrell, J., Summerfield, S. & Gaskell, S. (1999) J. Am. Chem. Soc. 121, 5142–5154. 30. Nicholson, D. W., Ali, A., Thornberry, N. A., Vaillancourt, J. P., Ding, C. K., Gallant, M., Gareau, Y., Griffin, P. R., Labelle, M., Lazebnik, Y. A., et al. (1995) Nature (London) 376, 37–43. 31. Quan, L. T., Tewari, M., O’Rourke, K., Dixit, V., Snipas, S. J., Poirier, G. G., Ray, C., Pickup, D. J. & Salvesen, G. S. (1996) Proc. Natl. Acad. Sci. USA 93, 1972–1976. 32. Liu, X., Zou, H., Slaughter, C. & Wang, X. (1997) Cell 89, 175–184.
Winssinger et al.