International Journal of Performability Engineering, Vol. 6, No. 5, September 2010, pp. 443-452. © RAMS Consultants Printed in India
Prognostics of Interconnect Degradation using RF Impedance Monitoring and Sequential Probability Ratio Test DAEIL KWON1, MICHAEL H. AZARIAN1*, and MICHAEL PECHT1, 2 1
Center for Advanced Life Cycle Engineering (CALCE), University of Maryland, College Park, MD 20742 2 Prognostics and Health Management Center, City University of Hong Kong Kowloon, Hong Kong (Received on September 30, 2009, revised on March 23, 2010) Abstract: For electronic products, interconnect failures may occur due to mechanisms such as fatigue, creep, corrosion, and mechanical over-stress. Regardless of the failure mechanism, interconnect degradation often starts at a surface and propagates inward. DC resistance, which has been used by the electronics industry to monitor the reliability of board level interconnects, does not offer an adequate means to predict an impending failure. However, RF impedance does respond to the early stages of interconnect degradation due to the skin effect, and thus can provide a failure precursor for an interconnect. This paper presents a prognostic technique to detect interconnect failure precursors using RF impedance monitoring and the sequential probability ratio test (SPRT) under thermomechanical loading conditions. Creep tests were conducted with a test vehicle including an impedance-controlled circuit board, a surface-mount low-pass filter, and two solder joints providing both mechanical and electrical connections between them. Constant mechanical loading was directly applied to the filter at an elevated temperature in order to generate creep failures of the solder joints. During solder joint degradation, the RF impedance provided detectable failure precursors by the sequential probability ratio test, while the DC resistance remained constant with no precursors prior to the generation of an open circuit. Failure analysis of a partially degraded solder joint revealed that the change in RF impedance resulted from a partial crack that initiated at the surface of the solder joint and propagated only part of the way across the solder joint. These test results indicate that the combination of RF impedance and SPRT can provide a non-destructive and real-time means to detect solder joint degradation. Keywords: Impedance, interconnection, reliability, time domain analysis, SPRT
1.
Introduction
During the lifetime of electronics, interconnects are susceptible to failures by mechanisms such as fatigue, creep, and corrosion. Common interconnects include solder joints, printed circuit board traces, and connectors. Regardless of the failure mechanism, interconnect degradation, such as a crack, often initiates from the surface where the stresses are concentrated and propagates inward [1][2]. Interconnect failure often leads to degradation in performance, improper functioning of the product, and eventually the failure of the product.
_______________________________________________ * Corresponding author’s email:
[email protected]
443
444
Daeil Kwon, Michael H. Azarian, and Michael Pecht
Traditionally, the electronics industry has used methods based on the measurement of DC resistance to monitor the reliability of electronic products. However, DC resistance is not a practical means for detection of interconnect failure precursors, which is required for prognostics of interconnect degradation. As an alternative tool, the authors have previously reported the use of RF impedance, which provides interconnect failure precursors prior to a DC open circuit [3]. RF impedance exhibits increased sensitivity to small cracks initiated at the surface of an interconnect due to the skin effect. The skin effect is a phenomenon wherein signal propagation at frequencies of several hundred MHz or more is concentrated at the surface of a conductor. Our prior work demonstrated the greater sensitivity to interconnect degradation of RF impedance compared with DC resistance under cyclic loading conditions, and related an RF impedance increase to interconnect degradation. This paper discusses a prognostic approach to detecting solder joint failure precursors under thermo-mechanical loading conditions using RF impedance and the sequential probability ratio test (SPRT). The reflection coefficient obtained from time domain reflectometry (TDR) as a measure of RF impedance was continuously monitored during degradation of the solder joints subjected to constant shear force at an elevated temperature. SPRT was used to detect early changes in the TDR reflection coefficient and thus to calculate the prognostic distance, which is the distance in time between the failure precursor and the failure [5]. 2.
Detection of interconnect degradation
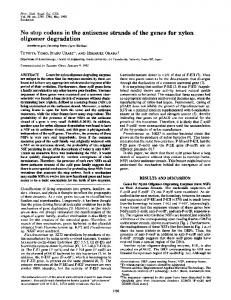
“Skin depth” refers to the thickness of the conductor within which approximately 63% of the current is contained [4]. As shown in Equation (1), the skin depth, δ, is directly related to the frequency, f, the resistivity of the conductor, ρ, and the material’s permeability, µ: ρ (1) δ= f πµ Due to the skin effect, the current density falls off exponentially with distance from the surface of a conductor; more than 99% of the current is concentrated at the periphery of the conductor within 5 skin depths from the surface. Figure 1 shows the current densities over the outer few multiples of the skin depth. Considering that the skin depth of eutectic tin-lead is only a few micrometers and that the typical diameter of a solder ball is about a few hundred micrometers, most of the current is concentrated within the periphery of a solder ball. Due to this surface concentration of current, high frequency signals are more sensitive than DC resistance to physical changes at the periphery of a solder joint, such as a crack. Time domain reflectometry (TDR) is a technique that characterizes faults in the circuit using signal reflection over the time domain. It measures the reflection coefficient, which is essentially a ratio of the reflected voltage of the signal sent at a port to that of the transmitted signal from the same port. A solder joint can be characterized by monitoring the reflection coefficient at the location of the solder joint. As shown in Equation (2), the TDR reflection coefficient (Γ) can range from -1 to 1, which corresponds to impedance values of zero and infinity, respectively. It may be conveniently reported in milliunits (mU).
Prognostics of Interconnect Degradation using RF Impedance Monitoring and Sequential Probability Ratio Test 445
Z L − Z0 Z L + Z0
Γ=
(2)
where ZL and Z0 denote the impedance of the device under test and the characteristic impedance of the circuit, respectively. TDR has been widely used to characterize interconnect discontinuities in an electronic package. Since TDR is able to isolate a failure site at the level of an individual lead or solder joint, it has been used to diagnose small structures of an electronic assembly. Furthermore, TDR can be implemented as a prognostic tool that can detect incipient changes of interconnect degradation when it is incorporated into an in-situ monitoring circuit.
Current density (%)
100 80 60 40 20 0 0
1
2
3
4
5
6
Multiples of skin depth (n*δ )
Figure 1: Current density variation over the multiples of skin depth
SPRT is a statistical hypothesis test that determines whether the test data falls into the probability density distribution of the training data that serves as a healthy baseline [6][7]. SPRT detects changes in the test data by conducting a statistical hypothesis test in which null and alternative hypotheses are compared with each other. The null hypothesis is where the test data adheres to a Gaussian distribution with a mean of 0 and a variance of σ2 extracted from the training data, which represents the healthy test data. The alternative hypotheses are where the test data deviates from the training data due to mean shifting or changes in variance. A positive mean test, for example, evaluates whether the mean of the test data is shifted by an increment of at least M in the positive direction, where M is a system disturbance level determined by the user. This case indicates that the system is degrading. An SPRT index is the logarithm of the ratio of the probability that the alternative hypothesis is true to the probability that the null hypothesis is true. Given the null and alternative hypotheses, the SPRT index is
SPRT =
M
σ
2
n
∑ x
k
k =1
−
M 2
(3)
where xk represents sequential observations of the test data. The SPRT index is continuously calculated and compared to the lower and upper threshold limits, which are set by the user and related to the sensitivity of detection. When the SPRT index is less than the lower boundary, it can be concluded that the test data is healthy; when the SPRT index is greater than the upper boundary, the alternative hypothesis is accepted, which indicates that the test data has become
446
D. Kwon, M. H. Azarian, and M. Pecht
abnormal. Thus, the application of the SPRT to the monitoring of RF impedance and DC resistance can help identify incipient changes in the parameters due to interconnect degradation related to the solder joint failure precursors. 3.
Experimental setup
A test circuit was prepared to simultaneously monitor the TDR reflection coefficient and DC resistance during creep testing, as shown in Figure 2. The test circuit consisted of an impedance-controlled circuit board, two bias-tees, a Wheatstone bridge, a vector network analyzer, and several RF cables that connected these elements to each other. The circuit board contained two eutectic tin-lead solder joints that provided both mechanical and electrical connections between the board and a surface mount technology (SMT) low pass filter. The bias-tees combined and extracted the RF and the DC signals in order to allow for simultaneous monitoring of TDR reflection coefficient and DC resistance. The Wheatstone bridge and the vector network analyzer were connected with the DC and the RF ports of the bias-tees, respectively, and thus, measured the DC resistance and the TDR reflection coefficient at the solder joint.
Bias-Tee
SMT low pass filter (LPF) on 50 Ohm controlled impedance board
RF RF+DC
Temperature chamber
DC
Wheatstone bridge
LPF
Vector Network Analyzer
Constant load
Bias-Tee DC
Solder joints
RF RF+DC
Figure 2: Schematic of the test circuit
An MTS Tytron 250 was used to apply a constant load to the solder joints and to control the temperature of the chamber in which the test circuit board was placed during creep testing. A Keithley 2010 digital multimeter and an Agilent E8364A vector network analyzer were used to monitor the output voltage of the Wheatstone bridge and the TDR reflection coefficient, respectively. The VNA was capable of generating and monitoring signals over a frequency range of 45 MHz to 50 GHz. Both instruments were externally controlled to allow automated data acquisition. 4.
Test conditions
A constant mechanical shear force of 10 N at an elevated temperature was applied to the low pass filter in order to generate creep failures of the solder joints. The test circuit board was put in a temperature chamber where the temperature was held at 125 °C during creep testing. The homologous temperature was calculated to be 0.87 for eutectic tin-lead, which was high
Prognostics of Interconnect Degradation using RF Impedance Monitoring and Sequential Probability Ratio Test 447
enough to expect creep failures. The shear force maintained the contact between the force transducer and the low pass filter throughout the entire test until the solder joint was ruptured by creep. A ceramic material was inserted to prevent electrical noise due to physical contact between the metal tip of the force transducer and the low pass filter. The monitored frequency range for the TDR reflection coefficient was chosen to be 500 MHz to 6 GHz. According to Equation (1), above approximately 500 MHz the skin depth for eutectic tin-lead becomes less than about a tenth of the solder joint thickness. Since many commercial products are currently operating at frequencies up to a few GHz, the upper end of the monitored frequency was selected to be 6 GHz. For the TDR reflection coefficient measurement, the network analyzer swept across the frequency range defined above and collected the reflection coefficients over the frequency domain. It then applied an inverse Fourier transform to the frequency domain measurement results and obtained the time domain measurement results. Instrumental control software was used to instruct the multimeter and the vector network analyzer to collect the output voltage of the Wheatstone bridge and the TDR reflection coefficient, respectively, every 30 seconds. The collected output voltages were converted into DC resistances using the relationship among the bridge elements. Each set of TDR measurement data contained a set of reflection coefficient values over the partial signal path of the circuit board collected at a particular instant during the creep test. In order to monitor changes to the interconnect over time and allow comparison with DC resistance, the TDR reflection coefficients at the location of a specific solder joint were extracted and displayed in a plot as a function of test duration. During each experiment the TDR responses and the output voltages were simultaneously monitored until the thermo-mechanical stresses resulted in a DC open circuit or until an SPRT alarm was generated. In order to identify solder joint failure precursors, the SPRT was applied to both the TDR reflection coefficient and the DC resistance individually. It was assumed that the data points from 0 to 200 minutes of each parameter in a test represented the responses from a nondegraded solder joint, and thus these data points were taken for the training data, respectively. Based on the training data selected, the SPRT could detect the time at which the test data deviated from the distribution of the training data. In order to reduce the effect of measurement noise on the test data, at least five consecutive detections were considered as a real deviation due to degradation. 5.
Test results
In order to identify solder joint failure precursors, a number of creep tests were conducted. Most tests were concluded when the DC resistance exhibited a sudden increase, indicating a complete separation of the solder joint. Until then, the TDR reflection coefficient and the DC resistance were simultaneously monitored and displayed together. Figure 3 shows the results of a creep test. The total duration of the test was 503 minutes, at which a DC open circuit was observed. In the beginning of the test, both the TDR reflection coefficient and the DC resistance remained around their initial values. However, as the test progressed, the TDR reflection coefficient gradually increased in response to the mechanical degradation of the solder joints, while the DC resistance remained constant despite the high sensitivity of the Wheatstone bridge.
448
D. Kwon, M. H. Azarian, and M. Pecht
The prognostic distances for the TDR reflection coefficient and the DC resistance were calculated in order to quantify their respective sensitivities in detecting early stages of solder joint failure. Here, a prognostic distance was defined as the difference in time between the failure precursor detected by the SPRT and the actual failure observed by a DC open circuit. In the creep test shown in Figure 3, the SPRT detected deviation of the TDR reflection coefficient at 414 minutes, which resulted in a prognostic distance of 89 minutes, equivalent to 18% of the total lifetime. Meanwhile, SPRT did not detect any deviation in the DC resistance until the solder joint failed. Figure 4 shows the result of another creep test comparing the TDR reflection coefficient with the DC resistance. The SPRT monitored both the RF and the DC responses during creep testing in order to detect solder joint failure precursors. As shown in the previous result, both the TDR reflection coefficient and the DC resistance remained around their initial values at the beginning of the test. As the test progressed, the TDR reflection coefficient showed a gradual increase. The SPRT detected deviation in the TDR reflection coefficient at 220 minutes, and the test was stopped for further failure analysis of the degraded solder joint. The sample was potted in epoxy and cross-sectioned to reveal the cracked solder joint on a plane orthogonal to the long axis of the filter, as shown in Figure 5. 100
4.6 RF precursor with SPRT at 414 min
80
4.5 No DC precursor with SPRT
60
4.4 TDR reflection coefficient at the failure site
40
4.3
DC resistance
20
4.2
0
4.1 0
100
200
300
400
DC resistance (Ohms)
TDR reflection coefficient (mU)
DC open circuit at 503 min
500
Test time (min) Figure 3: Detection of solder joint failure precursors using SPRT
Figure 6 shows a scanning electron microscope (SEM) image taken after cross-sectioning. On the left side of the solder joint a partial crack that had initiated from the surface where the shear force was applied and propagated inward was clearly observed. The direction of the crack propagation coincided with that of the applied shear force. On the other hand, the opposite side of the solder joint was still intact. The partial crack was responsible for the changes in the TDR reflection coefficient which were detectable by the SPRT, whereas the intact part of the solder joint provided an adequate signal path through which the DC current
Prognostics of Interconnect Degradation using RF Impedance Monitoring and Sequential Probability Ratio Test 449
could pass. These results provide clear evidence that TDR reflection coefficient exhibits greater sensitivity than DC resistance in response to interconnect degradation due to the skin effect. 4.8 SPRT alarm at 220 min 48
4.7 TDR reflection coefficient
46
4.6
44
4.5 DC resistance
42
4.4
40
DC resistance (Ohms)
TDR reflection coefficient (mU)
50
4.3 0
50
100
150
200
250
Test time (min) Figure 4: Comparison between RF and DC responses during a creep test
Figure 5: Cross-sectioning direction and plane of observation Table 1: Summary of test results with prognostic distances of RF impedance
Test
Time to failure (min)
1 2 3 4 5
503 962 377 236 429
Failure precursor of RF impedance (min) 414 898 267 209 418
Prognostic distance (min) (%) 89 18 64 7 110 29 27 11 11 3
450
D. Kwon, M. H. Azarian, and M. Pecht
Table 1 shows a summary of several test results with prognostic distances of RF impedance. In every case, the SPRT detected the failure precursors of the TDR reflection coefficients prior to the separation of the solder joints, while no failure precursors of the DC resistance were observed. The prognostic distances showed a little variation depending on a few test conditions that were not controlled, such as the amount and shape of the solder fillets. These experiments confirm that the test results were qualitatively repeatable in general.
Shear force direction Solder joint Partial crack
Copper pad Figure 6: Cross-sectional SEM image of degraded solder joint
6.
Conclusions
It has been demonstrated that RF impedance provides earlier indication of interconnect degradation than DC resistance using SPRT under thermo-mechanical loading conditions. A test vehicle was developed to allow direct comparison of RF impedance and DC resistance while the solder joints were stressed by a constant shear force at an elevated temperature. DC resistance, a traditional measure of electrical continuity, did not provide any detectable changes until a DC open circuit occurred. However, RF impedance responded to the early stages of solder joint degradation that were detectable by SPRT. Over multiple trials, the prognostic distances for RF impedance were always positive, which indicated RF impedance combined with the SPRT always provided early warning of solder joint failure. Therefore, RF impedance monitoring can serve as a non-destructive early indicator of solder joint degradation. These test results imply that RF impedance is a useful and effective means for monitoring interconnect degradation. For reliability monitoring of electronic products, the electronics industry has been using either event detectors or data loggers, which monitor DC resistance. RF impedance may be used in place of DC resistance in order to enhance the detection sensitivity to interconnect degradation and thus improve reliability assessment. Moreover, reliability assessment using RF impedance would produce more accurate results for high speed electronic products, which are sensitive to physical degradation from the interconnect surface that would go unnoticed with a traditional means such as DC resistance.
Prognostics of Interconnect Degradation using RF Impedance Monitoring and Sequential Probability Ratio Test 451
Furthermore, RF impedance monitoring shows potential as a prognostic tool that can provide advance warning of interconnect failures. Statistical anomaly detection techniques such as the SPRT can compare real-time measurements of RF impedance to the training data that represents the healthy state in order to identify the time at which the interconnect begins to degrade. This event can be a failure precursor. Upon the observation of a failure precursor, the damage level associated with interconnect degradation can be related to changes in RF impedance. According to the damage level obtained using RF impedance, one can perform condition-based maintenance, thereby increasing product availability and reducing unplanned down-time, before the degradation has adverse consequences. Future work on this topic will involve an investigation of alternative loading conditions such as thermal fatigue or chemical loadings, developing a solder joint failure model by trending RF impedance responses, and testing of more complex test vehicles and interconnect structures. Acknowledgement: This work was funded by the members of the CALCE Electronic Products and Systems Consortium, and the CALCE Prognostics and Health Management Consortium at the University of Maryland. This work was also supported in part by the NASA ARMD/IVHM program under NRA project 07-IVHM1-07-0042 (‘‘Reliable Diagnostics and Prognostics for Critical Avionic Systems”). In addition, the work described in this paper was also partially supported by a grant from the Research Grants Council of the Hong Kong Special Administrative Region, China (CityU8/CRF/09). References [1]. Pecht, M., P. McCluskey, and J. Evans. Failures in Electronic Assemblies and Devices. in Product Integrity and Reliability in Design. J. Evans and J. Evans, Eds., London: Springer-Verlag 2001; 204-232. [2]. Andersson, C., D. Andersson, P. Tegehall, and J. Liu. Effect of Different Temperature Cycle Profiles on the Crack Propagation and Microstructural Evolution of Lead Free Solder Joints of Different Electronic Components. 5th Int. Conf. on Thermal and Mechanical Simulation and Experiments in Micro-electronics and Micro-systems, Brussels, Belgium 2004; 455-464. [3]. Kwon, D., M. H. Azarian, and M. Pecht. Early Detection of Interconnect Degradation by Continuous Monitoring of RF Impedance. IEEE Trans. on Device and Materials Reliability 2009; 6(2): 296-304. [4]. Thierauf, S. C., High-Speed Circuit Board Signal Integrity. Massachusetts: Artech House Inc. 2004. [5]. Vichare, N., and M. Pecht. Prognostics and Health Management of Electronics. IEEE Trans. on Components and Packaging Technologies 2006; 29(1): 222–229. [6]. Humenik, K., and K. Gross. Sequential Probability Ratio Tests for Reactor Signal Validation and Sensor Surveillance Applications. Nuclear Science and Engineering 1990; 105. [7]. Gross, K., and W. Lu. Early Detection of Signal and Process Anomalies in Enterprise Computing Systems. IEEE Int’l Conf. on Machine Learning and Applications, Las Vegas, NV 2002.
452
D. Kwon, M. H. Azarian, and M. Pecht
Daeil Kwon is currently working towards a Ph.D. degree in the Center for Advanced Life Cycle Engineering (CALCE) at the University of Maryland, College Park. He received a Bachelors degree in Mechanical Engineering from POSTECH, Republic of Korea. His research interest is focused on interconnect reliability, electronic packaging and prognostics of electronic products. Michael H. Azarian is a research scientist at the Center for Advanced Life Cycle Engineering (CALCE) at the University of Maryland. He holds a Ph.D. in Materials Science and Engineering from Carnegie Mellon University, a Masters degree in Metallurgical Engineering and Materials Science from Carnegie Mellon, and a Bachelors degree in Chemical Engineering from Princeton University. His research on reliability of electronic products has led to publications on electrochemical migration, capacitor reliability, electronic packaging, and tribology. He is on the editorial advisory board of Soldering and Surface Mount Technology, and is technical editor of the draft IEEE standard 1624 on organizational reliability capability, for assessing suppliers of electronic products. He holds 5 U.S. patents for inventions in data storage and contamination control. Before joining CALCE, he spent 13 years in the disk drive, advanced materials, and fiber optics industries, most recently as Manager of Quality and Reliability at Bookham Technology. Michael Pecht is currently visiting Professor in Electrical Engineering at City University of Hong Kong. He has an M.S. in Electrical Engineering and an M.S. and Ph.D. in Engineering Mechanics from the University of Wisconsin at Madison. He is a Professional Engineer, an IEEE Fellow, an ASME Fellow and an IMAPS Fellow. He was awarded the highest reliability honor, the IEEE Reliability Society’s Lifetime Achievement Award in 2008. He served as Chief Editor of the IEEE Transactions on Reliability for eight years and on the advisory board of IEEE Spectrum. He is Chief Editor for Microelectronics Reliability and an associate editor for the IEEE Transactions on Components and Packaging Technology. He is also the Regional Editor for Americas for International Journal of Performability Engineering. He is the founder of CALCE (Center for Advanced Life Cycle Engineering) at the University of Maryland, College Park, where he is also the George Dieter Chair Professor in Mechanical Engineering and a Professor in Applied Mathematics. He has written more than twenty books on electronic products development, use and supply chain management and over 400 technical articles. He has been leading a research team in the area of prognostics for the past ten years. He has consulted for over 100 major international electronics companies, providing expertise in strategic planning, design, test, prognostics, IP and risk assessment of electronic products and systems. He has previously received the European Micro and Nano-Reliability Award for outstanding contributions to reliability research, 3M Research Award for electronics packaging, and the IMAPS William D. Ashman Memorial Achievement Award for his contributions in electronics reliability analysis.