essential to have cheap, efficient and reliable methods of sensor- motor code ... therefore no dedicated languages are needed between the robot and the ...
1
Programming Mobile Robots by Demonstration through System Identification O. Akanyeti1 , U. Nehmzow1 , C. Weinrich1 , T. Kyriacou1 and S.A. Billings2
Abstract— For certain mass-marked robot applications it is essential to have cheap, efficient and reliable methods of sensormotor code generation, hand-programming is not a viable option in such cases. We present a new method to program mobile robots — “code identification by demonstration” — which algorithmically transfers human behaviours directly to robot control code, using transparent mathematical functions. In contrast to traditional robot programming techniques, our method does not require specialised technical or programming skills, but translates demonstrated behaviour immediately into executable code. This has obvious implications for the widespread use of personal service robots. The proposed method is fast and computationally cheap, and has the additional advantage of generating transparent, i.e. analysable controllers using polynomials, which permits hypothesis formation and theoretical analysis of robot behaviour, for example for stability and safety analyses. We demonstrate the viability of this approach by teaching a Scitos G5 mobile robot to achieve corridor following behaviour. Index Terms— system identification, robot programming, demonstration, polynomials
I. I NTRODUCTION Programming mobile robots by demonstration is not new to robotics community [Demiris and Johnson, 2003]. The viability of this approach was demonstrated in tasks such as maze navigation [Demiris and Hayes, 1996, Hayes and Demiris, 1994], arm movement [Schaal, 1997] or service robotics [Pardowitz et al., 2007]. Teaching through demonstration has several advantages: • Efficiency in generating robot controllers: Traditional robot programming techniques are costly, timeconsuming and error prone [Iglesias et al., 2005]. • Little or no need for programming skills: The programmer does not have to have any specialised programming skills, end-users can “program” their robots individually according to their own preferences and needs by demonstration. • Implicit communication: No explicit communication, and therefore no dedicated languages are needed between the robot and the programmer. The programmer communicates with the robot through the environment by demonstrating the desired behaviour in the target environment. Translating Human Behaviour Into Robot Control Code Existing methods of robot training by demonstration involve an interpretation, “understanding” of the demonstrator’s example, and are typically concerned with a particular application 1 Department 2 Department
Sheffield, UK.
of Computer Science, University of Essex, UK of Automatic Control and Systems Engineering, University of
scenario. In other words, they are specialised, and often require specialised knowledge to operate successfully. The aim of our research, in contrast, was to develop training by demonstration methods that translate human behaviour directly into robot control code, without using traditional computer programs, programmer’s skills or dedicated robotics knowledge. We achieve this goal by using system identification. In [Nehmzow et al., 2007] we presented a novel method to translate human behaviours into robot control code algorithmically, using system identification techniques such as Armax (Auto-Regressive Moving Average models with eXogenous inputs) [Eykhoff, 1974] and Narmax (Nonlinear Armax) [Billings and Chen, 1998]. These techniques produce linear or nonlinear polynomial functions that model the relationship between the robot’s sensor perception and motor response. In [Nehmzow et al., 2007] we demonstrated the viability of this approach by teaching a Scitos G5 mobile robot to achieve wall following and corridor following behaviour. Here, we extend that work by scaling up the complexity of the task and by improving the experimental method by adding a performance metric that guides the data logging procedure. Our method has three stages: i) The human operator demonstrates the desired behaviour to the robot. ii) the robot imitates the desired behaviour blindly (i.e. without using sensor perception), using recursive, sensor-free polynomials. During this run through the task the robot logs perceptionaction data to obtain a sensor-based control model, and iii) using the logged data, we obtain a sensor-based controller, using transparent mathematical functions which capture the fundamental relationship between the robot’s perception and the desired motor response.
II. M ETHODOLOGY AND E XPERIMENTAL S ETUP
A. Narmax system identification methodology The Narmax modelling approach is a parameter estimation methodology for identifying both the important model terms and the parameters of unknown nonlinear dynamic systems. For multiple input, single output noiseless systems this model takes the form of equation 1. A detailed discussions can be found in [Billings and Chen, 1998], [Korenberg et al., 1988, Billings and Voon, 1986].
2
+ lv y(n)
=
f (u1 (n), u1 (n − 1), u1 (n − 2), · · · , u1 (n − Nu ),
(1)
−
··· , u1 (n)l , u1 (n − 1)l , u1 (n − 2)l , · · · , u1 (n − Nu )l ,
u8
u2 (n)2 , u2 (n − 1)2 , u2 (n − 2)2 , · · · , u2 (n − Nu )2 , l
u10
l
u2 (n) , u2 (n − 1) , u2 (n − 2) , · · · , u2 (n − Nu ) , ··· ,
u11 angle 240
ud (n), ud (n − 1), ud (n − 2), · · · , ud (n − Nu ), 2
2
2
2
ud (n) , ud (n − 1) , ud (n − 2) , · · · , ud (n − Nu ) , ··· , ud (n)l , ud (n − 1)l , ud (n − 2)l , · · · , ud (n − Nu )l , y(n − 1), y(n − 2), · · · , y(n − Ny ), y(n − 1)2 , y(n − 2)2 , · · · , y(n − Ny )2 , ··· , y(n − 1)l , y(n − 2)l , · · · , y(n − Ny )l )
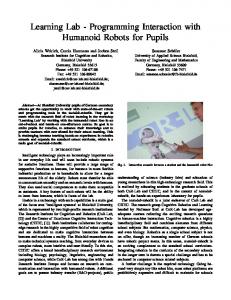
y(n) and u(n) are the sampled output and input signals at time n respectively, Ny and Nu are the regression orders of the output and input respectively, d is the dimension of the input vector and l is the degree of the polynomial. f () is a non-linear function and here taken to be a polynomial multi-resolution expansion of its arguments. Expansions such as multi-resolution wavelets or Bernstein coefficients can be used as an alternative to the polynomial expansions considered in this study. The representation of the task as a transparent, analysable model enables us to investigate the various factors that affect robot behaviour for the task at hand. For instance, we can identify input-output relationships such as the sensitivity of a robot’s behaviour to particular sensors [Roberto Iglesias and Billings, 2005], or make predictions of behaviour when a particular input is presented to the robot [Akanyeti et al., 2007]. B. Experimental Setup The experiments described in this paper were conducted in the 100 square meter circular robotics arena of the University of Essex. The arena is equipped with a Vicon motion tracking system which can deliver position data (x, y,z) using reflective markers and high speed, high resolution cameras. The tracking system is capable of sampling the motion at up to 100Hz with sub-millimetre accuracy. We used the Scitos G5 mobile robot DAX (figure 1). The robot is equipped with a ring of 24 sonar sensors, uniformly distributed. A Hokuyo laser range finder is also present on the front part of the robot. This range sensor has a wide angular range of 240◦ with a radial resolution of 0.36◦ , and distance resolution of less than 1 cm. The robot’s colour camera (640x480 pixels at 60 Hz) was not used in the experiments reported here. C. Experimental Procedure Human demonstration: First, the human user demonstrates the desired behaviour by performing it in the target
u5 u4 u3
u9
··· , l
u6
u7
u2 (n), u2 (n − 1), u2 (n − 2), · · · , u2 (n − Nu ),
l
av −
+
u1 (n)2 , u1 (n − 1)2 , u1 (n − 2)2 , · · · , u1 (n − Nu )2 ,
laser
robot
(a)
u2 u1 angle 0
(b)
Fig. 1. (a) DAX. The robot’s laser range finder has an angular coverage of 240◦ , with a radial resolution of 0.36◦ and distance resolution of less than 1 cm. To decrease the dimensionality of the input space to the Narmax model, we coarse coded the laser readings into 11 sectors (u1 to u11 ) by averaging 62 readings for each 22◦ interval (b).The robot’s two degrees of freedom used here were translational and rotational velocity. Positive and negative translational velocities indicate forward and backward movement respectively. Positive and negative rotational velocities indicate left and right turns respectively.
environment. For the purpose of this paper we confined our experiments to 2-dimensional navigation problems reflecting the motion capabilities of our robot (2 degrees of motion, translational and rotational). During this initial demonstration, we log the x and y position of the human user with a sampling rate of 50Hz. Once the operator’s trajectory is logged, we compute the translational and rotational velocities of the human by using consecutive (x, y) samples along the trajectory. Obtaining sensor-free controllers: In a second stage, we use the Narmax system identification method to obtain two sensor-free polynomials, one expressing rotational velocity as a function of time and past rotational velocities, the other expressing the translational velocity as a function of time and past linear velocities. We then use these two sensor-free polynomials to drive the robot along the trajectory the human had taken earlier, now logging sensor readings and velocities. We use a sampling frequency of 10Hz at this stage. Obtaining the final, sensor-based controllers: The sensorfree controllers obtained at stage II are ballistic controllers that drive the robot along the desired trajectory as long as the robot is started from the same initial positions as the human. However, for real-world applications it is essential that sensor feedback is used to control the motion of the robot. In the final stage we therefore use the Narmax system identification method to obtain sensor-based controllers, using the previously logged sensor-motor pairings (see also figure 2). This controller can subsequently be used to control the robot in the target environment, copying the original behaviour exhibited by the human demonstrator. III. E XPERIMENTS We first demonstrate the viability of the proposed approach by obtaining a corridor-following controller for DAX, using human demonstration as outlined above. In a second experiment we refine the sensor-free controller stage by augmenting it with a low-level collision avoidance behaviour, and finally
3 Stage 1 Human Demonstration
Trajectory Pre~processing
Stage 2
Stage 3
av(n) = −0.005 +0.001 ∗ u(n, 1) +0.001 ∗ u(n, 1)2 −0.001 ∗ u(n, 1)3 +0.818 ∗ y(n − 1) +0.158 ∗ y(n − 1)2 −0.276 ∗ y(n − 1)3 +0.001 ∗ u(n, 1) ∗ y(n − 1) −0.001 ∗ u(n, 1)2 ∗ y(n − 1)
+0.347 +0.004 ∗ u(n, 1) −0.001 ∗ u(n, 1)2
Sensor−free Controller
Training data Acquisition
lv(n) =
Sensor−based Controller
Fig. 2. Method. First, translational and rotational velocities of the human are logged and low-pass filtered. This data is used in the second stage to construct two sensor-free controllers. Finally, we use logged sensor-motor data logged during the second stage to obtain two sensor-based controllers (see also [Nehmzow et al., 2007]).
TABLE I T WO SENSOR - FREE POLYNOMIALS TO DRIVE THE ROBOT “ BLINDLY ” 3. lv(n) IS THE av(n) THE ROTATIONAL VELOCITY IN
ALONG THE HUMAN TRAJECTORY GIVEN IN FIGURE TRANSLATIONAL VELOCITY IN M / S ,
RAD / S AT SAMPLING POINT
n.
scale the complexity of the task by training the robot to perform an continuous, circular corridor-following behaviour. A. Experiment 1: Corridor Passing In the first experiment, we demonstrated to the robot how to pass through a U-shaped corridor of 150 cm width (figure 3), by starting from the right side and walking to the end of the corridor. During this time, the position of human was logged in every 20ms.
Fig. 4. Experiment 1. The trajectory of the robot under control of the sensorfree polynomials given in table I. The models drive the robot along the human trajectory given in figure 3 without using any sensory perception. During this run, the robot logs its own perception and velocity commands. The logged data is then used to obtain the final, sensor-based controllers which link the perception of the robot to motor commands.
Fig. 3. Experiment 1. The trajectory of the human demonstrator in the Ushaped corridor environment. The width of the corridor is 150 cm. The oscillation in the motion originates from the swinging motion of the demonstrator perpendicular to heading direction. This is a general characteristic of two legged locomotion, and was subsequently removed from the data by low pass filtering.
We then used the Narmax system identification method to obtain two sensor-free controllers for the translational velocity and the rotational velocity. Both models are given in table I. After obtaining these sensor-free polynomials, we use them to drive the robot in the U-shaped corridor (figure 4). During this run, the laser readings and the robot’s translational and rotational velocities were logged every 100 ms. Sensor Signal Encoding: In order to decrease the dimensionality of the input space to the Narmax model, we coarse coded the laser readings into 11 sectors by averaging 62 readings for each 22◦ interval. We then used the Narmax identification procedure to estimate the robot’s translational and rotational velocities as a function of the coarse coded laser readings (u1 , u2 , · · · , u11 ). Both models are given in table II. Qualitative Model Validation: We then validated the sensor-based models given in table II by letting them control the robot in the U shaped corridor. We started the robot from
10 different locations, and observed correct corridor following behaviour in all cases. The resulting trajectories are shown in figure 5. B. Experiment 2: Augmenting the Sensor-free Controllers with low-level Collision Avoidance As the sensor-free models do not use any perceptual information when controlling the robot, slight perturbations or deviations in initial conditions can cause the robot to collide with walls or get trapped in dead ends. Rather than being robust, sensor-free control is highly sensitive to initial conditions, which results in brittle control. Admittedly, the sensor-free controller is only needed once to obtain sensormotor pairings for the acquisition of the final, sensor-based model, but nevertheless we were interested to improve this part of our experimentation, especially as we believe that these problems need to be solved to scale up to more complex tasks. The performance of the final, sensor-based controllers are crucially dependent on how well the robot was able to follow the human trajectory blindly, because the logged training data set determines the quality of the sensor-based controller. We therefore added a low-level collision avoidance behaviour to the second stage of our model acquisition process, which
4
lv(n) =
av(n) = +1.011 −0.037 ∗ u(n, 1) +0.164 ∗ u(n, 2) +0.147 ∗ u(n, 3) −0.128 ∗ u(n, 4) −0.116 ∗ u(n, 5) −0.051 ∗ u(n, 6) −0.075 ∗ u(n, 7) −0.051 ∗ u(n, 8) −0.074 ∗ u(n, 9) −0.131 ∗ u(n, 10)
+0.570 +0.002 ∗ u(n, 1) +0.069 ∗ u(n, 2) +0.052 ∗ u(n, 3) −0.181 ∗ u(n, 4) −0.046 ∗ u(n, 5) −0.049 ∗ u(n, 6) −0.038 ∗ u(n, 7) −0.020 ∗ u(n, 9) −0.050 ∗ u(n, 10)
TABLE II T WO SENSOR - BASED POLYNOMIALS WHICH LINK THE ROBOT ’ S PERCEPTION TO MOTOR COMMANDS IN ORDER TO ACHIEVE THE BEHAVIOUR SHOWN IN FIGURE
3. lv(n) AND av(n) ARE THE ROBOT ’ S
TRANSLATIONAL VELOCITY IN M / S AND ROTATIONAL VELOCITY IN RAD / S AT SAMPLING POINT
the trajectory and total sa f ety time is the total time in which collision avoidance controlled the robot. Obviously, P varies from 1 (perfect) to 0 (collision avoidance used 100% of the time). Obtaining the training data set for the final, sensor-based models: We then used P to determine how much of the logged data from each run should be used in the formation of the general training data set, as follows. As a first step, we did not use any data at all from runs where P was lower than 0.4. From the remaining data, we removed all data points logged in the 2-second time interval before and after the safety mechanism took over control of the robot. We then select training data from the remaining data points in proportion to P obtained for that run.
n. u1 TO u11 ARE THE LASER BINS DEFINED IN FIGURE
1.
C. Experiment 3: Circular Corridor Traversal Scaling up from the corridor passing experiment 1, we modified the environment by closing both ends of the corridor and performing a repeated, circular motion in this environment (see figure 6).
Fig. 5. Experiment 1. Model validation: Ten trajectories of the robot under control of the sensor-based controllers given in table II.
gave us the additional advantage that it can be used to obtain feedback concerning the quality of the logged data (see below). Integration of Collision Avoidance to sensor-free controllers: We integrated the collision avoidance program with the sensor-free controllers such that the robot is always driven by the sensor-free controllers, unless it leaves a predefined “safe zone”, when the collision avoidance mechanism takes over. The safe zone was defined as having the shortest laser range reading greater than 50 cm. Besides preventing the robot from colliding with obstacles, we also used the safety mechanism to provide performance feedback. As any subsumption of the sensor-free controllers by the collision avoidance behaviour is an indication that the robot is deviating from the prescribed trajectory, we can use the activation of collision avoidance as an indication of how well the robot is following the target trajectory. We therefore computed the ratio P of collision avoidance time to total travel time as a performance measure, as given in equation 2. P=
total task time − total sa f ety time , total task time
(2)
where total task time is the total time needed to complete
K
Fig. 6. Experiment 3. The trajectory of the demonstrator in a closed U shaped corridor environment of 150cm width. He started from the right end of the corridor, walked until the left end, then turned around at point K and walked back to its starting location. Again we see a sideways oscillation in the human’s motion, which is later filtered out.
Obtaining the sensor-free controllers: Using the real velocity graphs of the human (figure 7), we divided the observed human trajectory into three sections: i) going forward until the end of the corridor, ii) turning around and iii) coming back to the starting location. We represented each sub trajectory with its own dedicated sensor-free lv and av models. These models are given in table III. Obtained the final, sensor-based controllers: Having obtained the sensor-free models, we let the models (plus the hardwired collisions avoidance mechanism) drive the robot in the U corridor environment, starting from 5 different locations. For each run, we logged the laser readings and the robot’s translational and rotational velocities every 100ms. Figure 8 shows two sample trajectories. When the robot was started from the correct initial location, the models were able to control the robot correctly, not invoking the collision avoidance. However, a slight change in initial condition could cause the robot to deviate from the desired trajectory, requiring the hard wired collision avoidance to intervene. Sharp directional
5
trans. vel.
(m/s)
sub trajectory 1 lv(n) = −0.103 +0.018 ∗ u(n, 1) −0.001 ∗ u(n, 1)2 +0.001 ∗ u(n, 1)3 −0.001 ∗ u(n, 1)4 sub trajectory 2 lv(n) = +0.000 sub trajectory 3 lv(n) = −0.103 +0.018 ∗ u(n, 1) −0.001 ∗ u(n, 1)2 +0.001 ∗ u(n, 1)3 −0.001 ∗ u(n, 1)4
0.8 0.6 0.4 0.2 0.0
outward journey
−0.2 −0.4 −0.6
0
10
20
return journey turning at point K 30
40
50
60
70
80
time (s) turning at point K
rot. vel. (rad/s) 0.8
outward journey
0.6
return journey
0.4 0.2 0.0
+0.30 −0.004 ∗ u(n, 1) +0.001 ∗ u(n, 1)2 −0.001 ∗ u(n, 1)3 +0.001 ∗ u(n, 1)4 av(n) = 0.400 av(n) = −61.256 +0.459 ∗ u(n, 1) −0.001 ∗ u(n, 1)2 +0.001 ∗ u(n, 1)3 −0.001 ∗ u(n, 1)4
TABLE III
−0.2 −0.4 −0.6
av(n) =
0
10
20
30
40
50
60
70
80
time (s)
Fig. 7. Translational and rotational velocity graphs of the human demonstrator trajectory shown in figure 6. We modelled the whole trajectory in three separate sections: i) walking from the right end of the corridor to the left (outward journey), ii) turning motion at point K (see figure 6) and iii) walking back to the starting location (return journey). For each trajectory, we obtained a separate sensor-free polynomial (see table III).
T HE SENSOR FREE CONTROLLERS TO FOLLOW THE HUMAN TRAJECTORY SHOWN IN FIGURE 6 WHERE lv(n) AND av(n) ARE THE TRANSLATIONAL VELOCITY ( IN
m/s) AND ROTATIONAL VELOCITY ( IN rad/s) OF THE
ROBOT AT TIME INSTANT
n. A S SHOWN IN FIGURE 7, THE TRAJECTORY IS
DIVIDED INTO THREE SUB TRAJECTORIES IN ORDER TO SIMPLIFY THE PROCESS OF OBTAINING SENSOR FREE POLYNOMIALS .
run 1 2 3 4 5
performance 1 0.39 0.76 0.81 0.55
percentage used 100% 0% 76% 81% 55%
TABLE IV E XPERIMENT 3. F ORMATION OF THE TRAINING DATA SET TO OBTAIN THE FINAL , SENSOR - BASED MODELS . MEASURE ( EQUATION
T HE TABLE GIVES THE PERFORMANCE 2) OF THE ROBOT DRIVEN BY THE SENSOR - FREE
POLYNOMIALS STARTING FROM
5 DIFFERENT LOCATIONS . I T ALSO SHOWS
THE PERCENTAGE OF THE LOGGED DATA USED IN THE FORMATION OF GENERAL TRAINING DATA SET FROM EACH RUN .
Fig. 8. Experiment 3. Two trajectories of the robot under control of the sensor-free controllers. For trajectory 1 (shown in black) P is 1, because the robot didn’t use the collision avoidance mechanism at all. However, for trajectory 2 (red) P is 0.39. To form the training data set for the final, sensor based controller, we therefore used all logged data from trajectory 1 and none from trajectory 2, as P was below the threshold of 0.4 (see table IV).
changes visible in figure 8 indicate those locations where the collision avoidance mechanism took control of the robot. a) Formation of training data set: After logging perception action data, we computed the performance of each run based on the equation 2. We then combined the logged files as described in the previous section. Table IV shows the percentage of the logged data used in the formation of general training data set from each run. As before, we coarse coded the laser readings into 11 sectors by averaging 62 readings for each 22◦ interval to obtain the final, sensor-based Narmax models. In experiment 3 we used all coarse coded laser readings in Narmax models. Both the translational and the steering speed model are given in table V.
lv(n) =
av(n) = −0.112 −0.001 ∗ u(n, 5) +0.212 ∗ u(n, 6) +0.019 ∗ u(n, 2) −0.009 ∗ u(n, 9) −0.033 ∗ u(n, 5)2 −0.056 ∗ u(n, 6)2 −0.055 ∗ u(n, 2)2 +0.020 ∗ u(n, 5) ∗ u(n, 6) +0.076 ∗ u(n, 5) ∗ u(n, 2) +0.063 ∗ u(n, 5) ∗ u(n, 9) +0.013 ∗ u(n, 6) ∗ u(n, 9) −0.056 ∗ u(n, 2) ∗ u(n, 9)
+0.361 −0.239 ∗ u(n, 5) −0.065 ∗ u(n, 3) −0.037 ∗ u(n, 7) +0.035 ∗ u(n, 5)2 +0.005 ∗ u(n, 7)2 +0.014 ∗ u(n, 5) ∗ u(n, 7) +0.015 ∗ u(n, 3) ∗ u(n, 7)
TABLE V E XPERIMENT 3. T WO SENSOR - BASED POLYNOMIALS WHICH LINK THE PERCEPTION OF THE ROBOT TO THE DESIRED BEHAVIOUR SHOWN IN FIGURE
6. lv(n) AND av(n) ARE THE TRANSLATIONAL VELOCITY ( IN m/s)
AND ROTATIONAL VELOCITY ( IN
rad/s) OF THE ROBOT AT TIME INSTANT n
AND u1 TO u11 ARE THE COARSE CODED LASER READINGS STARTING FROM THE RIGHT EXTREME OF THE ROBOT
6
B. Future Work
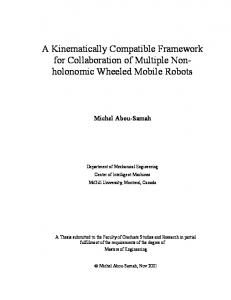
Fig. 9. Experiment 3. The trajectory of the robot under control of the sensorbased controllers given in table V. The robot moved for about 10 minutes without collision.
b) Model validation: Again, we used the final, sensorbased models drive the robot in the closed U corridor environment for 10 minutes. Figure 9 shows the trajectory; no collisions occurred. IV. C ONCLUSIONS AND F UTURE W ORK A. Conclusions We introduce a new mechanism for achieving programming by demonstration, based on algorithmically transferring observed human behaviours directly into robot control code, using transparent system identification techniques. To obtain such sensor-motor controllers, we first demonstrate the desired motion to the robot in the target environment. Using this demonstration, we obtain recurrent, sensor-free models that allow the robot to follow the same trajectory blindly. During this motion the robot logs its own perceptionaction pairs, which are subsequently used as training data for the Narmax modelling approach that determines the final, sensor-based models which identify the coupling between sensory perception and motor responses as non linear polynomials. These models are then used to control the robot. The sensor-free motion stage of this process is critical, because the robot is likely to deviate from the desired path and collide with obstacles. We therefore enhanced our method by incorporating a hard-wired collision avoidance mechanism that takes over control if necessary: The robot is normally driven under control of the sensor-free controllers, but collision avoidance takes over once a minimum distance to the nearest obstacle is reached. We used the collision avoidance mechanism not only to avoid obstacles, but also to evaluate the performance of the sensor-free controllers: the performance quality P drops every time the collision avoidance mechanism has to be invoked. We then used P to decide how much of the logged data from each episode would be used in the formation of the general training data set used in obtaining the final, sensor-based models. Finally, we tested the viability of our approach by teaching the robot to move continuously in a closed U corridor environment.
So far we used an external, camera-based motion tracking system to log the trajectory of the human demonstrator during his initial demonstration of the desired motion. Because such tracking systems are complicated to set up and expensive, we are currently developing alternative methods to obtain trajectory information, using the robot’s own sensor perception such as video camera and/or laser. Furthermore, we are investigating the scaling properties of the presented approach to more demanding tasks such as navigation or fine motion control, as well as methods of analysing the obtained models in order to be able to modify them off-line. The work already carried out and that proposed forms part of our ongoing research to develop a theory of robot-environment interaction. ACKNOWLEDGEMENTS We thank to Christopher Burbridge and Ali Kutchuk for helping some of the experiments. We also gratefully acknowledge that the RobotMODIC project is supported by the Engineering and Physical Sciences Research Council under grant GR/S30955/01. R EFERENCES [Akanyeti et al., 2007] Akanyeti, O., Kyriacou, T., Nehmzow, U., Iglesias, R., and Billings, S. (2007). Visual task identification and characterisation using polynomial models. Robotics and Autonomous Systems. [Billings and Chen, 1998] Billings, S. and Chen, S. (1998). The determination of multivariable nonlinear models for dynamical systems. In Leonides, C., (Ed.), Neural Network Systems, Techniques and Applications, pages 231–278. Academic press. [Billings and Voon, 1986] Billings, S. and Voon, W. S. F. (1986). Correlation based model validity tests for non-linear models. International Journal of Control, 44:235–244. [Demiris and Hayes, 1996] Demiris, J. and Hayes, G. (1996). Imitative learning mechanisms in robots and humans. In Proc. 5th European Workshop on Learning Robots, pages 9–16, Bari, Italy. [Demiris and Johnson, 2003] Demiris, Y. and Johnson, M. (2003). Distributed, predictive perception of actions: biologically inspired robotics architecture for imitation. CONNECTION SCIENCE, 15(4):231–243. [Eykhoff, 1974] Eykhoff, P. (1974). System Identification: parameter and state estimation. Wiley-Interscience, London. [Hayes and Demiris, 1994] Hayes, G. and Demiris, J. (1994). A robot controller using learning by imitation. In Proc. 2nd Int. Symposium on Intelligent Robotics Systems, pages 198–204, Grenoble, France. [Iglesias et al., 2005] Iglesias, R., Kyriacou, T., Nehmzow, U., and Billings, S. (2005). Robot programming through a combination of manual training and system identification. In Proc. of ECMR 05 - European Conference on Mobile Robots 2005. Springer Verlag. [Korenberg et al., 1988] Korenberg, M., Billings, S., Liu, Y. P., and McIlroy, P. J. (1988). Orthogonal parameter estimation algorithm for non-linear stochastic systems. International Journal of Control, 48:193–210. [Nehmzow et al., 2007] Nehmzow, U., Akanyeti, O., Kyriacou, T., Iglesias, R., and Billings, S. (2007). Robot programming by demonstration through system identification. In IROS (accepted), San Diego, USA. [Pardowitz et al., 2007] Pardowitz, M., Knoop, S., Dillmann, R., and Zoellner, R. (2007). Incremental learning of tasks from user demonstrations, past experiences and vocal comments. IEEE TRANSACTIONS ON SYSTEMS MAN AND CYBERNETICS PART B, 2:322–332. [Roberto Iglesias and Billings, 2005] Roberto Iglesias, Ulrich Nehmzow, T. K. and Billings, S. (2005). Modelling and characterisation of a mobile robot’s operation. In CAEPIA 2005, 11th conference of the Spanish association for Artififcial Intelligence, Santiago de Compostela, Spain. [Schaal, 1997] Schaal, S. (1997). Learning from demonstration. In Advances in Neural Information Processing Systems, volume 9, pages 1040–1046.