(This is a sample cover image for this issue. The actual cover is not yet available at this time.)
This article appeared in a journal published by Elsevier. The attached copy is furnished to the author for internal non-commercial research and education use, including for instruction at the authors institution and sharing with colleagues. Other uses, including reproduction and distribution, or selling or licensing copies, or posting to personal, institutional or third party websites are prohibited. In most cases authors are permitted to post their version of the article (e.g. in Word or Tex form) to their personal website or institutional repository. Authors requiring further information regarding Elsevier’s archiving and manuscript policies are encouraged to visit: http://www.elsevier.com/copyright
Author's personal copy Review of Palaeobotany and Palynology 167 (2011) 175–183
Contents lists available at SciVerse ScienceDirect
Review of Palaeobotany and Palynology journal homepage: www.elsevier.com/locate/revpalbo
Research paper
Progress towards an automated trainable pollen location and classifier system for use in the palynology laboratory K. Holt a,⁎, G. Allen b, R. Hodgson b, S. Marsland b, J. Flenley a a b
Institute of Natural Resources, Massey University, PB 11222, Palmerston North 4442, New Zealand School of Engineering and Advanced Technology, Massey University, PB 11222, Palmerston North 4442, New Zealand
a r t i c l e
i n f o
Article history: Received 28 May 2011 Received in revised form 10 August 2011 Accepted 12 August 2011 Available online xxxx Keywords: pollen analysis automated palynology neural networks pollen classification
a b s t r a c t Palynological analysis, as applied in vegetation reconstruction, climate change studies, allergy research, melissopalynology and forensic science, is a slow, laborious process. Here, we present an ongoing project aimed at the realisation of a low-cost, automatic, trainable system for the location, recognition and counting of pollen on standard glass microscope slides. This system is designed to dramatically reduce the time that the palynologist must spend at the microscope, thus considerably increasing productivity in the pollen lab. The system employs robotics, image processing and neural network technology to locate, photograph and classify pollen on a conventionally prepared pollen slide. After locating pollen grains on a microscope slide, it captures images of them. The individual images of the pollen are then analysed using a set of mathematically defined features. These feature sets are then classified by the system by comparison with feature sets previously obtained from the analysis of images of known pollen types. The classified images are then presented to the palynologist for checking. This ability for post-classification checking is a key part of the automated palynology process, as it is likely that under the current technology, it will be very difficult to produce an automated pollen counting and classifier system that is 100% correct 100% of the time. However, it is important to remember that pollen counts performed by human palynologists are seldom 100% correct 100% of the time as well. The system has been tested on slides containing fresh pollen of six different species. The slides were counted repeatedly by both the system and by human palynologists. The results of these tests show that the machine can produce counts with very similar proportions to human palynologists (typically within 1–4%). Although the means of the machine counts were usually slightly lower than those of the human counts, the variance was also lower, demonstrating that the machine counts pollen more consistently than human palynologists. The system described herein should be viewed as a potentially very valuable tool in the palynological laboratory. Its ability to discriminate between the bulk of pollen and debris on a slide and capture and store images of each pollen grain is in itself a very useful feature. This capability combined with the relatively positive results from this first all-of-system capture-and-classify test clearly demonstrate the potential of the system to considerably improve the efficiency of palynological analysis. However, more tests are required before the extent of the system's potential can be fully realised. The next step, testing the system on fossil pollen samples, is now underway. © 2011 Elsevier B.V. All rights reserved.
1. Introduction and review Out of all the techniques employing biological particles, palynology is perhaps the one with the most varied range of applications. It is now widely used in vegetation reconstruction, climate change studies, oil exploration, allergy research, melissopalynology, and forensic science, to name a few (Stillman and Flenley, 1996). However, those who perform palynological research know that it is a slow laborious process, involving
⁎ Corresponding author. Tel.: + 64 6 3569099; fax: + 64 6 3505689. E-mail address:
[email protected] (K. Holt). 0034-6667/$ – see front matter © 2011 Elsevier B.V. All rights reserved. doi:10.1016/j.revpalbo.2011.08.006
a series of laboratory treatments to concentrate the pollen, followed by locating, identification and counting of pollen grains on microscope slides: in short (as put by Walker, 1990, p 16), ‘an enormous amount of ....work’. Many other related procedures involving microfossils (such as diatoms and testate amoebae) or other small particles (e.g., mineralogy, sand grain morphology) are similarly time-intensive. Flenley (1968) discussed the potential for automated palynology, i.e. the need to develop a system that significantly reduces the hours of labour needed in the palynology process. Since then others have also highlighted the need to harness modern technology to assist the palynologist and advance palynological research (e.g., Witte, 1988; Walker, 1990; Stillman and Flenley, 1996; Green, 1997; Flenley, 2003). Over time, the need for automated palynology has increased
Author's personal copy 176
K. Holt et al. / Review of Palaeobotany and Palynology 167 (2011) 175–183
considerably, particularly in the field of vegetation and climate reconstruction, where high-resolution pollen records composed from sometimes hundreds of samples are required to better understand the nature and timing of climate change, and ecological responses to climate change (Woodward and Shulmeister, 2006; Alloway et al., 2007). One could also argue that the growing demand for oil resources ‘fuels’ the need for enhanced and more efficient palynology in oil exploration. Allergy research, aeropalynology, and plant reproductive biology and pollinator relationships are examples of other areas that have been identified to benefit from the development of an automated counting and classification system (e.g., Carrion et al., 2003; De Sa-Otero et al., 2004; Miyamoto and Hoshimiya, 2006; Costa and Yang, 2009; Landsmeer et al., 2009). During past decades various groups have begun development of computer-based systems that could be applied in automated palynology (e.g., Langford et al., 1990; France et al., 2000; Boucher et al., 2002; Ronneberger et al., 2002), and have had mixed success. Anecdotal evidence suggests that the perceived difficulties inherent in automated pollen analysis have resulted in many palynologists relegating the concept of automated palynology into the ‘too-hard’ basket. However, more recently, efforts in pattern recognition and image processing techniques by Li and Flenley (1999), Treloar et al. (2004), Li et al. (2004) and Zhang et al. (2004) have demonstrated that the possibility exists for automated capture and classification of pollen images from a wide range of pollen types using image processing and neural network analysis. Since the publication of these papers several other groups have continued work towards the development of computer-based systems for automated pollen analysis. The intended applications of each of these individual systems have typically been aimed at one particular branch of pollen analysis, including allergy research and aeropalynology (e.g., De Sa-Otero et al., 2004; Chun et al., 2006; Miyamoto and Hoshimiya, 2006; Ranzato et al., 2007; Landsmeer et al., 2009), and plant reproductive biology (e.g., Costa and Yang, 2009). Most of all of the pre-existing studies focus on a particular aspect of automated analysis, such as the detection of pollen objects on a slide (e.g., Miyamoto and Hoshimiya, 2006; Landsmeer et al., 2009), or identification/classification of images of objects pre-determined to be pollen already captured from slides using image processing techniques (e.g., Chun et al., 2006; Costa and Yang, 2009). De Sa-Otero et al. (2004) and Ranzato et al. (2007) both detected and classified pollen objects on a slide. Most studies used fresh pollen from a limited number of species, typically two to three. Most had reasonable success at either discriminating pollen from nonpollen objects, or classifying pollen. Yet, none present a complete integrated system (both hardware and software) that recognises pollen objects, automatically captures images of them and then subsequently classifies them, which is what is ideally desired in an automatic pollen recognition system designed for use in any lab dealing with pollen counting and/or classification. In addition, none of these systems could be immediately applicable to fossil pollen analysis, of which we are concerned about here. Fossil pollen analysis is perhaps one of the greatest challenges to automated pollen counting and classification systems due to the potentially large range of taxa present, the presence of broken and clumped grains, and also the issue of discriminating debris from pollen. Over the following seven years since publication of the three papers by Treloar et al. (2004) Li et al. (2004) and Zhang et al. (2004), ongoing research and development at Massey University has built on their work and we are now proud to announce the construction and testing of an automated trainable classifier system for use in the pollen laboratory. This system is a holistic system comprising both hardware and software, employing robotics, image processing and neural network technology to locate, image and classify pollen on a slide. We describe the system and also present the results of the first round of testing, which clearly demonstrates the capability of the machine to identify and classify pollen more consistently than human palynologists. This system is at present regarded as ‘an intelligent assistant to the palynologist’ as opposed to
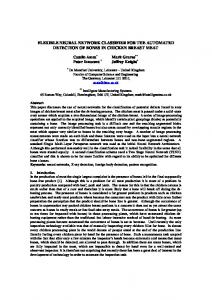
fully automated palynology. Yet we are convinced that the approach applied in this system has the potential to revolutionise the science of palynology. 2. Description of the system To date, at Massey University three generations of the system have been designed and constructed. Each generation has included significant enhancements in hardware to make the machine more robust and transportable. In addition upgrades to the software have also been made, with most improvements resulting in enhancement of the user interface. Fig. 1 shows two views of the series 3 version of the system, of which a number have now been constructed and supplied for testing in Europe, North America and Australia. The system is discussed in terms of its hardware and software components. The hardware components (Fig. 1.) consist of a microscope stage with computer controlled stepping motors that enable a pollenbearing microscope slide to be moved in a controlled way with X/Y steps as small as 0.625 μm (1600 steps per mm). The associated optical system has two features which may be unfamiliar to palynologists. The first is that monochromatic dark field illumination is used for the formation of the images. The lighting design in the latest version of the system is based on an array of high-intensity green light emitting diodes (LEDs). This design runs at much cooler temperatures than conventional approaches to lighting. The choice of dark field illumination is based on both theoretical and empirical investigations that show it is superior to ordinary bright field illumination in this application (Allen, 2006). The second potentially unfamiliar feature is the low magnification of the objective lenses used. Two objective lenses are used. One is a lowpower (×4) lens used for scanning the slide to locate all pollen-like objects. The other is a ×20 lens, which is used for capturing the images of pollen grains used for classification. A ×20 lens may seem rather a low power for viewing pollen grains. The explanation for this relates to the fact that the individual elements of the camera sensor (i.e. the pixels) are around 20 times larger than the microscopic pollen features (i.e. surface texture features, such as collumellae, spinules, striae etc.) that must be imaged to allow accurate pollen classification. When capturing digital images, ideally the features to be imaged must be the same size or larger than an individual pixel (light sensor) in the camera sensor. As the pixels in the sensor are much larger than many pollen surface features, the surface features must be magnified for useful images to be obtained. The ×20 lens used results in sufficient magnification of
Fig. 1. The thirds series AutoStage hardware system: a) Two digital cameras (high and low resolution), the twin slide holder, the LED lighting and the three digital drives (X, Y, and Z [focus]).The platform is milled from thick aluminium for stability. b) The internal view showing the three stepper motor control boards and the partly obscured lighting board.
Author's personal copy K. Holt et al. / Review of Palaeobotany and Palynology 167 (2011) 175–183
the diagnostic features to a size equal to or larger than the pixels in the sensor. These and other theoretical considerations are fully explained by Hodgson et al. (2005) and Allen et al. (2008). Hodgson et al. (2005) also explains the digital imaging device that records the image of each grain, with a resolution exceeding that of the human eye. As in the case of all digital microscopes, additional magnification is produced through the increase in size of the pixels between the camera sensor and the medium used for viewing (i.e., a computer monitor). For example, the camera sensor comprises 1280 × 1024 pixels and measures 8.52 mm in the diagonal. This translates to 1280 × 1024 pixels on a 432 mm (17-inch) computer monitor. This results in magnification of approximately 51 times, between the sensor and the monitor, and magnification of approximately 1000 times when the magnification of the lens is taken into account. The software which processes each image is developed from that described by Zhang et al. (2004). From each pollen image, 43 parameters are calculated. Most of the features are texture related and measure localised optical spatial frequency content. Shape, histogram and second-moments features are also utilised. These include the texture measures of Haralick (1979). The images of all the pollen grains are then classified using neural network analysis as outlined by Li et al. (2004) and Hodgson et al. (2005). The choice to use a neural network approach for classification was based on earlier successes with using neural networks in combination with image processing (e.g. Chaplin et al., 1998; 2000; Gunetileke et al., 2000) and in pollen classification (Li and Flenley, 1999; Li et al., 2004). The current version of the system employs two software platforms: LabVIEW and MatLab. LabVIEW is used in pollen identification and image capture, while MatLab is employed during feature extraction and classification. The wavelet transform toolbox of MatLab is used in feature extraction. We aim to migrate all the system software from MatLab to LabVIEW in the future. MatLab has been an excellent development platform, however LabVIEW is faster in operation. A range of tests of the accuracy of the classifier used in the system are described by Allen (2006). These tests were performed on three different types of images: dark field images captured by our system, conventional light microscope images, and ‘Bangor’ images from the database used by France et al. (2000). These tests used various sets of pollen types, ranging from between 3 and 40 types. The accuracy in classification as revealed by these tests ranged from 88% to 100% where dark field images captured by our system were used, and ranged from 77 to in excess of 94% when conventional microscope images were used. The classification test using the Bangor images of France et al. (2000) resulted in a 93% accuracy of our classifier, compared with the 82% accuracy achieved by France et al. (2000). Thus the accuracy of our classifier can be regarded as equal to or better than that of other existing classifier systems that have been developed since that of France et al. (2000), the majority of which have only used a very small number of pollen types. Out of all of the ideal characteristics of any automated pollen counting and classification system discussed previously, one of the most desirable seems to be that any such system be relatively low-cost (Costa and Yang, 2009; Landsmeer et al., 2009). The system described here is essentially a dedicated, automated, three axis digital microscope that uses a range of what are for the most part, conventional components. We anticipate that it will be less costly than a conventional optical microscope, camera and image analysis software and will also offer significant overall time savings.
177
that the slide is suitable for analysis, image capture and classification can begin. The whole slide can be captured, or the analyst may choose a set region of interest for capture. The steps in the automated capture process are summarised below. 1. The low magnification camera captures images of the region of interest (e.g. Fig. 2a). 2. The low magnification images are segmented into single objects and image processing techniques are used to eliminate nonpollen objects (Fig. 2b). The coordinate locations of possible pollen are recorded (segmentation and image processing techniques are described in Allen (2006) and Allen et al. (2008). 3. The high magnification camera is then sent by the system to the coordinates of objects of interest identified in step 2. 4. The high magnification camera then captures an image at the site of interest (Fig. 3a) and again uses image processing techniques to determine if there is a pollen grain at that location. Image capture occurs at a rate of approximately 10 objects/grains per minute. 5. The cropped high magnification images of pollen grains are captured and stored (Fig. 3b). The location of the captured pollen grain/object in 3 dimensional space is tagged onto the file information (i.e. X, Y and Z coordinates). Also, as capture continues, the software takes this information to build a three-dimensional map of the distribution of the objects within the slide (Fig. 4a–c). 6. This process is repeated until the entire defined area of interest has been covered. 7. Then, the high magnification cropped images are classified into pollen types. To do this, the software extracts 43 features as numerical
3. Operation of the system The flow of the system is relatively straightforward. A slide is placed on the stage, the analyst adjusts the initial focus, and the slide is then scanned at a low resolution. This takes approximately 25 s. These low resolution images can then be ‘browsed’ manually, allowing the palynologist to check the abundance and distribution of objects across the slide. The slide can also be browsed at high resolution. Once the analyst is satisfied
Fig. 2. a) Low-resolution image of a portion of the area of interest. Image size is 2.43× 1.82 mm. 1 and 3 = examples of potential pollen grains; 2 = coarse detritus; 4 = fine detritus. b) Segmented low-magnification image identifying all potential pollen grains and discarding detritus.
Author's personal copy 178
K. Holt et al. / Review of Palaeobotany and Palynology 167 (2011) 175–183
Fig. 3. a) High-magnification image of pollen grain (Pinus). b) cropped high-resolution image stored for classification.
parameters from each image (see Zhang et al., 2004). These are then used as the input to a neural network, which compares them with ‘library files’ of features extracted from images of pollen from reference collections or from classified examples identified by the palynologist on a slide or slides from the material under study. 8. The neural network then sorts the images collected in step 5 into groups. This classification takes place at a rate of several thousand grains per minute. These groupings are then presented to the palynologist for final verification and approval (Fig. 5a–c). Because all pollen images will be put into the group they best fit with and there is currently no group for ‘unknown’ pollen types, there is the potential for unknown pollen types (i.e. pollen types that are not included in the ‘library’) to be mis-classified. Therefore, postclassification checking by the palynologist is an important step in the process as it provides the opportunity for any mis-classified images to be recognised and manually moved into the appropriate group. 4. Theory and methods of testing the system To date, the most robust assessment of the performance of the system as a whole has been made by comparing counts of classified pollen grains on microscope slides obtained automatically by the system with counts obtained manually by experienced palynologists. It is the results of this assessment we describe herein. One of the biggest limitations to determining how accurately the system operates is that it is very difficult to determine in absolute terms what is on a slide in the first place. If a slide containing various pollen types (fossil or modern) is presented to a range of experienced palynologists for counting, it is a statistical certainty that the results they produce will differ, albeit if only slightly. This is usually due to differences in counting strategy, whereabouts on the slide the counting begins, and also vagaries in processes of identification. For instance, in taxa with very similar morphologies or where morphological characteristics can be ambiguous, one palynologist might choose to classify a grain based on spinule length or number, where another might classify based on aperture width, hypothetically speaking. Therefore, it becomes very difficult if not impossible to determine the absolute accuracy of an automated system if we cannot first determine the exact composition of the slides that we are going to use to test it. However in saying this, another important question to ask is, ‘How accurate do we really need to be?’ For example, when counting fossil pollen slides where pollen concentration on the slide is reasonably high, the analyst may not need to count the whole slide. Instead counting will the done until some minimum number of pollen grains (e.g., 300 grains of ‘dry land’
Fig. 4. Mapping of locations of individual pollen grains suspended in silicone oil on a conventional microscope slide. Axis units are given in steps, with one step equal to 0.625 μm. Colour represents depth in the z-axis direction. a) x–y axis plot, b) y–z plot, c) oblique/3-dimensional map of distribution of individual pollen grains.
taxa) has been reached, which is considered to be statistically representative of the entire sample and exceeding that number won't significantly improve the confidence limit to a degree that would justify the extra time spent counting (e.g., Maher, 1980). If a second count was then
Author's personal copy K. Holt et al. / Review of Palaeobotany and Palynology 167 (2011) 175–183
179
Fig. 5. Classified images of pollen presented to the palynologist for scrutiny. 3 examples presented here are: a) Betula pendula, b) Cupressus macrocarpa c) Pinus radiata.
performed on another slide of the same sample, there is little doubt that the results would differ somewhat, but as long as the proportions of each taxa between counts are comparable, then minor discrepancies are considered acceptable, i.e. as long as the vegetation ‘signal’ indicated by the pollen remains essentially the same from different counts of the same sample, then there is (arguably) no major issue caused by minor differences between counts from the same sample. To date, the only published comparison of human and automated pollen counts is that of Costa and Yang (2009), however their human counts were performed on images of pollen displayed on a computer screen, rather than on actual microscope slides. In acknowledging these considerations, it was decided that the most appropriate way to test our automated pollen counting and classification system was to compare it with the performance of human palynologists. To do this, a glycerine suspension containing 6 types of fresh, unstained pollen was prepared and mounted on conventional glass microscope slides and sealed with paraffin wax. The six types of pollen used were Betula pendula, Dactylis glomerata, Cupressus macrocarpa, Ligustrum lucidum, Acacia dealbata and Pinus radiata. The suspension also contained a minor amount of detritus and dust particles. At the time of the testing, five suitably experienced palynologists were available to perform the human counts. Four slides were prepared using the six-pollen suspension. Each of the four slides was counted once by each of the five palynologists. The palynologists attempted to count all pollen grains on each slide. For the machine counts, each of the four slides was counted four times. The region of interest was set to include the entire sample, and also included a small portion of the wax sealant. Once the pollen had been imaged and classified, the raw results of the classification were viewed and checked for accuracy. This accuracy-checking involved looking at the results windows (as per Fig. 5 a–c) and then manually relocating images that had been misclassified into their correct groups. This step took a matter of minutes to complete. A comparison of the ranges and means of the raw results and the user-adjusted results are presented in Fig. 6 to show the degree to which the raw results had to be adjusted. The majority of the discrepancies between the raw and user-adjusted results are the product of detritus being incorrectly identified as pollen. A check of the accuracy of the initial pollen recognition step (step 2) was
not performed due to the afore-mentioned difficulty in knowing the absolute composition of the slides in the first place. However, examination of the difference between the raw and user-adjusted results (Fig. 6) and the user-adjusted and human count results (Fig. 7) can give some indication of the performance of the initial pollen recognition step. These tests were performed using the first version of our automated pollen counting and classification system, as described in Allen (2006). However, the software used in discriminating pollen objects and classifying them has remained essentially the same across the three versions of the system. Thus the results presented here are also representative of the capability of the latest version of the system. 5. Results The means and ranges of the user-adjusted machine counts and human counts for each of the four slides (A–D) are shown in Fig. 7. The means and ranges of the counts for each of the four slides as percentages are presented in Fig. 8, as this is how many palynologists typically present counts from slides containing a range of taxa. A summary graph comparing the standard deviations of all the user-adjusted machine counts and human palynologist counts is presented in Fig. 9. This whole-of-system test resulted in broadly similar proportions between the system and the human palynologists (Figs. 7 and 8). Ideal results for this experiment would be the means of the human and machine counts being essentially the same and the variances between the counts the same or smaller, as this would make it safe to assume that the system performs equally well as humans, (with the advantage being in the time saved). Overall the user-adjusted machine counts were lower than the human counts. An analysis of variance (ANOVA) was carried out to determine the difference between the human count and machine count distributions. The data from the four slides was lumped and for each taxon, and a comparison was made between the distribution of the human counts and the distribution of the machine counts. The conclusion was reached that at a 95% confidence, the distributions are different. This is explained by instances where pollen grains had clumped together on the slides. Human palynologists are able to identify clumped grains, while the image processing used by the
Author's personal copy 180
K. Holt et al. / Review of Palaeobotany and Palynology 167 (2011) 175–183
Fig. 6. Comparison of ranges and means of raw machine counts versus user-adjusted machine counts for each of the four slides (a–d). Pollen types: 1 = Betula pendula, 2 = Dactylis glomerata, 3 = Cupressus macrocarpa, 4 = Ligustrum lucidum, 5 = Acacia dealbata, 6 = Pinus radiata.
Fig. 7. Comparison of means and ranges of user-adjusted machine counts versus human palynologist counts for each of the four slides (a–d). Pollen types as in Fig. 6.
Author's personal copy K. Holt et al. / Review of Palaeobotany and Palynology 167 (2011) 175–183
181
Fig. 8. Comparison of the means and ranges of the user-adjusted machine counts versus human palynologist counts for each of the four slides (a–d) expressed as percentages. Pollen types as in Fig. 7.
system would exclude clumps as they would likely be excluded from imaging during the segmentation process for exceeding the size and shape/roundness thresholds for pollen objects. However, the relatively small variance in counts of the same slides by the system puts the counts within the range of counts by the palynologist. A comparison of the means and ranges of the user-adjusted machine counts versus human palynologist counts as percentages shows a general similarity in the proportions of each taxon between the human and machine counts, with the means of most counts differing by only ~1–4%. 6. Discussion Perhaps the most significant outcome of this testing is shown in the difference in range and variance between the human counts and the user-adjusted machine counts. Ranges and variation between counts of the same slides and across all four slides were less for the useradjusted machine counts than the range and variation between the human counts (Figs. 7 and 9), while proportions of each pollen type were still very similar (Fig. 8). This demonstrates the machine's ability to count and classify pollen on a slide with a higher degree of consistency than a group of human palynologists, while still producing similar results. The machine does take a little longer to count slides, but this is a minor issue when viewed in terms of how much of the palynologist's time is freed up to do other more important tasks. Also, the machine does not suffer the same fatigue and potential reduction of observation power that human palynologists can suffer after extended periods of microscope work (Faegri and Iversen, 1989). So this combination of lower variation in counts of the same slides and the machine's ability to continue to function at the same level of accuracy for a potentially infinite length of time (within reason) confirms the system's potential as a valuable tool within the pollen lab. One might argue that we are overstating the accuracy of the system as presented in Figs. 7–9, since these results have undergone screening by a
human analyst (refer Fig. 6). However, we argue that the time spent quickly reviewing classification results on screen (i.e. in windows such as those in Fig. 5) is still minimal when compared with the overall time savings resulting from the fact that the system can independently and automatically find and image all pollen objects on a slide. It is likely that under the current technology available, it will be very difficult to produce a low-cost classifier system that identifies and classifies all pollen images correctly 100% of the time. In addition, when applying the system to slides containing fossil pollen or pollen spectra of unknown composition, the samples may likely contain pollen of taxa that are not included in the library and training sets, which in the system described here will result in these unknown grains being classified into the group with which they are deemed to be most alike. External checking, quality control and adjustments by the palynologist will always be a necessary requirement in the use of any automated pollen counting and classification system, especially in the earliest stages of adoption.
Fig. 9. Summary comparison standard deviations of user-adjusted machine counts against human palynologist counts of all four slides. Pollen types as in Fig. 7.
Author's personal copy 182
K. Holt et al. / Review of Palaeobotany and Palynology 167 (2011) 175–183
To date, the system has been thoroughly tested on modern pollen samples, as described above. The consistently lower standard deviation values from these tests (Fig. 9) demonstrate that the machine is less variable than humans at the classifying and counting of pollen grains. However, as these tests involved modern pollen from a small number of taxa, tests on fossil pollen from a larger range of taxa are required to evaluate further the performance of the system. These tests are currently under way at Massey University. Current limitations of the system include dealing with clumped pollen on slides (both clumping of pollen only, and pollen–debris clumping), recognising broken pollen grains that have lost their original shape, and avoiding capturing and classifying images of debris which often can adopt pollen-like shapes. It is envisaged that further development of the image-processing functions within the software will overcome these limitations. Further to the straightforward counting and classification of pollen on slides, the system could potentially be applied to a variety of more specific palynological tasks. A prime example would be to train the system to find only pollen of certain taxa of specific interest to the palynologist — (e.g., Ascarina lucida in New Zealand), or taxa which may be sparse within a sample but hold considerable palaeoenvironmental significance (e.g., Ilex, Hedera and Viscum). We also envisage developing new feature sets directed at discriminating pollen of a particular family for which identification to the generic or specific level has traditionally been problematic and time-consuming for palynologists, e.g. Poaceae and Moraceae, etc. De Sa-Otero et al. (2004) have already had some success in this field in their experiments distinguishing morphologically similar species of Urticaceae pollen. The system we have described is also particularly useful when employed to scan slides and to identify pollen on slides from samples with low pollen concentration. As well as overcoming the issue of time consumption, the system could also be applied to a range of more technical palynological problems, some of which have vexed palynologists for decades. For example, when performing counts on a slide or counting a whole slide, the palynologist is typically required to traverse back and forth across the width of the slide until the whole slide is counted. The problem arises when a pollen grain is only partially in view in the upper or lower regions of the view, i.e. the grain will potentially be seen during two traverses of the slide, thus there is a risk that the pollen grain may be counted twice. Some palynologists try to avoid this problem by only counting grains that are in full view: however, this can result in some pollen grains being excluded from the count. Alternatively, palynologists may choose to shift by at least one and a half fields of view in between slide traverses (Faegri and Iversen, 1989) to avoid counting grains twice. However, this too will obviously result in grains being omitted from the count. This may not be significant in pollen-rich slides, but for those slides where pollen is very sparse omitting grains from counts is not ideal. The system described herein renders this issue insignificant, as it records the coordinates of each grain it captures and will not capture a grain with the same coordinates as one already captured. Another issue that can be overcome with the aid of the system is differential distribution of pollen grains on a slide (e.g., Brookes and Thomas, 1967) as the system can easily count a whole slide, removing the influence of non-randomness of distribution. To take this one step further, the three dimensional mapping function (Fig. 4) could also be used as a tool to further investigate the randomness or nonrandomness of distribution of pollen across a microscope slide. These are but a small sample of the range of palynological problems this system could be applied to solving. This system is an early example of how the application of learning systems and artificial intelligence techniques will revolutionise laboratory instrumentation. This third series of our automated pollen counting system represents the “Model T Ford” level of development: it is useful but can certainly be improved. We now ask palynologists to help us to bring palynology practice into the 21st Century by becoming involved with the ongoing testing and development of the project. Those keen to do so should contact the
corresponding author as soon as possible, as well as visit our website: www.classifynder.com. 7. Summary The automated pollen counting and classification system we have described offers enormous possibilities in the pollen lab. It performs the laborious, time consuming location and counting of pollen. All images and analyses are stored, allowing for repeat analysis and reclassification at a later date. All stages of the process can be scrutinised by the palynologist to ensure accuracy. While other semi-automated pollen analysis tools have been developed over the past 15 years, this is the first holistic system that automatically identifies, captures and classifies pollen on a conventional glass microscope slide. Results from the first round of testing described herein show that counts of microscope slides containing a variety of pollen types can be achieved that are comparable with those performed by human analysts, with reduced variability between counts of the same slide. The system is continually being refined to improve performance, with the ultimate aim of commercial production of the system. This would then allow wider use of the technology and support to be provided to its users. We also anticipate that the system will be valuable in applications to diatoms, testate amoebae, dinoflagellates and numerous other types of microfossil. With modifications to the optical system it could also be used in the study of macrofossils and seeds. Medical applications, perhaps in cancer screening, seem highly plausible. Geological and soil science applications are also under consideration. Acknowledgements The authors are grateful to Ken Mercer, Colin Plaw and Greg McLeay for their outstanding contributions to the engineering design and construction of the third series of machines. We also wish to acknowledge the contribution made by the late Greg Arnold to the development of the Mark 1 version of the system. Thanks also go to the people who in addition to John Flenley, manually counted the pollen during these tests: Xun Li, Kevin Butler, Alastair Clement and David Fountain. We also thank Keith Bennett and another anonymous reviewer for their helpful comments and suggestions which have improved the manuscript. References Allen, G.P. 2006. An automated pollen recognition system. Master's thesis. New Zealand: Massey University. Available online at http://mro.massey.ac.nz/. Allen, G.P., Hodgson, R.M., Marsland, S.R., Flenley, J.R., 2008. Machine vision for automated optical recognition and classification of pollen grains or other singulated microscopic images. 15th International Conference on Mechanotronics and Machine Vision in Practice, 2–4 Dec 2008, Auckland, New Zealand, pp. 221–226. Alloway, B.V., Lowe, D.J., Barrell, D.J.A., Newnham, R.M., Almond, P.C., Augustinus, P.C., Bertler, N.A., Carter, L., Litchfield, N.J., McGlone, M.S., Shulmeister, J., Vandergoes, M.J., Williams, P.W., NZ-INTIMATE members, 2007. Towards a climate event stratigraphy for New Zealand over the past 30,000 years (NZ-INTIMATE project). Journal of Quaternary Science 22, 9–35. Boucher, A., Hidalgo, P.J., Thonnat, M., Belmonte, J., Galan, C., Bonton, P., Tomczak, R., 2002. Development of a semi-automatic system for pollen recongnition. Aerobiologia 18, 195–201. Brookes, D., Thomas, K.W., 1967. The distribution of pollen grains on microscope slides. Part 1. The non-randomness of the distribution. Pollen et Spores 9, 621–629. Carrion, P., Cernadas, E., Galvez, J.F., Diaz-Losada, E., 2003. Determine the composition of honeybee pollen by texture classification. Pattern Recognition and Image Analysis, Proceedings, 2652, pp. 158–167. Chaplin, R.I., Siroki, M., Hodgson, R.M., Gunetileke, S., 1998. The development of mapping techniques to incorporate image processing problem specific rules into neural networks. Proceedings of the Image and Vision Computing New Zealand Conference (IVCNZ), Auckland, November 16–18 1998, pp. 357–362. Chaplin, R.I., Gunetileke, S., Hodgson, R.M., 2000. Initialising neural networks with apriori problem knowledge. Proceedings of the IEEE Workshop on Neural Networks for Signal Processing, Sydney, Australia, December 11–13 2000, pp. 10 165–10 174. Chun, C., Hendriks, E.A., Duin, R.P.W., Reiber, J.H.C., Hiemstra, P.S., de Weger, L.A., Stoel, B., 2006. Feasibility study on automated recognition of allergenic pollen: grass, birch and mugwort. Aerobiologia 22, 275–284.
Author's personal copy K. Holt et al. / Review of Palaeobotany and Palynology 167 (2011) 175–183 Costa, C.M., Yang, S., 2009. Counting pollen grains using readily available, free image processing and analysis software. Annals of Botany 104, 1005–1010. De Sa-Otero, M.P., Gonzalez, A.P., Rodriguez-Damian, M., Cernadas, E., 2004. Computeraided identification of allergenic species of Urticaceae pollen. Grana 43, 224–230. Faegri, K., Iversen, J., 1989. Textbook of Pollen Analysis (4e). Blackwell, New Jersey. 328p. Flenley, J.R., 1968. The problem of pollen recognition. In: Clowes, M.B., Penny, J.P. (Eds.), Problems of Picture Interpretation. C.S.I.R.O, Canberra, pp. 141–145. Flenley, J.R., 2003. Some prospects for lake sediment analysis in the 21st century. Quaternary International 105, 77–80. France, I., Duller, A.W.G., Duller, G.A.T., Lamb, H.F., 2000. A new approach to automated pollen analysis. Quaternary Science Reviews 19, 537–546. Green, D.G., 1997. The environmental challenge for numerical palynology. INQUA subcommission on data-handling methods. Newsletter 15, 3–6. Gunetileke, S., Chaplin, R.I.C., Hodgson, R.M., 2000. The use of problem knowledge to improve the robustness of a fuzzy neural network. Proceedings of the IEEE Workshop on Neural Networks for Signal Processing, Sydney, Australia, December 11– 13 2000, pp. 682–691. Haralick, R.M., 1979. Statistical and structural approaches to texture. Proceedings of the lnstitute of Electrical and Electronic Engineers 67, 786–804. Hodgson, R.M., Holdaway, C.A., Zhang, Y., Fountain, D.W., Flenley, J.R., 2005. Progress towards a system for the automatic recognition of pollen using light microscope images, ISPA2005. 4th International Symposium on Image and Signal Processing and Analysis, 15–17th September 2005. Zagreb, Croatia. Landsmeer, S.H., Hendriks, E.A., de Weger, L.A., Reiber, J.H.C., Stoel, B.C., 2009. Detection of pollen grains in multifocal optical microscopy images of air samples. Microscopy Research and Technique 72, 424–430. Langford, M., Taylor, G.E., Flenley, J.R., 1990. Computerized identification of pollen grains by texture analysis. Review of Palaeobotany and Palynology 64, 197–203. Li, P., Flenley, J.R., 1999. Pollen texture identification using neural networks. Grana 38, 59–64.
183
Li, P., Treloar, W.J., Flenley, J.R., Empson, L., 2004. Towards automation of palynology 2: the use of texture measures and neural network analysis for automated identification of optical images of pollen grains. Journal of Quaternary Science 19, 755–762. Maher, L.J., 1980. The confidence limit is a necessary statistic for relative and absolute pollen data. Proceedings of the Fourth International Palynological Conference, Lucknow, India, pp. 152–162. Miyamoto, K., Hoshimiya, T., 2006. Measurement of the amount and number of pollen particles of Cryptomeria japonica (Taxodiaceae) by imaging with a photacoustic microscope. IEEE Transactions on Ultrsonics, Ferroelectrics, and Frequency Control 53, 586–591. Ranzato, M., Taylor, P.E., House, J.M., Flagan, R.C., LeCun, Y., Perona, P., 2007. Automatic recongnition of biological particles in microscopic images. Pattern Recognition Letters 28, 31–39. Ronneberger, O., Schultz, E., Burkhardt, H., 2002. Automated pollen recognition using 3D volume images from fluourescence microscopy. Aerobiologia 18, 107–115. Stillman, E.C., Flenley, J.R., 1996. The needs and prospects for automation in palynology. Quaternary Science Reviews 15, 1–5. Treloar, W.J., Taylor, G.E., Flenley, J.R., 2004. Towards automation of palynology 1: analysis of pollen shape and ornamentation using simple geometric measures, derived from scanning electron microscope images. Journal of Quaternary Science 19, 745–754. Walker, D., 1990. Purpose and method in Quaternary palynology. Review of Palaeobotany and Palynology 64, 13–27. Witte, H.J.L., 1988. Preliminary research into possibilities of automated pollen counting. Pollen et Spores 30, 111–124. Woodward, C.A., Shulmeister, J., 2006. New Zealand chironomids as proxies for human-induced and natural environmental change: transfer functions for temperature and lake production (chlorophyll a). Journal of Paleolimnology 36, 407–429. Zhang, Y., Fountain, D.W., Hodgson, R.M., Flenley, J.R., Gunetileke, S., 2004. Towards automation of palynology 3: pollen pattern recognition using Gabor transforms and digital moments. Journal of Quaternary Science 19, 763–768.