systems. Organisation. Business Process Management. Source. Make ..... A Vessel Traffic Management Information System (VTMIS) in ports can help reduce ...
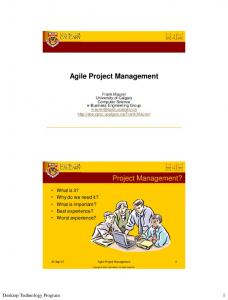
Optimising Shipping Company Operations Using Business Process Modeling D. V. Lyridis1, T. Fyrvik2, G. N. Kapetanis1, N. Ventikos1, P. Anaxagorou1, E. Uthaug2, & H. N. Psaraftis1 Abstract In order to identify the elements constituting quality in services, a Business Process Modelling methodology has been applied in the case of a Greek liner shipping company. The company operations have been identified and analysed in order to assess the complete performance of service elements and thereafter identify how to match the service performance against the user requirements. A liner container service within Europe has to compete with the road transport which in many cases is an alternative to the sea transportation and not complementary to it. Thus not only the ship has to be envisaged when aiming to improving quality in services but the whole chain, namely port authorities, land transportation enterprises, subcontractors, agents, charterers and others. A set of potential improvements within this framework are thus suggested and time and cost (examined in a specific voyage scenario) are measured before and after the implementation of these measures. Very large time and cost savings are observed after the application of the technology improvements allowing in fact the shipping company to even increase the number or round trips per year in the examined route. This indicates that very large benefits can be drawn by analysing and critically adjusting business processes in modern shipping companies. 1
Introduction
In order for European short sea shipping to play an increasingly important role, several aspects of the industrial philosophy of total quality must be implemented. Individual shipping companies starting preferably with those offering liner services should realize the importance of offering integrated quality services to their customers. The current paper aims at addressing total quality issues in a shipping company as a first step to better understanding how the modeling of business processes in the maritime sector may contribute to an improved quality in shipping operations. Business Process Modeling (BPM) permits strategies to be efficiently put into practice. BPM means focusing on, and understanding what gives results and value to one’s customers. An important part of BPM consists of developing and using process models of a company’s own fields of activity as a basis for re-engineering, training, communication, working routine descriptions, improvement initiatives, quality control, system development and more.
Strategic planning
Supporting ICT systems
Organisation
Business Process Management Plan
Source
Make
Deliver
Figure 1: Business Process Management balance strategic objectives, processes, ICT and organization [Fyrvik, Uthaug (2003)] 1 2
National Technical University of Athens, Greece MARINTEK Solutions, Norwegian Marine Technology Research Institute, Norway
In any business, the overarching goal must be to balance the organization, working processes, the supporting Information and Communication Technology (ICT) systems and resources. Business process management will monitor and adjust the processes, organization and ICT in order to meet the objectives outlined in the strategic planning (Figure 1). To identify and document process models is a prerequisite for successful implementation of BPM. To model the business processes helps identify all fundamental aspects of a company and it constitutes a powerful yet simple approach to understanding and communicating what really happens in existing processes. In this way, it represents the basis for a subsequent optimization of the company sectors or even re-engineering of the whole structure that result in cost and time savings. For the demonstration of these capabilities of the BMP Methodology as outlined above, a Greek shipping company with a regular liner service in the Mediterranean Sea is chosen and the transportation flow of a single container is tracked and analyzed in terms of cost and time. By describing in detail the processes of operation and identifying what may be considered as core business or as secondary processes (management and support) the potential for reengineering the business processes is shown. In Section 2 of this paper the framework under which a business process model is established is presented and the respective methodology is described. In Section 3 the BPM is used in order to model shipping operations of a specific Greek shipping company which is a container operator. It focuses on a specific scenario/voyage (Section 4) and “follows” a container from the point of origin to the final point of delivery taking down various parameters along the way. Derived from this analysis, a set of improvements are proposed that are implemented in the scenario in Section 5. In Section 6 both the scenario specific conclusions as well as the more general experience gained by using BPM are described [Hammer, Michael, Champy, James (1993), Smith, Howard, Fingar, Peter (2002), Andersen, Bjørn (1999), Ericsson (1993)]. 2
Establishing the Business Process Model
Process Modelling is an integral part of Business Process Re-engineering, which is defined as "the analysis and design of workflows and processes within and between organizations" or as "the critical analysis and radical redesign of existing business processes to achieve breakthrough improvements in performance measures." In order to be able to perform such business process re-engineering, the business processes must be made visible – through business process models. Business process models are normally documented as diagrams with supporting text. The development of the process models are implemented in a three step approach (Figure 2).
References & Experience •Functions •Processes/Activities •Roles •Terminology •Systems/Architecture
•Modelling tools •Pilot studies •Process models •Experienced people •.......
•Presentation techniques •HTML •Powerpoint •Lay-outs •........
Process mapping Project Preparation phase
Configuration / Mapping phase
•Define/describe scope •Plan (mapping) project •Appoint mapping team
•Develop model •Collect and structure information
Presentation phase •Communicate results •Prepare presentation material •Recommendations •Furhter work
Step 1:
Step 2:
Step 3:
•How to .......
•How to .......
•How to .......
Mapping guide
Figure 2: Three-step method for Process Modeling [Fyrvik & Uthaug (2003)]
2
The objective of Step 1 is to set the scope of the process mapping. The goal is to set boundaries and identify the main actors and stakeholders to the business or along the chain subject to modeling. It also describes how to select suitable references to be used in the project. Step 2 describes how to develop the process model. The goal is to build a model in several levels where each new level gives a higher degree of detailing. It is important to ensure the documentation of all relevant information and to structure it in an appropriate way so that it meets the scope of the project. When the main processes have been identified, it is necessary to detail each process with sub-processes and/or workflow diagrams. Step 3 describes how to present the process model. The goal is to ensure that people involved in the processes, understand the model, its presentation, and that they really think the model actually reflects the way they do their job. Important elements are roles, activities, information flow, and information systems. Process mapping will often form a basis for improvement work, especially when it comes to defining needs and requirements to reorganization and re-engineering of business processes. It will therefore be very important to communicate the knowledge established through the process mapping. Business process models are usually structured in a hierarchical way with increasing levels of detail, from the overall business model to detailed activity descriptions. The illustration in Figure 3 shows an example on how a process can be described using both processes and workflow descriptions. Chain Manager Installation
Physical logistics chain
Conceptual approach
Business process model
Terminal
Supplier
Require
Transporter purchase
Supplier
Process decsription (Topprocess level)
Inbound transport
Goods reception
Process model
Process decsription (Optional sub-process level)
Transporter Terminal operation
Warehouse Mgmt.
Sea transport
Return Logistics
Loading and unloading operation
Role 3
Role 2
Role 1
Installation
Workflow descriptions Activity 1 ?
Activity 2
Document
Activity 3
Document
Activity 4
Role- and activity descriptions
Details: Roles, activities, Activity path (sequense), Information flow, Information systems, Events
ICT system 1
ICT system 2 Document
Document
ICT system 3 Document
Figure 3: A hierarchal approach to process modeling [Fyrvik & Uthaug (2003)] A top-down approach is often used in process modeling. First data about the physical chain must be gathered. This data is used to create a conceptual model in order to understand the procedural chain and to identify scope of the process modeling. A business process model is established based on the scope of the project and includes the top-level processes. These top-level processes can be used to describe the different actors and/or main business units. Equal for all top-level processes is that they cover the different steps in the physical chain.
3
A top-level process can be further detailed by another sub-process level or by a workflow description according to the level of complexity desired for the model. A process model will preferably not have more than 4 levels in order to ease the understanding (better navigation and overview). Workflow description consists of roles, activities, information systems, and events in a sequence which illustrates how the process works. The level of detail is only limited by the scope of the project, but experience show that unnecessary details should not be included. A matrix containing additional information such as role details, work descriptions, information system descriptions, and message/document descriptions could also support a process model. 3
Application of the Process Modeling (PM) Methodology to a Shipping Company
The approach described in Section 2 above is applied on a shipping company in order to analytically present its core business processes. It’s about a major Greek shipping company with regular lines in the Mediterranean Sea served by a fleet of 11 container vessels. The name of the shipping company is withheld for reasons of confidentiality. In order to analytically present the company’s core business processes, it is first focused on the divisions and/or the departments of the company. In each department all products, services and operations are established. Then the links between operations and interested parties are highlighted. Finally, additional information for each operation (time, cost) is acquired so as to allow identification of the processes potential for improvement and subsequent evaluation of the result. It was decided in this case to use a typical “Porter value chain” approach with three different process categories which are grouped in the model in 3 “layers” representing in sufficient detail the existing company structure. The first entity is Company Management. The full length of the respective box denotes the continuous interaction of the management with all the operations in the company. Another characteristic of this entity is the shadow underneath. It indicates that there is a lower level with more detailed description of the business processes (Figure 4). The second entity represents the operations/value chain, which is responsible for the company income and satisfies the client. Additionally operations are included that support the product chain and is the main set on which this paper concentrates. In this entity Customer Need is the input and company Profit together with Customer Satisfaction is the output. Marketing and Sales, Resources, and Products are the main blocks. Marketing and Sales is the most important part in the product chain accordingly the company’s viewpoint. In the Resources block Ship Management, Services & Operations and Container Management are the building elements. Ship Management and Container Management are very important in order to assure a regular and precise service. In the third block, Products, Port To Port service and the Door-to-door service are the main elements. Those two entities are also described in detail. The last entity comprises all the support operations of the shipping company, namely: Quality Management, Information & Communication Management, Accounting & Finance, and Administrative Support. It is evident that all these operations are obligatory for a smooth operation of the company. The fact that their respective boxes extend from the left to the right end signalizes the continuous interaction with all other company operations. The shadow underneath Quality Management indicates that this entity has been analyzed in more detail at a lower level. The arrows outside the blocks show the input and the output of each entity.
4
Figure 4: The Business Process Modeling of the shipping company (Lever I) Going down to a lower level under the Company Management, all the possible operations that are linked with this important division of the company are met (Figure 5).
Figure 5: Company Management operations of the shipping company (Level II). Services & Operations is analyzed at a second level as shown in Figure 6 below. One of the core processes of the Products (Door-to-Door and Port-to-Port), namely Sea Voyage & Berthing, is even further analyzed (Figure 12).
5
Figure 6: The Services and Operations of the shipping company (Level II). Ship Management is also analyzed at a second level (Figure 7). This is a very important entity for the availability of the fleet vessels and hence for the schedule keeping of a line. In Figure 8 the possible operations of the Quality Management are put together. Most of the QM departments of shipping companies around the world are complying with the ISM and ISO 9002 Codes. The Port-to-Port Service is one out of the two products of the shipping company. A container is loaded at the Port Of Loading and after the Sea Voyage is completed, it is discharged at the Port Of Discharging. In this case the box transfer to the first port and from the second port lies within the responsibility of the customer. The second analysis level is described in Figure 9, and a more detailed analysis for each of the three entities, POL Handling, Sea Voyage & Berthing, POD Handling, is presented in Figure 11,Figure 12, and Figure 13. These three entities are the same in both products (Door-to-Door and Port-to-Port).
Figure 7: Ship Management operations (Level II)
Figure 8: The Quality Management (Level II)
6
Figure 9: The Port-to-Port Service (Level II) The model is directly linked to the Door-To-Door product of the company. Thus a detailed analysis has been done towards this direction. In this case, according to the scenario, the shipping company provides the whole service from the manufacturer’s warehouse to the customer’s warehouse – and not only POL-to-POD. Moving one level down at the Door-to-Door Transport entity, a more detailed description is providing five main steps in a serial model. The inputs are the Contract with the customer and the Box ready to be picked-up from the warehouse (Madrid, Spain). The outputs are Customer satisfaction after the Container has been delivered. The product chain consists of: Pick-up by track, Port handling POL, Sea voyage & Berthing, Port handling POD, and Delivery by truck (Figure 10). The road part is considered inelastic in terms of times and services, and out of the quality shipping scope of this report. (In a full scale logistics analysis it should be taken into consideration planning and preparation time including order handling etc). Thus the other three entities (those who have the shadow) are further analyzed in detail (Figure 11). The input in this case is Container Arrive POL and the output Container Loaded on Delivery Truck.
Figure 10: The Door-to-door Service (Level II). Similarly again, Figure 11 models at the third level the situation at the Port of Loading Additionally to the stakeholders/roles (vertical long boxes), and activities (smaller boxes inside the roles’ boxes), the flow information is provided. Main flow (e.g. cargo flow) and other flows (e.g. communication flows) can be presented.
7
Container arrive POL
Truck driver
Stevedores
Sarlis
Port Agents
Port Authorities
Customs
Vessel Vessel arrived
Deliver papers to agent
Documentation
Clearance request is sent by fax to Customs Arrange customs clearance & documentation & B/L
Unload container and move to storage
Arrange storage
Tax clearance
No Customs clearance when within EU Provide clearance
Instruct position for storage
Discharge vessel
Update loading plan Contract
Move from storage
Arrange loading
Load vessel
Lashing & Securing
Vessel ready to sail
Figure 11: The operations in the Port Of Loading (Level III). Analyzing at this third level the roles, the operations, the links and the flows are incorporated into the model. It is clear that the roles, the operations and the activities are the same with those in real life. At the port of loading the roles are: the truck driver, the port stevedores, the shipping company, the port agent, the port authorities, the customs office and the vessel. The activities taken are: delivery of the box and the documents, the documentation, the tax clearance, the box storage on port, the movement of the box near the crane, and the loading of the vessel. Additionally to the roles (vertical long boxes), and activities (smaller boxes inside the roles’ boxes), the information flow is also depicted. Main flow (e.g. cargo flow) as well as other flows (e.g. communication flows) could be presented. This allows a clear view on what is happening and how things work today and allows the weak points to be identified and thus improvements to be suggested. The second entity to be analyzed is Sea Voyage and Berthing (Figure 12). Using the same way of modeling (PM) following roles are considered: Vessel, port agent, port authorities and shipping company. The corresponding activities for each role are: Unberthing, sea voyage with communication procedures, queuing, berthing vessel and unlashing containers for the vessel and berthing prospect, berthing arrangements for the Port agent / Port Authorities respectively. Finally Voyage monitoring and Vessel technical support are the company activities. The flows are also shown in Figure 12. They continue from the same point they finish in Figure 11. At the end of the trip the final points are Container ready to unload at POD and Vessel arrived.
8
Figure 12: The Operations of Sea Voyage and Berthing (Level III). The last entity is the Port of Discharging POD (Figure 13). At the port of discharging the roles are: truck driver, port stevedores, shipping company, port agent, port authorities, and customs office (vertical long boxes). The activities (smaller boxes inside the roles’ boxes) are: arrange custom clearance (if necessary), arrange discharge and further box handling, confirm container arrival, instruct storage position, discharge vessel, move to storage, and load on truck (directly or from the storage position).
9
Figure 13: The Operations in the Port of Discharging (Level III). 4
Quantitative Assessment of the Operations – Suggestions for Improvements
In order to demonstrate the benefits resulting from the aforementioned analysis, a specific scenario is chosen, namely the Madrid-to-Athens liner service which follows the transfer of a container from the beginning of the transport chain to its end point of delivery. Time and cost parameters before and after the implementation of various applied improvements as derived from the model study are eventually compared. In Table 1and Table 2 all data concerning the above scenario are presented. This data has been exclusively provided by the shipping company, which is actually running this liner service. These two tables essentially provide the basis for improvements as they quantify the various steps of the door-to-door transport chain. Table 1: Time Schedule LINER SERVICE FROM MADRID TO ATHENS TERMS : EX FACTORY MADRID - FOT ATHENS CASE : OPTIMUM TIMING - TRANSPORTATION OF 1 X 20' DRY CONTAINER - WEIGHT : 22 TONS Phase Container Position Procedure Time [hr] Cost [€] 1 Empty in Depot 0 2 Empty on Truck Loading 0,5 3 Empty on Truck Transferring to Madrid 3,5 4 On Truck ( Warehouse ) Loading Unit 3 5 Full on Truck Transfer to Valencia 3,5 6 Full on Port Unloading Unit from Truck 0,5 520 7 Full on Port Documentation Editing B/L 37 T-3 Tare 3,07 T-3 Tax 54,5
10
8 9 10 11 12
Customs Cont. Waiting for Vessel Loading in Vessel Shipped to Piraeus Unloading unit from vessel Documentation Agency Fees Customs Loading Unit Transfer to Athens Unloading Unit Transfer to Depot
Full in Port ( Valencia ) Full in Vessel On Board Full in Port ( Piraeus ) Full in Port
13
Full on Truck
14 15
Full on truck (warehouse) Empty on Truck TOTAL
Days :
2 22 12 96 18 2
21,04 126,21 432,4 99 62 65
0,5 2 2 2 169,5 7,06
138 0 0 1.558,22
Table 2: Additional Information Moves per hour in Piraeus 7.6 – In Valencia 26,13 – (ref. Shipping Company) Moves per crane shift (7.5 hr): 120 – (ref. Piraeus Port Authority) Average of waiting time per vessel in Piraeus in order to berth was 7.1 h (299 Calls = 2139 lost working hours) Every delaying hour costs approximately US$ 590 (major expenses included: vessel charter fee, fuel, equipment) Considering that the times in the previous tables are of course mean values several assumptions were necessary in order to continue with the validation of the model, the most important of which are the following:
Road Transportation is inelastic in terms of time and service (from a shipping company point of view). Mean vessel time in port is 24 hrs. Approaching port, mooring, unmooring, and leaving port procedures take about 2hrs. Containers wait for the vessel for 22 hrs on port: loading 12hrs, unloading 10hrs. Before loading vessel the captain has the final loading plan. This means that even the last container is at the port a few moments earlier. All containers are clear (documents, taxes, customs) before loading begins. A container is ready on truck as soon as it is discharged from the vessel. Documentation, fees and customs in the POD are ready before vessel berthing. There is no need for custom clearance in the EU.
The next step obviously examines these operations quantitatively i.e. in terms of cost and time and suggests improvements. Both the current and the improved situation (after the improvements described below are applied) appear in the next section of this paper. From the model analysis, it was identified, that there is little potential for improvement in terms of time and cost during the sailing section of the entire container transport chain. Furthermore, money and time are interconnected, since a smaller voyage time means more round trips per year, which could be translated into more profit and better service. Let us adopt for our analysis the criterion of time and let us try to imagine what kind of methods, innovations, and technologies could allow us to reduce voyage time by a substantial amount, concentrating on specific legs of each ship voyage: idle time in port; documentation procedures/bureaucracy; loading and discharging operations; berthing/mooring. Requirements to be considered in connection to suggested improvements in these areas are:
Availability of the technology The cost of purchase The easiness of implementation
In this light a few technologies and methods have been chosen to demonstrate that when applied could significantly decrease voyage time and cost.
11
5
1.
Considering the fact that modern cranes can handle two containers per movement, the ability to handle cassettes with four (4), six (6) or eight (8) containers will drastically decrease the loading/discharging times. In the frame of this paper it is assumed that cassettes with four containers are used.
2.
Reduction of time spent for preparing and communicating documentation (including tax and customs clearance procedures) can be achieved through a web based system which links port agents with port authorities, customs offices and the road transportation company with the shipping company.
3.
A container tracking system could decrease the accumulation of containers in the line-up for handling by cranes, before the beginning of loading.
4.
New technologies improve the time requirements during the mooring/unmooring phases.
5.
A Vessel Traffic Management Information System (VTMIS) in ports can help reduce vessel approach/queuing and departure times by as much as 50% let alone the fact that it can increase security and safety (especially decreasing the risk of collision in congested port entrances).
Implementation of the Improvements
All proposed developments are reflected in the chain of operations of the selected liner service. Thus, the enhanced procedures and flows as well as the decreased time needed will alter the Business Process Model. It must be mentioned, that although the aforementioned improvements are applied to a certain scenario, they can also be utilized in a generic approach concerning the day-to-day operations of a shipping company. The Business Process Model In the context of the specific Door-to-Door scenario, the proposed changes mainly concern the entities of Port Handling POL, Sea Voyage & Berthing and Port Handling POD. The input and output events (Level II) of Figure 14 remain the same to the corresponding ones of Figure 9.
Contract
Port Handling (POD), TO-BE
Sea Voyage & Berthing, TO-BE
Port Handling (POL), TO-BE
Container ready to un-load at POD
Vessel ready to sail
Customer satisfaction
Figure 14: Improved Port-to-Port transportation service (Level II). Moving one level down, that is to the detailed analysis level (Level III), the implemented alterations can be pinpointed, in terms of operations and flows. Figure 15 depicts the potential structural differences arising from the implementation of a Web-based Communication System. In this manner, all interested parts are connected in real-time and all corresponding information (documents, permissions, instructions and clearances) can be easily and promptly transferred through the web. Port Agents could pay fees and taxes using e-Banking networks. Additionally, the shipping company can receive quickly and safely all pieces of information concerning the described processes. Hence, the necessary time to complete proper procedures is reduced from several hours to few minutes (about 20 minutes). The original documentation should always follow cargo (container) as hard copies are useful in case of inspections.
12
Container arrive POL
Truck driver
Sarlis
Stevedores
Port Agents
Port Authorities
Customs
Vessel
Vessel arrived
Web based Communication S ystem
Deliver papers to agent
Documentation
Unload container and move to storage
Discharge vessel with enhanced means
Arrange customs clearance documentation & Fees
Tax clearance
Arrange storage
Instruct position for storage
Customs clearance
Update loading plan Contract
Arrange loading
Move from storage
Load vessel with enhanced means
Lashing & Securing
Vessel ready to sail
Figure 15: Improved operations in the Port of Loading (Level III). The next phase of the scenario is Sea Voyage & Berthing (Figure 16). Information exchange, using the Web– based Communication System, can continue during the unberthing procedures and the sea voyage itself. Documentation, custom clearance and payments can be performed – easily and quickly – during the voyage phase. In this way, the only remaining time-consuming factor at the port of discharge can be potential cargo inspections. Moreover, the usage of a VTS/VTMIS system can diminish the queuing time by 50% [Glienke H., Meine J. (2001), Rytkonen J., Hanninen S., Sonninen S. (2002), Rytkonen J. (2002), Kountras A. (2002)]. The automatic mooring/unmooring systems will further reduce the necessary vessel berthing and securing time. Thus, the approaching and berthing times can become more predictable; this is very important, in order to request the port handling equipment to be ready and near to the vessel as soon as she gets secured. Vessel
Port Agents
Port Authorities
Sarlis
Web based Communication S ystem
Unberth
Automatic Mooring System
Vessel ready to sail
Sea voyage and regular ETA updates
Berthing prospects
Queing
VT S / VT MIS
Berthing
Automatic Mooring System
Berthing arrangements
Unlashing containers Container ready to un-load at POD
Figure 16: Improved operations in the Sea Voyage and Berthing (Level III).
13
In the last phase, Port Handling POD (Figure 17), the Web–based Communication System is still in use. All involved stakeholders can reach necessary information through Internet with minimum effort. Hence, lists of the discharged containers can be distributed instantly, and extra payments can be conducted directly. Moreover, the enhanced development of the scenario is based on a multiple container loading/unloading unit (cassette) capable to reduce the respective time by approximately 50% of the current practice, as we consider loading palettes that can carry twice as many containers as the conventional ones. Stevedores
Sarlis
Port Agents
Port Authorities
Customs
Truck driver
Web based Communication S ystem
Arrange customs clearance & documentation & B/L Container ready to un-load at POD
Confirm delivered containers
Provide clearance
Arrange discharge and further handling
Instruct position for storage
Discharge vessel with enhanced means No
Storage? Yes Move to storage
Pick at storage
Instruct pick-up
Collect container documents from agent
Container loaded on delivery truck
Load truck
Figure 17: Improved Operations at the Port of Discharging (Level III).
Port Time Analysis In this Section, the application of the above-described technologies is considered in terms of time reduction for certain procedures of the transportation chain. Table 3 includes the current time performances for numerous portwise operations and the corresponding values of the enhanced case. Table 3: Current and Improved Situation, for the Two Ports in Consideration. Operations Port of Valencia TOTAL Approaching Port-Mooring Unmooring-Leaving Port Loading Discharging Documentation Port of Piraeus TOTAL Queuing Approaching Port-Mooring Unmooring-Leaving Port Loading Discharging
Current situation (hrs)
Improved Situation (hrs)
Reduction in Time
24 0.5 0.5 12 11 2
11.6 0.3 0.3 6 5 0.3
52% 40% 40% 50% 50% 85%
32 7 0.5 0.5 18 6
16.1 3.5 0.3 0.3 9 3
50% 50% 40% 40% 50% 50%
14
Figure 18 and Figure 19 depict that the usage of the intended technologies in port operations cut back the respective time frame by a percentage of about 50%. Important tasks, like loading and discharging, which consume most of the time at the port, have been drastically reduced. Problems with queuing could also diminish. An improved mooring system contributes to the lowest possible time at the port. Finally, improved communication system reduces all the documentation, fee and customs procedures in a small fraction of the hour.
Port of Valencia
25
24
2222
20 12
15 10
6
0,50,3
0,3
Documentation
mooring
waiting vessel
TO BE
total time at the port
2
unmooring
0,50,3
0
AS IS
5
unloading
5
11,6
11
loading
Time (hrs)
30
Ship operations
Figure 18: Time Breakdown at the Port of Valencia - Present and Improved Situation. Using the aforementioned technologies, the total time at the port of Valencia becomes 11.6 hrs instead of the current record of 24.0 hrs. The difference of 12.4 hrs gains turns to the shipping company of US$ 7,300 (which is a moderate calculation concerning fuel and equipment only and based on shipping company estimations of US$ 590 per delayed hour, Table 2) and a corresponding capability for an increased number of trips.
Port Of Piraeus 32
35
Time (hrs)
30 25 18
20 15 10 5
16,1
TO BE
9
7
AS IS
6
3,5
3
0,50,3
0,50,3
total time at the port
unmooring
loading
discharging
mooring
queuing
0
Ship operations
Figure 19: Time Breakdown at the Port of Piraeus - Present and Improved Situation. The case of the port of Piraeus is slightly different because of an additional queuing time that had to be reduced. The implementation of the proposed technologies leads to a reduction of 15.9 hrs at the port and to a total gain of about US$ 9,400 (based on shipping company estimations of US$ 590 per delayed hour, Table 2).
15
6
Summary and Conclusions
The approach of this paper first analyzes, in appropriate detail, all the business and operational processes in order to assess the complete performance of service elements and thereafter identifies how to match the service performance against the user requirements. The business process analysis satisfies the need for objectivity and has the potential to offer improvement of a number of operational functions, the identification of new services, ship design features, as well as the specification of R&D requirements for the elements that seem to be missing. The specific business model consisted of several entities that correspond to the highest (top) level company processes and operations: company management, marketing and sales, ship management, services/operations, container management, port-to-port transport, door-to-door transport, quality management, information and communication management, accounting and finance, and administrative support. As the product of the shipping company is the transport service and as an effective model has to focus on the product, it was decided to analyze this entity deeper to a more detailed (lower) level so as to pinpoint sectors to be improved. Through the selection of appropriate but existing technologies, it was shown theoretically that the most critical parameters in a liner service, i.e. cost and time, decreased drastically. Although apparently restricted to the operational part, the results in terms of timesavings through the application of existing technologies with wide application were very promising. It became apparent that reduction in total port time for each of the two involved ports can be as much as 50% with the corresponding cost benefits being approximately from US$ 16,700 (based certainly on various assumptions). According to these figures, the application of the selected technologies “earns” for the vessel one port stop in each round trip, even if the present analysis is confined between the two predefined ports. This means that the implementation of a multi-port scenario for this marine company can produce significant benefits in time and monetary terms. Additionally, the specific enhanced scenario reduces the documentation and communication effort and further on it increases the speed of cargo clearance. These benefits are favorable to all involved parties of the transportation chain, and they will have a significant impact on the operations department of the shipping company. Therefore, better services could be expected, in terms of frequency, precision and lower prices. 7
Acknowledgements
Work on this paper was supported in part by EU project ADVANCES (DG-TREN Contract No. 2000-TN10007). The authors would like to thank the specific Greek shipping company (whose name is withheld for reasons of confidentiality) that provided all the useful information used in this paper and dedicated time and effort to assist the authors in constructing and quantifying the scenario described. 8
References
European Commission (2001), White Paper “European Transport Policy for 2010: Time to Decide”. Fyrvik, Torkel, Uthaug, Eirik (2003), Process Modelling as Basis for Development and Integration of New Information Systems. Paper presented at Intermodal Transport & Logistics (ITL) 2003 conference in Rotterdam. Hammer, Michael, Champy, James (1993), Reengineering the Corporation: a Manifesto for Business revolution. New York, Harper Business. Smith, Howard, Fingar, Peter (2002), Business Process Management, the Third Wave. Tampa, Florida, MeghanKiffer Press. Andersen, Bjørn (1999), Business Process Improvement Toolbox. Milwaukee Wisconsin, ASQ Quality Press. Ericsson (1993), Business Process Management. Gothenburg, Sweden. Ericsson Quality Institute. Glienke H., Meine J. (2001), VTS and MIS - Safety by Integration, Port Technology International, pp. 27-31. Rytkonen J., Hanninen S., Sonninen S. (2002), Sea-Borne Traffic in 2000 up to 2015 in the Gulf of Finland, VTT Industrial Systems, Espoo, Finland, pp. 1-5. Rytkonen J. (2002), VTT Recommends the Maritime Safety in the Gulf of Finland, VTT Industrial Systems, Espoo, Finland, pp. 1-2. Kountras A. (2002), VTMIS & VTS Implementation in Ports: The Hellenic Experience, INTRACOM SA, Athens, Greece, pp. 1-10.
16