Impact of Tariff Reductions in NAMA and Agriculture WTO Negotiations on GCC Common External Tariffs David Vanzetti and Ralf Peters Australian National University, Canberra and 1 Trade Negotiations and Commercial Diplomacy Branch, DITC, UNCTAD, Geneva. Contributed paper at the 54th AARES Annual Conference, Adelaide, South Australia 10-12 February 2010
Abstract
The Gulf countries (Bahrain, Kuwait, Oman, Qatar, Saudi Arabia and United Arab Emirates) have a common external tariff that is unusually low with the exception of selected products such as alcohol and tobacco. As exporters of oil and gas and importers of agricultural products, the GCC is interested in the impacts of tariffs reductions in these products following the eventual completion of the Doha round. Of particular interest are four sectors (raw materials, gas-related goods, fisheries and chemicals), in which it is hoped tariffs will be eliminated. This will improve market access for the GCC countries, but it may also increase the competition depending on the initial bilateral tariffs. In agriculture, rising import prices driven by policy changes occurring elsewhere will increase import costs in the GCC countries. Potential gains and losses are identified using a bilateral trade model.
1
Crawford School of Economics and Government, Australian National University, Canberra and Trade Negotiations and Commercial Diplomacy Branch, DITC, UNCTAD. Financial support by the Islamic Development Bank is gratefully acknowledged. The views expressed are those of the authors and do not necessarily reflect those of GCC members, UNCTAD or the IDB secretariat. Contact:
[email protected].
1
1. Introduction The current WTO negotiations present opportunities and challenges for GCC countries. 2 The WTO work programme, which originally covered agriculture, services and some aspects of TRIPS as part of the built-in agenda envisaged at the conclusion of the Uruguay Round, was extended at the WTO Ministerial Conference in Doha in November 2001 to include non-agricultural market access and several other areas. While some areas, such as trade and investment and government procurement, were subsequently excluded from the agenda for the negotiations, the current negotiations are extensive and could have consequences for the GCC countries, both as importers and exporters.
Prospects for further liberalisation As the global financial crisis continues, there will be pressures for countries to use protectionist measures to protect local industries, reducing the likelihood of a negotiated outcome. However, the need for a successful and development enhancing conclusion to the Doha Round is greater than ever. The WTO itself is confident that an outcome will be attained within the next two years. At present, the modalities for an agreement, specifying tariff cuts and exemptions, seem almost to be agreed. Not yet specified are details such as which products will be selected as exempt, and the precise treatment of these products. Nonetheless, although the final outcome is as yet unknown, if there is an agreement any time soon it is not likely to look very different from what is currently (June 2009) on the table, so an analysis of potential impacts on the GCC countries is timely. 3 One area of uncertainty in the negotiations relates to the elimination of tariffs in specific sectors of interest to developing countries. In this paper, attention is given to four sectors of interest to GCC exporters.
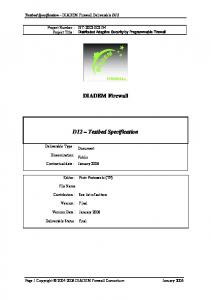
A short summary GCC countries are importers of agricultural products. In general, their applied tariffs are very low with a relatively high binding overhang. This means the proposed tariff reductions in bound agricultural tariffs will reduce their flexibility to increase tariffs but will not oblige these countries to open their markets any further with minor exceptions (figure 1). As net importers, they will benefit only marginally from the opening of markets in other countries. Agricultural exports are estimated to increase by ten per cent off a low base. However, the general rise in world prices accompanying liberalization will require GCC countries to pay more for imports of temperate products such as wheat, sugar and dairy products. Tariff revenue losses on processed tobacco products, a major import covered under the WTO Agreement on Agriculture, are estimated to be significant. The resulting annual welfare losses are estimated to amount to $143 million for the GCC group as a whole. From this perspective, the GCC would be favoured by a less ambitious outcome to the WTO Doha agriculture negotiations that led to lower increases in world prices.
2
The GCC countries include Bahrain, Kuwait, Oman, Qatar, Saudi Arabia and United Arab Emirates. 2
Figure 1: Initial and final agricultural tariffs 120 100 80
%
Initial 60
Final Applied
40 20 0 Bahrain
Kuwait
Oman
Qatar
Saudi Arabia
United Arab Emirates
In the industrial sector, GCC bound tariffs also exceed applied tariffs. Even the more ambitious NAMA proposal would have almost no impact on GCC applied tariffs (figure 2).
Figure 2: Initial and final industrial tariffs 120 100 80
%
Initial 60
Final Applied
40 20 0 Bahrain
Kuwait
Oman
Qatar
3
Saudi Arabia
United Arab Emirates
Since nothing is agreed until everything is agreed the outcome could be very different in which case it is difficult to decide which proposal to analyse. However, many analysts argue that either an agreement is similar to the latest drafts or negotiations would have to start almost from the beginning. 3
Tariffs on GCC exports, dominated by oil and oil-based products, are comparatively low, as few countries attempt to keep out energy products. Thus, there is some, but only limited, scope to benefit from improved market access.
Within the specific sectors, chemicals, fish, gas-related goods and raw materials, GCC countries face taxes averaging only 1.6 per cent on their exports. This reflects the low tariffs, 1.4 per cent, on raw materials, which contributes to the bulk of exports.
The elimination of global tariffs within these specific sectors has mixed benefits for GCC exporters. Estimated export revenue gains for the specific sectors amount $1,086 million for chemicals, $2,201 million for gas-related goods and $870 million for raw materials. The estimated increase in fish exports is a modest $20 million.
GCC countries have already undertaken substantial autonomous liberalization, including the formation of a customs union within the region. Therefore, in contrast to agriculture, GCC countries would most likely be favoured by the more ambitious proposals on the table in the NAMA negotiations. Losses incurred in specific sectors are relatively small, and additional growth engendered by an ambitious Doha outcome would most likely benefit all countries.
The analysis undertaken here does not examine domestic policies within the GCC countries, such as domestic support to agriculture, nor is there any attempt to look at macroeconomic issues. Only publically available data, from UNCTAD, WTO and FAO, have been used for the analysis.
Outline The outline of this report is as follows. In section 2, we review the state of play in the negotiations on agriculture and industrial tariffs. Next, we look at the existing border measures and identify what is left to negotiate. Within the Doha Round agricultural and industrial (NAMA) tariffs are negotiated separately, although the outcome of one impinges on the other. We specify likely scenarios for agricultural and industrial bound tariffs and calculate the resulting changes in applied tariffs. In section 4 we use the ATPSM agricultural trade model to quantify the effects of liberalisation on the GCC agricultural sector. In section 5 we look at industrial tariffs. The key trade-off in the negotiations is the level of ambition versus the necessary flexibility to protect politically sensitive industries. Rather than sticking to an agreed formula with no exemptions, history has shown that some flexibility is politically necessary. However, too many exemptions may undermine the level of ambition. To examine this trade-off three NAMA scenarios are compared. These portray a surprisingly narrow range of outcomes, with little difference between the three. In addition, the impact of eliminating tariffs in specific sectors is examined. Using GSIM, an Armington style bilateral trade modelling
4
framework, we attempt to quantify the resulting tariff changes and their economic impact in the four sectors.4 Finally, we draw implications for government policy in GCC countries.
2. The State of Play in the Negotiations The Uruguay Round Agreement in 1995 included a clause to commence negotiations on further liberalisation. The Doha Declaration included a commitment to a so-called single undertaking, by which nothing is agreed until everything is agreed. Agriculture and industrial tariffs are negotiated separately, as are several other issues, but they are not independent. The outcome for industrial tariffs depends on the level of ambition reached in agriculture, and vice versa. We look at the two sets of negotiations in turn.5
(i)
Agriculture
Many observers were surprised when the ongoing Doha Round of multilateral trade negotiations collapsed in July 2008. In the contentious negotiations, according to WTO Director General Pascal Lamy, 18 of the 20 major agenda items had been agreed, and the tariff cuts on the table, which would lead to reductions in agricultural bound tariffs between 33 and 70 per cent, seemed substantial. It appeared little could be gained by negotiating further. The obstacle seemed to be safeguard measures to control import surges, with China and India asking for flexible safeguards, and the USA insisting that such measures be limited. The final unresolved issue relates to domestic support for US cotton producers. This is a long-running concern, particularly for several West African cotton producing countries.
Nonetheless, negotiators have made significant progress since the previous suspension of the Round in 2006. The specific thresholds and tariff reductions have generally been agreed, as has the approach to the selection and broad treatment of exemptions for sensitive and special products. Details are contained in the Chairman‟s Draft Modalities Text (WTO 2008a). They agreed that tariff reductions shall be linear cuts within four bands, with the higher tariffs attracting greater reductions. Developed and developing country groups, such as the GCC, would have different thresholds and linear reductions, plus there would be differentiated treatment for various groups such as LDCs, recently acceded countries and small and vulnerable economies. The four bands suggested by the Chairman‟s draft (WTO 2008a) have thresholds of 20, 50 and 75 per cent for developed countries and 30, 80 and 130 per cent for developing countries. Within the four bands for developed countries, the respective average linear cuts would be 50, 57, 64 and 75 per cent, with a cap of 100 per cent on the final tariff. Within the four bands for developing countries the respective cuts would be two thirds in the
4
It would be preferable to use a fully specified general equilibrium model such as GTAP for such analysis, but data limitations do not allow this. 5 A more comprehensive discussion of the negotiations can be found in UNCTAD (2008). 5
respective bands with a cap at 150 per cent, notwithstanding that the bands have different thresholds. Least developed countries would be exempt from reduction commitments.
Sensitive products will not be totally exempt from tariff reductions, and countries that make use of such exemptions will normally be required to provide additional access in some alternative fashion such as increasing the import or tariff rate quota where these exist. A formula for increasing the quota as compensation for a lesser tariff reduction has been discussed but it is not clear how this would work. Sensitive products are exempt from tariff capping.
Bahrain, Kuwait, Qatar and the United Arab Emirates would undertake the "normal" developing country cuts. Oman as a recently acceded member would benefit from a moderation of cuts of 8 percentage points and would be allowed to keep tariffs at or below 10 per cent unchanged. Saudi Arabia as a very recently acceded member is not required to undertake reductions.
Table 1: Chairman's proposal for reduction of agricultural tariffs (December 2008) Developed countries Thresholds 75 75% ≥ X > 50% 50% ≥ X > 20% 20% ≥ X > 0
Recently Acceded Members (RAMs) Thresholds Reduction 38.7 130%
Developing countries
Reduction 70%
Thresholds
64%
130% ≥ X > 80%
42.7
130% ≥ X > 80%
34.7
57%
80% ≥ X > 30%
38.0
80% ≥ X > 30%
30.0
50%
30% ≥ X > 0
33.3
Implementation: 6 equal instalments over 5 years Overall average reduction: minimum 54%
130%
Reduct ion 46.7
Implementation: 11 equal instalments over 10 years Overall average reduction: maximum 36%
30% ≥ X > 0 25.3 Implementation period: 12 years Flexibility to exempt tariffs below 10% from reduction
Small and Vulnerable Economies Thresholds Reduc tion 36.7 130% 130% ≥ X > 32.7 80% 80% ≥ X > 30%
28.0
30% ≥ X > 0
23.3
Alternative option: average cut of 24 per cent.
Source: WTO (2008a)
The proposed tariff cuts tend to overstate the impact because of the gap in GCC countries between bound tariff rates, which are negotiated with the WTO, and the rates actually applied. For many countries the reductions in bound rates would only minimally affect the applied rates, and there would be little or no direct economic impact. The major effect of the Round would be to squeeze water out of the tariff, or more technically, remove the binding overhang. However, the flexibility to unilaterally increase applied rates would be reduced. The binding overhang in developed countries is much smaller, and changes in tariffs in the European Union and Japan could provide opportunities to developing country exporters not benefiting from preferential access. However, the scope for increased imports is limited somewhat by the exemptions for sensitive products.
(ii) The industrial tariff negotiations In November 2001, WTO Ministers agreed, in the part of the Ministerial Declaration relating to nonagricultural market access, "by modalities to be agreed, to reduce or as appropriate eliminate tariffs, 6
including the reduction or elimination of tariff peaks, high tariffs, and tariff escalation, as well as nontariff barriers, in particular on products of export interest to developing countries. Product coverage shall be comprehensive and without a priori exclusions" (paragraph 16 Doha Ministerial Declaration). Full account was to be taken of the special needs and interests of developing and least-developed country participants, "including through less than full reciprocity in reduction commitments, in accordance with the relevant provisions of Article XXVIII bis of GATT 1994…"6
The significance of the agreement was that the negotiations were to tackle some serious problems facing developing countries in their trade: tariffs, including tariff peaks, which are biased against their trade, and tariff escalation that hinders their attempts to industrialise. This lead ultimately to the acceptance of the harmonising Swiss formula, by which high tariffs are reduced proportionately more than lower tariffs.
Elements for negotiation The WTO General Council reached an important decision on the Doha Work Programme on August 1, 2004. This "July Package" (Annex B of WTO Document WT/L/579 of August 2, 2004) provides the basis for negotiations on non-agricultural market access. Points for discussion included: 1.
Elements for decisions on a formula for tariff reductions.
2.
Provisions for increasing binding coverage and setting the level of newly bound tariff rates. 7
3.
Sectoral elimination of tariffs on products of export interest to developing countries.
4.
Supplementary modalities ("zero-for-zero," sectoral harmonization, and request and offer). 8
5.
The possible elimination of low duties.
6.
Provisions for exemption from tariff cuts by least developed countries (LDCs).
7.
Special provisions to take account of commitments by recently acceded countries (RAMs).
6
No overall target was fixed, unlike in some earlier rounds of negotiations in the GATT. For example, from the outset it was agreed that industrial tariffs would be cut by one third in the Kennedy Round, while in the Uruguay Round it was agreed that developed countries would cut tariffs by 36 per cent and developing countries by 24 per cent. 7 In WTO negotiations on trade in goods, members commit to “binding” tariffs and lowering already bound tariffs. This involves each member listing commitments in a schedule of concessions. Increasing such bound tariff rates requires renegotiating schedules under GATT Article XXVIII and offering other tariff reductions to principal suppliers. 8 “Zero for zero” refers to an agreement by a critical mass of key importers and exporters to eliminate duties on selected products, with zero rates then being made available to other participants in the negotiations under the most favoured nation (MFN) principle, but without requiring any commitment on their part. “Sectoral elimination,” as discussed the Doha Work Programme, refers to agreement by all participants in negotiations to eliminate duties on selected products. Developing countries have argued that should such a modality be agreed, their participation should be voluntary. “Request and offer” refers to bilateral agreements on selected tariff rates that would apply to other participants in negotiations under the MFN principle. 7
8.
The need to take account of challenges faced by nonreciprocal preference beneficiaries and countries that are highly dependent on tariff revenues.
Points 6 (LDCs) and 8 (preference beneficiaries and tariff revenues) are not directly relevant to GCC countries, although countries to which they export may be affected. The remaining factors are directly applicable.
The current proposal The basis of the current proposal, as specified in the NAMA Chairman‟s Draft (WTO 2008b) is the harmonising Swiss formula of the earlier Tokyo Round. The formula implicitly specifies a maximum tariff, and this would differ between developed and developing countries, with developing countries having a higher maximum. The Chairman‟s Draft proposes a coefficient (maximum tariff) of 8 per cent for developed countries and 20, 22 or 25 per cent for developing countries, depending on the non-use or lesser use of flexibilities (exemptions) allowed for a limited number of tariff lines with some additional conditions. The more tariff lines that are exempted or receive lower cuts the deeper are the cuts for the remaining lines (i.e. the smaller is the Swiss coefficient).
The possibility of eliminating or harmonizing tariffs, voluntarily or otherwise, in particular in sectors of export interest to developing countries among a critical mass approach is also under discussion, but as yet unresolved. A participation rule for developing countries is highly controversial.
As in agriculture, Bahrain, Kuwait, Qatar and the United Arab Emirates would undertake the "normal" developing country cuts. It is proposed that Oman shall not be required to reduce any bound rates below 5 per cent after applying tariff cuts with a Swiss coefficient of 22. The use of the flexibilities would be limited (Paragraph 7 (g)). Saudi Arabia would be exempt from reduction commitments.
3. Existing patterns of tariffs and other interventions The six GCC countries have revised their applied tariff rates in recent years and have in 2008 a common external tariff at the HS 8-digit level for almost all products. Almost 10 per cent of applied tariff rates are zero and almost all the rest are 5 per cent. Only about 1 per cent of tariff lines have different values, mostly 100 per cent as in the case of tobacco. Some imports are prohibited.
Table 2: Distribution of 2008 GCC applied tariffs Tariff 0 per cent 5 per cent Other
Agriculture % 21.6 74.0 4.4
Source: Calculated by UNCTAD from World Integrated Trade Solution (WITS).
8
NAMA % 7.1 92.6 0.3
There are some exceptions to the common external tariff. For example meat of swine (02031100) has an applied rate of 5 per cent in Bahrain and UAE and a rate of 100 per cent in Oman. No tariff is available in the case of Kuwait and imports are prohibited in Qatar and Saudi Arabia. Differences also exist on alcohol products. Beer, for example, has a tariff of 50 per cent in UAE, 100 per cent in Oman and Qatar, 125 per cent in Bahrain and is prohibited in Kuwait and Saudi Arabia.
A few inconsistencies seem to exist between applied and bound rates. In a few cases Oman has different bound rates for a single 6-digit product (using an extension, otherwise tariffs are bound at the 6-digit level). In some cases in their 2008 applied rates, however, only one tariff line for that 6-digit product exists. In some cases one of the bound rates is below the applied rate. For example 391721 (tubes, pipes and hoses, and fittings) has a bound rate of 0 per cent for the extension 01 (for civil aircraft) and 6.5 per cent for the extension 02 (other). The applied rate is 5 per cent. Bahrain, Kuwait, Oman, Qatar and UAE did not foresee the prohibition of imports in their commitment schedule (bound rates). Yet the 2008 applied rates indicate the import prohibition of certain sensitive goods such as pork and opium. Saudi Arabia has prohibition of some items in its schedule. Bahrain has bound cigars and cigarettes at 35 per cent. The 2008 applied rate, however, is 100 per cent (with a minimum charge per unit). Likewise, Oman and Qatar have bound some products such as alcoholic beverages at 15 per cent but seem to apply 100 per cent.
Agricultural tariffs GCC countries provide only limited border support to their agriculture sectors, generally lower than developing countries as a whole. The average applied tariffs in GCC countries, shown in table 3, range from 4.9 per cent (Kuwait and Saudi Arabia) to 9.4 per cent (Oman). Average bound tariffs are about four times the applied average, providing scope for reductions in bound rates with little impact on current applied rates.
Table 3 Simple average agricultural tariffs on GCC imports
Bahrain Kuwait Oman Qatar Saudi Arabia United Arab Emirates
Bound % 38.9 100.0 28.0 25.7 20.0 25.4
Applied % 7.1 4.9 9.4 6.7 4.9 6.1
Source: WTO/ITC/UNCTAD World Tariff Profile database.
Industrial tariffs The most recent data show relatively low average applied tariffs of 4.7 per cent in GCC for industrial products (table 4). The average for applied tariffs is below bound rates, with a lower binding overhang
9
in Oman and Saudi Arabia, two recently acceded members of the WTO. This implies that large cuts in bound rates can be made with little or no affect on applied rates, although this doesn‟t apply for every tariff line.
Table 4 Simple average industrial tariffs on GCC imports Bound % Bahrain Kuwait Oman Qatar Saudi Arabia United Arab Emirates
Applied %
33.6 100.0 11.6 14.5 10.5 13.1
4.7 4.7 4.7 4.7 4.7 4.7
Source: Calculated by UNCTAD from WITS and WTO/ITC/UNCTAD World Tariff Profile database. Average includes zero tariffs, but tariff lines with missing values are excluded.
4. Estimating potential impacts of the WTO proposals on agriculture The agriculture proposal is described and analysed in this section. Industrial tariffs reductions are assessed in the following section. The likely outcome in the agricultural sector, as outlined in WTO (2008a), is detailed in table 5. The tariff thresholds and cuts are as shown.
Table 5 The agricultural proposal Scenario 1
Label Agriculture
Description Agriculture: Tariff cuts: Developed: If initial tariff >75, 70%; if >50 and ≤75, 63%; if >20 and ≤50, 57%; if ≤20, 50%. Developing: If initial tariff >130, 47%; if >80 and ≤130, 43%; if >30 and ≤80, 38%; if ≤30, 33%. i.e. developing country cuts two thirds of developed countries in equivalent bands. LDCs exempt. Sensitive products: One third of formula cuts on 4% of tariff lines for developed countries. TRQ expanded to 5% of domestic consumption. Two third of formula cuts on 2.67% of tariff lines and no expansion of TRQ for developing countries. Sensitive products ranked and chosen according to potential loss in tariff revenue. Special products for developing countries: No tariff cuts on cereals plus other imports (selected according to potential tariff revenue loss) accounting for 12% of tariff lines. 10
Export subsidies: to be eliminated. Domestic support: EU 80% reduction, USA and Japan 70% and others 55% reduction. Source: Based on WTO (2008a).
A less transparent issue relates to the selection and treatment of sensitive and special products. Countries may designate their own sensitive products, so at this point it is not possible to know which products are to be selected. The approach used here for sensitive products is to rank each country‟s tariffs according to the potential loss in tariff revenue and select the highest for exemption. This takes into account changes in applied tariffs plus the trade flows on those tariff lines. In reality, this selection is somewhat arbitrary and some countries may not choose these products.
Once selected, the treatment of sensitive products is as follows. One third of the formula cuts would apply to these tariffs in developed countries (with TRQs expansion) and two-third of the formula cuts in developing countries (without TRQ expansion). 9 This implies that if an import with an initial tariff of 100 were selected, the required developing country tariff cut would be two thirds of 43 per cent, i.e. 28 per cent. For special products, available to developing countries only, the cereals were selected as exempt from any tariff reduction since their designation shall be guided by indicators based on the criteria of food security, livelihood security and rural development. Cereals account for 2.3 per cent of tariff lines. An additional 9.7 per cent of tariff lines could be chosen as special products, taking the total to 12 per cent. To achieve an overall average cut of 11 per cent for special products the 9.7 per cent non-cereals are reduced by 13.6 per cent.
Estimated changes in intervention The economic impact of tariff liberalisation depends upon changes in applied rates, as distinct from the bound rates that are the subject of the negotiations. The changes in the applied rates for agriculture following the proposed scenario are shown in table 6 for individual GCC countries.
Average tariffs are reduced between 18 and 25 per cent, with the larger tariffs in Kuwait being reduced the most. The reduction in average tariff in Oman is relatively slight because of the special provision that apply to this country. Saudi Arabia is not required to make tariff cuts as a very recently acceded member. 9
Paragraph 78(a) of the draft text allows developing countries the option of taking only half of the entitlement of 5.33 per cent of tariff lines as sensitive products and to not increase or create TRQs for those products. Although this option allows developing countries only to deviate by one-third from formula cuts (instead of two-third maximum deviation as in the case for developed countries) the option to not introduce or increase TRQs has been welcomed by developing countries and has therefore been chosen here. 11
Table 6 Bound tariffs. Initial and final trade weighted agricultural tariffs Initial % Region Bahrain Kuwait Oman Qatar Saudi Arabia United Arab Emirates
Final %
57.1 100.0 21.8 34.9 42.6 36.6
47.0 74.5 18.1 27.6 42.6 27.5
Source: Simulations. As a very recently acceded member, Saudi Arabia is not required to undertake cuts in tariffs.
Initial and final average applied tariffs are shown in table 7. The changes are slight, almost imperceptible at this level of aggregation. For no country is there a change greater than one percentage point. Table 7 Applied tariffs. Initial and final agriculture tariffs Initial %
Final %
Region Bahrain 22.5 Kuwait 6.3 Oman 8.8 Qatar 12.7 Saudi Arabia 7.3 United Arab Emirates 11.4 Source: Simulations. Tariffs are trade weighted.
22.1 6.3 8.8 12.7 7.3 11.4
There are 1122 tariff lines at the tariff line level in agriculture. For Bahrain, for example, 22 of these applied tariffs are reduced by the proposed changes in bound rates. The numbers for the five other GCC countries, shown in table 8, are less. As a result the likely impact on tariff revenues in the agricultural sector, assuming no change in imports, is minimal.
Table 8 Potential impacts in tariff revenue in agricultural sector Tariff lines affected No. Region Bahrain Kuwait Oman Qatar Saudi Arabia United Arab Emirates
Initial tariff revenue $m
22 20 2 5 0 0
70 108 93 55 685 545
Source: Simulations.
12
Change in tariff revenue $m -1 -7 -0 -1 0 0
Sectoral impact in agriculture However, the averages hide greater changes in particular sectors. Almost all the items with high tariffs are in HS Chapter 24, tobacco and related products. Of greatest, indeed outstanding significance for tariff revenues, are imports of cigarettes into Bahrain and Kuwait. In Bahrain, with imports amounting to $29.6 million, the 35 per cent applied tariff would be reduced to 30 per cent and the 100 per cent rate reduced to 86 per cent. This assumes that these products are selected as special products with reduction of 13.6 per cent rather than those special products without any reductions or products receiving full or moderated formula cuts. In Kuwait, with imports of $54 million, the current bound and applied tariff is 100 per cent and would be reduced to 86 per cent.
Other products where tariff revenue is affected in Bahrain are ethyl alcohol and other spirits and wines. Likewise, for Qatar the most significant import affected by the proposed reductions is alcoholic beverages such as spirits, fermented beverages and vodka. A detailed list identifying all products where applied rates are affected at the disaggregated GCC CET tariff line level is attached as an Excel file.
The exact impact on the applied rates, however, depends on the selection of special and sensitive products where countries have flexibility. If products other than cereals would have been selected, the implication for applied rates and for the tariff revenue would be different. The somewhat critical HS Chapter 24, tobacco and related products, accounts for 1.8 per cent of GCC's applied agricultural tariff lines. Up to 5 per cent of tariff lines could be designated as special products without any cuts. Thus, if tobacco products as well as the few other products where applied rates are affected would be selected as those special products there would be no any impact on the tariff revenue. However, since the selection of special products shall be guided by indicators based on criteria of food security, livelihood security and rural development, it is questionable whether tobacco products not produced in GCC could be selected as special products. If not, the products could be selected as sensitive but the impact on tariff revenue and the final applied rate would be higher. On the other hand, a fall in tariffs would lead to an increase in imports, offsetting the tariff cuts to some extent but undermining the intention of the tariffs.
Because of the large gap between bound and applied rates for most agricultural items in the GCC, the impact of the WTO proposal on GCC imports would be slight. Trade liberalisation provides opportunities for exporters to enhance their exports. In the case of the GCC, agricultural exports are minimal so this effect is negligible. More important, however, is the impact of rising world prices on GCC agricultural imports. World prices rise because producer support, via tariffs, export subsidies and domestic support, is reduced in many countries, in particular, the European Union and Japan.
13
Modelling changes in trade policy To assess the impact of rising world prices on the GCC we use ATPSM, a static global agricultural trade model jointly developed by UNCTAD and FAO. The model distinguishes between bound and applied tariffs and includes tariff rate quotas (where the tariff rate depends on whether imports exceed a specified quota), two important features of the post Uruguay Round tariff structure. The model results are driven by changes in policy variables (tariffs, export subsidies, domestic support and tariff rate quotas) which determine changes in domestic prices, consumption and production. This in turn leads to a change in imports and exports, which feed into world prices. The model solves by finding a set of world prices that equate global imports and exports. Intersectoral effects are captured through cross-elasticities, but there are no constraints on the use of resources such as capital, labour or water. Nor is there account of changes in stocks. Imports are assumed to be homogeneous, with consumers and importers indifferent to the source of their products. 10 The results indicate the effects of the policy changes assuming a constant base, 2002-2004. There is no account of exogenous growth over the implementation period. The model is well-documented (Peters and Vanzetti 2004) and is downloadable from the UNCTAD website. 11 One limitation is the model commodity coverage, shown later in table 10, which does not include all the products covered by the Agreement on Agriculture. For example, wool is not included. Price and production data are an average of 2002 to 2004 and are compiled from FAO statistics.12 Elasticities are from FAO's World Food Model. These are based on a trawling of the literature and are not econometrically estimated specifically for the model. Some of the elasticities were modified by UNCTAD to reflect homogeneity, symmetry and other conditions. The WTO/ITC/UNCTAD World Tariff Profile database is the source of information on applied and bound tariffs. Applied rates are 2006 or 2007 data and bound rates are the final Uruguay Round rates. Data can be accessed through the WITS software.
The standard ATPSM does not contain data for Bahrain, Oman and Qatar. For this application production and trade quantity data were obtained from FAO (FAOSTAT) and refer to 2006. For consistency, data for Kuwait, Saudi Arabia and United Arab Emirates were updated from the same source. Supply and demand elasticities for Bahrain, Oman and Qatar were unavailable and thus set equal to those from Kuwait, a similar country.
Simulation results for agriculture
10
An Armington approach is used on the demand side to differentiate domestic and foreign products, but there is no differentiation between imports from different sources. 11 The standard version of ATPSM is downloadable from www.unctad.org/tab. 12 World prices for many commodities rose sharply in 2007 and 2008, and then fell in 2009. By not taking more recent data into account, the modelling underestimates the positive and negative impacts. 14
The WTO agricultural proposal, as described earlier in table 5, leads to an increase in world prices of agricultural products. Because GCC tariffs are virtually unchanged, these price changes push up domestic prices within the GCC, to the detriment of consumers and the benefit of producers. Where tariffs are reduced further than the rise in world prices, domestic prices will fall, with the opposite effects on producers and consumers. The changes in world prices leave agricultural importers such as the GCC countries worse off as a result. GCC imports, at around $17.5 billion in the base period, greatly exceed exports, $1.2 billion. The slight increase in the cost of imports, less than half a per cent, hides a fall in the quantity of imports and reflects a 5 per cent increase in the prices of traded agricultural goods. Export revenues rise because price and quantity are both increasing.
Government (tariff) revenue may rise or fall depending on the responsiveness of consumers to a fall in the price of imports. A tariff reduction may lead to an increase in revenue if imports increase sufficiently. The fall in the tariff on processed tobacco (i.e. cigarettes) and some beverages is the most significant factor reducing the overall revenue for Kuwait and Oman (table 9).
While the goal of market access negotiations appears to be the increase in exports, by itself this measure does not take into account the additional costs of producing the increase in exports. A more complete measure of the gains to the sector is welfare, defined here as the change in consumer and producer surplus plus government revenue. The welfare changes are negative because the predominant effect is a rise in import prices which are detrimental to consumers and do little to benefits the relatively few agricultural producers. In addition, there are no gains from a more efficient allocation of resources, because distortionary tariffs, already quite low, are not reduced.
Table 9 Potential impacts of WTO agricultural proposal on trade and welfare in GCC members Country
Bahrain Kuwait Oman Qatar Saudi Arabia U. A. Emirates GCC
Export revenue $m 0.32 1.44 5.57 0.35 74.21 40.33 122.22
Import cost $m 9.34 -0.03 -3.84 2.80 15.12 38.93 62.32
Government revenue $m
Welfare
0.51 -9.13 -6.96 0.55 1.02 6.78 -7.23
-19.66 -8.46 -16.59 -7.69 -40.49 -50.03 -142.92
$m
Source: ATPSM simulations.
The sectoral effects are shown in table 10. The largest price increases, driven by changes in EU and Japanese policies, are in wheat, sugar and livestock products. The largest exports are refined sugar, cheese, livestock, vegetables and tea, mainly from Saudi Arabia and United Arab Emirates, but the export revenue gains are concentrated in wheat, sugar and cheese. The top five imports are processed
15
tobacco, poultry meat, livestock, barley and refined sugar. The major importer is the United Arab Emirates and the major import into the region is processed tobacco. At $10 billion, this accounts for more than half of the total GCC agricultural imports. The major sectors contributing to the increase in the cost of imports are refined sugar ($33 million), cheese ($23 million), barley ($14 million) and maize ($11 million). There are also falls in imports in some sectors, namely livestock ($18 million), sheep meat ($20 million) and tomatoes ($15 million).
Table 10 Potential impacts of WTO agricultural proposal on world prices and welfare in GCC Commodity
Livestock Bovine meat Sheepmeat Pigmeat Poultry Milk, conc. Butter Cheese Hides & skins Wheat Rice Barley Maize Sorghum Sugar, raw Sugar, refined Coffee, green Coffee, proc. Cocoa beans Cocoa, proc. Tobacco leaves Tobacco, proc. Oilseeds, temp. Oilseeds, trop. Vegetable oils Pulses Tomatoes Roots & tubers Apples Citrus fruits Bananas Other tropical fruits Tea Rubber Cotton Total
World price % 0.73 3.90 5.32 2.71 -3.65 5.23 8.39 7.53 1.95 14.80 2.09 2.38 6.98 1.24 2.15 7.02 0.06 1.91 -0.04 2.23 2.72 0.00 3.84 0.27 1.60 0.87 1.53 1.58 3.45 2.53 0.86 1.20 1.45 0.00 1.41 5.52
Export revenue $m
Import cost $m
1.68 1.06 1.15 0.00 -3.34 1.00 1.13 20.22 1.16 35.67 0.29 0.04 0.16 0.09 0.01 26.76 0.00 0.43 0.00 0.00 0.08 0.00 0.23 0.00 2.44 0.06 0.13 0.19 0.37 1.98 0.04 28.14 1.03 0.00 0.05 122.22
Government revenue $m
-17.96 2.45 -19.58 0.02 6.64 4.10 3.43 23.37 0.11 3.76 5.96 14.48 11.30 -0.02 0.00 32.87 0.03 0.96 0.00 0.08 0.69 0.00 3.95 0.08 4.16 1.11 -15.07 -0.50 1.04 -2.93 -0.01 -4.46 2.03 0.00 0.22 62.32
Source: ATPSM simulations. * Average world price is weighted by base exports.
16
-0.99 0.17 -1.37 0.00 -0.10 0.29 0.31 2.09 0.02 3.11 0.37 0.09 0.33 0.00 0.00 4.28 0.00 0.13 0.00 0.01 1.14 -16.95 0.56 0.01 0.48 0.13 -1.07 -0.02 0.10 -0.12 -0.01 -0.48 0.24 0.00 0.04 -7.23
Welfare $m -5.75 -14.44 -15.50 -0.08 44.66 -5.92 -7.71 -18.39 -0.03 -22.65 -9.39 -15.86 -13.99 -0.01 0.00 -18.70 -0.04 -1.43 0.00 -0.19 -2.86 -4.23 -8.26 -0.16 -3.64 -1.67 -7.18 -0.03 -5.83 -0.15 -1.10 -0.39 -1.70 0.00 -0.30 -143.00
Tariff revenue losses are concentrated, almost exclusively, in the processed tobacco sector, where the fall in revenue is estimated at $17 million. Other sectors show small gains or losses.
Temperate cereals and livestock products contribute to the overall welfare losses. Bovine meat, sheepmeat, cheese, wheat, barley, maize and sugar all contribute substantially to welfare losses. Almost all sectors show a loss. The exception is poultry, where a fall in world prices benefits consumers, particularly those in Saudi Arabia. Poultry is currently lowly protected compared with beef and sheepmeat.
With the main effect of a likely Doha outcome for GCC countries being a rise in world prices, it is useful to examine import costs by commodity and country. These are shown in table 11. Wheat is the key increase in import costs for Bahrain, Oman, and Qatar, but Saudi Arabia produces almost all of its own wheat and its imports are estimated to fall as producer respond to higher prices. However, barley is a major import of Saudi Arabia, and the increased world price is difficult to offset through additional production. For United Arab Emirates, sugar is a major import, but half the 1.3 million tonne imports are re-exported. The higher price of sugar inflates the import costs.
As agricultural importers, GCC countries are unlikely to be favoured by the increase in world prices that would accompany liberalisation of world agricultural markets. The estimated impacts take into account the propensity for consumers to substitute away from higher priced imports. There is only limited scope to increase production to take advantage of higher export prices. Without considering linkages with other sectors, it would seem the GCC countries would fair better with a modest rather than ambitious Doha outcome in agriculture.
17
Table 11 Potential impacts on GCC agricultural import costs Commodity
Livestock Bovine meat Sheepmeat Pigmeat Poultry Milk, conc. Butter Cheese Hides & skins Wheat Rice Barley Maize Sorghum Sugar, raw Sugar, refined Coffee, green Coffee, proc. Cocoa beans Cocoa, proc. Tobacco leaves Tobacco, proc. Oilseeds, temp. Oilseeds, trop. Vegetable oils Pulses Tomatoes Roots & tubers Apples Citrus fruits Bananas Other tropical fruits Tea Rubber Cotton Total
Bahrain $m
Kuwait $m
Oman $m
Qatar $m
Saudi Arabia $m
UAE
-0.11 0.08 -0.87 0.00 -0.13 0.07 0.04 0.31 0.00 9.31 0.10 0.00 0.00 0.00 0.00 0.16 0.00 0.03 0.00 0.00 0.01 0.00 0.02 0.00 0.04 0.01 0.06 0.00 0.04 0.00 0.00
-0.48 -0.03 -3.30 0.00 -0.08 0.27 0.21 1.23 0.00 0.21 0.50 0.16 0.22 0.00 0.00 1.60 0.00 0.01 0.00 0.00 0.01 0.00 0.02 0.00 0.23 0.06 -0.72 -0.02 0.05 0.00 0.00
-4.15 0.24 -3.89 0.00 -0.75 0.04 0.22 0.61 0.00 6.36 0.36 0.04 0.09 0.00 0.00 1.17 0.00 0.06 0.00 0.00 0.00 0.00 0.08 0.00 0.46 0.02 -0.87 0.00 0.06 -0.03 -0.14
-0.26 0.13 -0.22 0.00 -0.62 0.06 0.05 0.42 0.00 2.43 0.20 0.04 0.02 0.00 0.00 0.16 0.00 0.16 0.00 0.00 0.05 0.00 0.01 0.00 0.06 0.03 0.03 0.00 0.02 -0.02 0.01
-9.99 1.70 -9.27 0.02 11.19 3.08 1.82 13.07 -0.04 -15.77 3.13 13.79 8.97 -0.02 0.00 3.12 0.02 0.17 0.00 0.02 0.01 0.00 0.29 0.02 1.07 0.26 -9.63 -0.48 0.39 -2.45 0.11
-2.98 0.32 -2.02 0.00 -2.97 0.57 1.08 7.72 0.15 1.22 1.66 0.45 2.01 0.00 0.00 26.64 0.00 0.53 0.00 0.05 0.61 0.00 3.53 0.05 2.30 0.72 -3.94 -0.01 0.48 -0.43 0.01
0.00 0.02 0.00 0.11 9.34
-0.20 0.01 0.00 0.00 -0.03
-4.06 0.24 0.00 0.00 -3.84
-0.02 0.04 0.00 0.00 2.80
-0.02 0.48 0.00 0.03 15.12
-0.17 1.24 0.00 0.08 38.93
$m
Source: ATPSM simulations. These estimates include trade within the GCC region.
5. Estimating potential impacts of the WTO proposals on industrial tariffs Three NAMA scenarios are detailed in table 12. Scenarios 2 to 4 have different coefficients, 25, 22 and 20, for the Swiss coefficient for developing countries. Associated with the different coefficients are varying levels of exemptions. The restrictive Swiss coefficient (20) is combined with high flexibility, where the selected (sensitive) products can cover up to 14 per cent of tariff lines that do not account for more than 16 per cent of imports. Those products are reduced by half of the formula cuts.
18
A second option in combination with a coefficient of 20 is to fully exempt up to 6.5 per cent of tariff lines provided they do not account for more than 7.5 per cent of imports. Swiss 22 provides half cuts for 10 per cent of tariff lines/imports or full exemption for 5 per cent of tariff lines/imports, whereas Swiss 25 allows no flexibility. Sensitive products are selected according a number of filters. The first is the loss in tariff revenue, calculated with Swiss = 20. If the tariff revenue loss is equal or zero, the percentage binding overhang is used as a criterion, with the more sensitive having the lower the overhang. Additional filters are trade, applied tariffs and bound tariffs in descending order. The calculated changes in bound and applied tariffs and tariff revenue losses are shown. The scenarios do not include sectoral elimination in the: (i) chemicals; (ii) fisheries; (iii) gas-related goods; and (iv) raw materials sectors. The impacts of sectoral elimination will be examined separately.
Table 12 Scenarios Formula 2
Label NAMA 20
Description NAMA: Tariff cuts: Swiss formula Developed Swiss coefficient 8 Developing Swiss coefficient 20 LDCs no reductions. Bindings: 25 percentage points above applied rate. Bind and cut. For developing countries with less than 15% (35%) bound tariffs, 75% (80%) of tariff lines to be bound at an average tariff of 30%. Flexibilities: not applying formula cuts for up to 14% of non-agricultural national tariff lines provided they do not exceed 16% of the total value of a developing Member's non-agricultural imports. Sectoral elimination: none
3
NAMA 22
NAMA: Tariff cuts: Swiss formula Developed Swiss coefficient 8 Developing Swiss coefficient 22 LDCs no reductions. Bindings: as for NAMA 20. Flexibilities: not applying formula cuts for up to 10% of non-agricultural national tariff lines provided they do not exceed 10% of the total value of a developing Member's non-agricultural imports. Sectoral elimination: none
4
NAMA 25
NAMA: Tariff cuts: Swiss formula Developed Swiss coefficient 8 19
Developing Swiss coefficient 25 LDCs no reductions. Bindings: as for NAMA 20. Flexibilities: none. Sectoral elimination: none
Formula tariff cuts These scenarios require some explanation. For NAMA, a non-linear harmonizing Swiss formula would apply. The formula is: T1 = (ta x T0)/(ta + T0), where T1 is the final tariff, ta the maximum tariff (Swiss coefficient), and T0 the initial tariff. The selection of values for the coefficients within a formula approach can have a significant impact on the resulting tariff reduction obligations. Typically, ta is higher for developing than developed countries, but common to all countries within the group. This implies that developing countries undertake lesser reductions for a given tariff of e.g. 100 per cent than under a common coefficient. The effect of the various coefficients on final tariffs is shown in figure 3 for the developed (8) and developing countries (20, 22 and 25) respectively. In the first instance a tariff of 100 in a developed country is reduced to 7.4 per cent. For developing countries the final tariff would be between 17 and 20 per cent depending on the selected coefficient. Least developed countries undertake no tariff reductions.
Figure 3 Swiss formula
Final tariffs %
25 20 25 15
22
10
20 8
5 0 1
9
17
25
33
41
49
57
65
Initial tariffs %
20
73
81
89
97
Saudi Arabia does not have to make any tariff cuts since it is a very recently acceded member (vRAM). There is a special provision for Oman, specifying that it does not have to reduce tariffs below 5 per cent. Oman has industrial tariffs averaging 11.6 per cent. The specific provision is particularly useful for many of Oman's tariff lines bound at 5 and 5.5 per cent.
Estimated impacts of changes in industrial tariffs Changes in GCC average industrial tariffs under the three NAMA proposals are shown in table 13. The initial tariffs are included as a comparison. For Bahrain, the initial average tariff of 33.6 per cent is reduced to 12.9 per cent under the more ambitious NAMA 20, 13.5 per cent under NAMA 22 and so on. While the harmonising effect, with larger tariffs being reduced by proportionately more, is plain to see, it is also clear that there is little difference between the three scenarios.
Table 13 Bound tariffs. Initial and final industrial tariffs Initial % Region Bahrain Kuwait Oman Qatar Saudi Arabia United Arab Emirates
NAMA 20 %
33.6 100.0 11.6 14.5 10.5 13.1
12.9 20.8 6.7 8.7 10.5 8.1
NAMA 22 % 13.5 22.1 6.9 9.0 10.5 8.4
NAMA 25 % 13.8 20.0 7.2 9.5 10.5 8.8
Source: WITS and simulations. As a very recently acceded member, Saudi Arabia is not required to undertake cuts in tariffs.
While the ambitious Swiss formula considerably reduces the scope to apply higher rates in future, in terms of economic impact of more immediate interest is the change in applied tariffs. These calculated changes are shown in table 14. It is clear that the changes in bound rates have almost no impact on the average applied rates. For Bahrain, Kuwait, Qatar and Saudi Arabia, the changes are imperceptible. Of course, this only applies to averages. Table 14 Applied tariffs. Initial and final industrial tariffs
Region Bahrain Kuwait Oman Qatar Saudi Arabia United Arab Emirates
Initial %
NAMA 20 %
NAMA 22 %
NAMA 25 %
4.8 4.5 4.2 4.8 4.0 3.7
4.8 4.5 4.1 4.8 4.0 3.7
4.8 4.5 4.2 4.8 4.0 3.7
4.8 4.5 4.1 4.8 4.0 3.6
Source: WITS and simulations. Tariffs are trade weighted.
Table 15 shows the number of tariff lines affected and the implicit loss in revenue, assuming each country chooses the option that maximizes its tariff revenue, and no change in world prices or the 21
quantity of imports. The proposed changes have no affect on any applied tariffs in Bahrain or Kuwait. Applied tariffs in Oman and Saudi Arabia are not affected due to the special provisions for these countries not to reduce bound tariffs below 5 per cent or to not reduce any tariffs, respectively. In Qatar and United Arab Emirates exactly the same 403 tariff lines of the CET are affected, a small share, 6.74 per cent, of the 5,979 industrial tariff lines. These are all products where the bound rate is 5.5 or 5 per cent and the corresponding applied rate is 5 per cent. None of the three options allows Qatar and United Arab Emirates to completely avoid any affect on applied rates. For example, one option is to apply a Swiss coefficient of 20 and exclude 6.5 per cent of tariff lines that do not account for more than 7.5 per cent of imports from any cuts. In that case other tariff lines that are bound at 6.5 per cent would bite into applied rates.
The number of affected tariff lines in Qatar and the United Arab Emirates would be minimized by choosing a Swiss coefficient of 22 and leaving 5 per cent of tariff lines, not accounting for more than 5 per cent of their imports, unchanged. In this case the number of affected lines could be reduced to 106. Cuts in these remaining affected lines would be, however, deeper than in the scenario where 10 per cent of lines receive half of the normal cuts. The products that could be exempt from any cuts could be selected from the attached list of affected tariff lines (under the option Swiss 22 with half of the normal cuts for 10 per cent of tariff lines) if the objective is to minimize the number of affected CET tariff lines. One product (HS 284210) is bound at 6 per cent in the United Arab Emirates and would have to be added to the list. This product would not be affected with half of the normal cuts but would be with full cuts. The difference of the average new bound rate between the options of half of the cuts for 10 per cent or no cuts for 5 per cent of the tariff lines is small. The new average with full exemption of 5 per cent is slightly lower than under the other half-cut option. In Qatar the new average would be 8.53 per cent instead of 9.0 per cent and in the United Arab Emirates 8.09 instead of 8.4. The additional condition that the 5 per cent of tariff lines must not account for more than 5 per cent of imports is not restricting the choice of products, based on UN Comtrade trade data for Qatar and the United Arab Emirates.
Therefore, Qatar and the United Arab Emirates, would have to consider advantages and disadvantages of the two discussed options: one in which 404 tariff lines are affected and where the applied rate is reduced from 5 per cent to 4.95 per cent in the majority of these cases (see attachment) or in which 106 tariff lines are affected and reduced from 5 per cent to at least 4.4 per cent. Thus, there is a tradeoff between width and depth of cut.
The change in tariff revenue is a small share of the respective totals, less than 1 per cent in both cases. Across the industrial sector as a whole, the impact of the proposed tariff changes is slight. A listing of the affected lines for Qatar and United Arab Emirates is provided in an attachment to this document.
22
The most affected lines, at least as far as tariff revenue losses are concerned, include aircraft and parts thereof (HS8803) followed by inorganic chemicals (HS2804).13
Table 15 Tariff revenue-maximizing option, and tariff revenue effects Option and coefficient
Final applied tariff under option %
Tariff lines affected No.
Initial tariff revenue $m
Implicit change in tariff revenue $m
Region Bahrain Kuwait Oman
Swiss 25 4.8 0 1,340 0 Swiss 25 4.5 0 450 0 Swiss 22, 10% half cuts 4.2 0 200 0 Qatar Swiss 22, 10% half cuts 4.8 403 1,010 -1 Saudi Arabia n.a. 4.0 0 8,190 0 United Arab Swiss 22, 10% Emirates half cuts 3.7 403 2,750 -2 Source: Simulations. Change in tariff revenue is calculated assuming no change in imports or prices. Sectoral elimination The sectoral issue became more and more important in the NAMA negotiations. For the United States and other mainly developed counties the real commercial value of the formula reduction is seen low and for political support of a Doha agreement they seem to need participation of emerging economies such as China, Brazil and India in some important sectorals. The latter and others stress that participation should be non-mandatory, as agreed in the Hong Kong Ministerial. There is also uncertainty regarding the critical mass. Commitments may only come into force when countries accounting for a critical mass of world trade participate, mostly proposed to be 90 per cent.
Uncertainty also exists with respect to special and differential treatment for participating developing countries. Different approaches such as linking participation to the Swiss coefficient have been suggested. Some sector specific proposals suggest partial liberalisation, with tariffs not being reduced to zero, or only involving a selection of countries. Because of the multitude of potential scenarios, two extreme case are reported here. One in which all developed and developing countries participate and eliminate tariffs on the corresponding products and one in which only the EU, Japan and the United states participate and eliminate tariffs. This illustrates the importance to GCC exports of involving developing as well as developed countries in tariff reductions.
13
These ranking are somewhat arbitrary. A different aggregation, for example at the six digit level, may provide different results. 23
Proposals on sectorals Sectoral Chemicals
Critical mass, % 90
Modality for tariffs Elimination
Fish
90
Elimination
Raw Materials
90
Elimination
Special and Differential Treatment for DCs Longer implementation period; bind 4% of lines at 4% OR extended impl. period for 5% of lines Longer implementation period; bind 15% of lines at 5%, bind one 6-digit sub-heading at 10% Not specified
Source: NAMA Draft Modalities Text, WTO (2008b); Note: Figures are mostly in brackets in the draft. Gasrelated goods sectoral is not included in the NAMA text.
The proposals for sectoral elimination have a greater impact because they may require the removal of bound and hence applied tariffs in particular sectors. 14 Although predominantly exporters, GCC countries have relatively high bound tariffs in the four sectors of interest, as shown in table 16, with chemicals a possible exception. A listing of the HS codes for products in each of the four sectors is found in an attachment. 15 Chemicals cover fertilizer and plastics, made from oil-based products. Gases are by-products of oil production, and related equipment such as gas turbines (pumps). Raw materials include oil-based products plus ores, minerals and base metals. As with other industrial products, applied rates are much lower. In fact, under the NAMA proposals, without sectoral elimination, the applied rates in these sectors are hardly changed. This is shown in the third part of table 16. With sectoral elimination, the applied tariffs would go to zero. Nonetheless, with initial applied tariffs so low, GCC countries are unlikely to be concerned with a flood of imports.
Table 16 GCC tariffs in selected sectors Raw materials % Simple average initial bound tariff Bahrain 32 Kuwait 100 Oman 16 Qatar 17 Saudi Arabia 12 United Arab Emirates 15
Fish
Chemicals
%
Gas-related goods %
28 100 19 15 10 15
31 100 17 13 9 13
31 100 5 8 5 7
14
%
It is no presumption that these proposals will be successfully negotiated within the Doha Round and subsequently implemented. In particular, there is significant uncertainty relating the chemicals sector. The sectoral initiative for gas-related goods is not included in the 14 sectors covered in Annex 6 of the NAMA draft modalities text, WTO (2008b). It was submitted by Qatar to the Committee on Trade and Environment in Special Session and the Negotiating Group on Market Access. The name „gas-related goods‟ and the selection of goods is based on the submission of Qatar (TN/TE/W/27 and TN/MA/W/33). Corresponding tariffs in other countries had to be specified at the HS 6-digit level. 15 GCC_FourSectorCodes.xls. 24
Simple average initial applied tariff Bahrain 4.9 Kuwait 4.9 Oman 4.9 Qatar 4.9 Saudi Arabia 4.9 United Arab Emirates 4.9
3.2 3.2 3.2 3.2 3.2 3.2
Simple average final applied tariffs without sectoral elimination Bahrain 4.9 3.2 Kuwait 4.9 3.2 Oman 4.9 3.2 Qatar 4.9 3.2 Saudi Arabia 4.9 3.2 United Arab Emirates 4.9 3.3 Source: WITS and simulations.
5.0 5.0 5.0 5.0 5.0 5.0
4.5 4.5 4.5 4.5 4.5 4.5
5.0 5.0 5.0 5.0 5.0 5.0
4.5 4.5 4.5 4.4 4.5 4.4
The initial tariffs facing GCC exporters in the selected sectors are shown in table 17. The bound tariffs are generally more than twice the applied tariffs. The final column shows the tariff revenue collected on GCC exports in these sectors. The removal of these tariffs would transfer this revenue to consumers in importing countries, but some of the gain would be captured by exporters, depending on the elasticity of demand. Note that the trade weighted applied tariffs are much lower than the simple average bound. Thus the potential gains from sectoral elimination are not as great as the bound tariffs would suggest.
Table 17 Initial tariffs facing GCC exports prior to sectoral elimination Simple Simple Trade average average weighted bound applied average bound % % % Chemicals Fish Gas-related goods Raw materials
21.88 20.72 13.67 17.80
7.63 13.21 3.22 4.60
12.38 13.37 3.17 7.27
Trade weighted average applied % 4.27 6.08 1.49 1.39
Exports
Imputed tariff revenue
$m
$m
22669 292 33144 353969
968 18 494 4920
Source: Simulations.
To quantify the potential impacts of sectoral elimination on GCC countries, we use a comparative static, deterministic, bilateral trade modelling framework, GSIM. 16 The data required are annual 16
Details of the modelling framework, which contains no data, can be found in the appendix. 16 GSIM was developed by Joseph Francois of the Tinbergen Institute and H. Keith Hall of the U.S. International Trade Commission. The model is documented in a memo by these authors entitled „Global Simulation Analysis of Industry-Level Trade Policy‟, October 2002. See also Francois, J.F. and H.K. Hall, “Partial Equilibrium Modeling,” in J.F. Francois and K. Reinert, eds., Applied Methods for Trade Policy Analysis: A Handbook, Cambridge University Press: Cambridge, 1997. A more recent non-linear version is used here. This is detailed in Francois (2007). 25
bilateral tariffs and trade flows and elasticities of demand, supply and the substitution between imports of different sources, the so-called Armington elasticity. For this application the world is divided into eleven regions, six GCC countries plus the European Union, the United States, Japan, China and Rest of World (RoW). GSIM is a single sector model with no cross-elasticities or linkages to upstream or downstream sectors. To assess the impact of a policy change we specify the removal of bilateral tariffs in each sector individually, and simulate the model to find a new set of market clearing prices. Comparing the initial and final outcomes provides an indication of the likely impacts. The bilateral trade and tariffs data, obtained from UNCTAD TRAINS via WITS, are shown in an attachment. The demand and Armington elasticities were obtained from the well-known GTAP database where available.17 The supply elasticity was set at 0.5 across the board. 18 Outputs shown here include producer and consumer surplus, government revenue and sectoral welfare in each country. The trade, tariff revenue and welfare estimates are shown in table 18.
GCC countries as a group are estimated to experience trade and welfare gains from the elimination of tariffs in the four sectors collectively. Because tariffs on imports are eliminated, tariff revenue is reduced to zero. Tariff revenue losses for the GCC countries amount to $914 million in the four sectors. The bulk of the welfare gains accrue in the gas-related goods and raw materials sectors, on which GCC countries face varying tariffs in developing countries. This implies that the gains to exporters, shown as export revenue in table 18, outweigh the losses to consumers (not shown) and taxpayers. The main effects are distributional, with large transfer between taxpayers and consumers. (These may be the same people.) The net welfare effects are less significant by comparison.
Saudi Arabia is a significant beneficiary of sectoral elimination in the chemicals and gas-related goods sectors. This is driven by the removal of EU and RoW tariffs on chemicals and gas-related goods. Kuwait also gains in the gas-related goods market from the removal of RoW tariffs. Qatar benefits from the removal of tariffs on Gas exports to China and the RoW, even though these tariffs are already quite low, 3.3 and 2.8 per cent respectively. The major markets for the United Arab Emirates are Japan and RoW for Gas and raw materials. Japanese tariffs on these items are already at zero, with no scope for further gains, but RoW tariffs average 4.2 per cent for gas-related goods. Oman benefits from gas-related goods and raw materials exports to RoW, in which it faces tariffs from 2.9 and 5.6 per cent respectively. Tariffs in a major market, Japan, are as low as they can go. Finally, among the GCC, Bahrain also exports gas to China, the United States and the RoW, where
17
Demand elasticities are available for the EU25, USA, Japan and China, although the correspondence with GTAP sectors is not perfect. There are no GCC countries in the GTAP database. A demand elasticity of -0.25 was applied to these countries and to the Rest of World. This approximation is not important for gas-related goods and raw materials, where GCC countries export to the developed countries, but is more important for chemicals and fish where GCC countries are net importers. 18 I would be desirable use country and sector specific estimates of supply elasticities, but the absence of such data precludes this. 26
tariffs of 6.4, 2.8 and 2.7 per cent are eliminated. Bahrain loses in the chemicals sector, where it competes with China in the US market.
Table 18 Impact of elimination of sectoral tariffs Change in Change in export revenue export revenue
Change in tariff revenue
Net welfare effects
%
$m
$m
$m
Chemicals Bahrain China Japan Kuwait Oman Qatar Saudi Arabia United Arab Emirates United States EU25 RoW
1.31 4.51 3.90 5.40 2.43 3.61 2.61 3.61 2.77 3.23 2.27
5 4,077 3,230 67 20 71 494 90 5,008 10,973 9,005
-12 -7,078 -796 -30 -24 -22 -237 -251 -2,566 -2,891 -17,079
-4 507 1,120 21 -9 32 162 -77 -217 4,109 -5,603
GCC
2.89
747
-576
124
9.68 6.88 6.22 -0.92 6.80 0.23 9.40 2.22 5.95 14.44 3.78
2 660 94 0 8 0 7 3 281 658 2292
0 -353 -510 -1 -1 0 -7 -2 -129 -966 -1779
1 294 -373 -2 4 0 -2 -2 -247 -190 531
GCC
5.55
20
-11
-1
Gas-related goods Bahrain China Japan Kuwait Oman Qatar Saudi Arabia United Arab Emirates United States EU25 RoW
3.27 2.48 1.82 5.32 2.33 1.71 3.43 3.24 1.54 5.40 0.96
63 198 130 661 110 237 610 519 363 2558 3522
-1 -1201 -184 -15 -16 -6 -52 -15 -2037 -400 -4395
42 -73 -547 431 61 157 392 337 -1118 766 -225
GCC
3.30
2201
-106
1419
Fish Bahrain China Japan Kuwait Oman Qatar Saudi Arabia United Arab Emirates United States EU25 RoW
27
Raw materials Bahrain China Japan Kuwait Oman Qatar Saudi Arabia United Arab Emirates United States EU25 RoW GCC
-0.56 2.28 4.42 0.31 9.00 -0.09 0.42 4.70 0.00 1.92 0.16
-2 410 319 6 451 -11 40 387 2 870 662
-4 -469 -8 -4 -12 -8 -71 -138 -28 -65 -1119
-1 -83 -198 25 19 17 84 18 -102 -158 392
1.10
870
-237
161
Source: GSIM simulations.
Developing country liberalization contributes a large share of the gains in GCC exports and welfare. A simulation involving tariff elimination in EU, USA and Japan only reduces GCC exports revenue gains by half in the chemicals and fisheries sectors, and more in the other sectors. The respective changes are for global and developed country tariff elimination are $747 ($320) million for chemicals, $20 ($9) million for fish, $2201 ($405) million for gas related products and $870 ($80) million for raw materials. Unfortunately, the analysis doesn‟t indicate which developing countries are important, and whether they are WTO members.
6. Harmonization of GCC bound rates GCC countries could harmonize their bound tariffs. One advantage could be to negotiate as one bloc, such as the European Union, with enhanced bargaining power. A bloc with harmonized tariffs could avoid situations where one country, such as Oman, negotiates a specific provision which is partly neutralized by commitments of other GCC members, in this case Qatar and United Arab Emirates. Furthermore, countries with low bound rates such as Saudi Arabia as a recently acceded member may in future rounds not benefit from specific provisions and may thus implicitly determine the possible applied rates as well as the policy space of the GCC. However, the impact of harmonization depends at what level new bound rates would be set. One way in which bound rates could be harmonized would be to take for each single product the lowest of all six country specific bound rates. For this, WTO members do not have to give their consent but tariffs would be bound at very low levels, 10.6 per cent on average (see table 19). This represents a significant reduction for most countries, especially Bahrain and Kuwait. A detailed list of country and product specific bound rates as well as minimum levels at the HS 6-digit level is attached.
28
Table 19 Average GCC bound tariffs compared with harmonization at minimum level Country
Bahrain Kuwait Oman Qatar Saudi Arabia United Arab Emirates
Average % 33.07 100.00 13.71 15.93 12.04 14.68
Average tariff at minimum per tariff line
10.60
Source: Authors‟ calculation based on WTI/ITC/UNCTAD World Tariff Profile data.
Binding all tariffs at the lowest level has the disadvantage that countries cannot make full use of the often existing exemptions where some tariffs receive lower cuts. If harmonization occurs at other than the minimum level, some bound tariffs would need to be raised. This requires consent of other WTO members. Bound tariffs can be renegotiated under GATT Article 28: Modification of Schedules. If a bound rate on a product in one country is increased, affected countries, i.e. suppliers of that product, need to be compensated by reducing other bound rates, i.e. not in monetary terms. However, the negotiations at the General Council on increasing bound rates are said to be difficult, although precedents exist. Countries having initial negotiating rights (INR) and principal suppliers, that is, a 9 per cent market share, need to be compensated, according to the following guidelines. "In such negotiations and agreement, which may include provision for compensatory adjustment with respect to other products, the contracting parties concerned shall endeavour to maintain a general level of reciprocal and mutually advantageous concessions not less favourable to trade than that provided for in this Agreement prior to such negotiations."
A critical question is whether compensation would have to be undertaken at the national level or collectively in which case countries with low bound rates may benefit from other GCC countries reducing their higher rates.
7. Implications for governments and the private sector Trade liberalization is a two-edged sword. Most commonly, there are global gains, but individual countries and sectors may experience a fall in output, exports and welfare. In addition, even if applied rates are not affected, the flexibility to increase tariffs if considered necessary is reduced or lost. Even where there are national gains, there are inevitably significant distributional effects between sectors and between producers, consumers and taxpayers. Given these considerations, it is important for
29
individual countries to consider and back the most appropriate negotiating proposal. For GCC the remaining tariffs are very low or are on goods whose consumption is discouraged for cultural (pig meat) and health (tobacco) reasons. If GCC countries were obliged to reduce tariffs on these items to fulfill WTO commitments, they could impose a consumption tax rather than a tariff.19
In agriculture, GCC countries are likely to be disadvantaged by rising world prices of imported products following global liberalization. However, these estimated price rises are comparatively small compared with normal fluctuations, between five and ten per cent. Nevertheless, it would seem the GCC countries would fair better with a modest rather than ambitious Doha outcome in agriculture.
In the NAMA negotiations, the choice of coefficient makes little difference, as the gap between bound and applied tariffs is sufficiently great. The elimination of tariffs in the selected sectors also has only a limited effect, as the applied tariffs facing GCC exports are already quite low. Of the four sectors, gas-related goods, chemicals and raw materials provide the scope for export gains while the fish sector contributes little. There are losses in tariff revenue in all sectors. Although not specifically nominated for elimination of tariffs, the gas-related goods sector has the potential for significant gains should tariffs be reduced. This would benefit all GCC members. One caveat to note here is that the potential gains include additional exports to developing countries. These take a large share of GCC gas exports, and have tariffs that are higher than the world average. However, not all the developing countries are members of the WTO, and may not therefore be obliged to reduce their tariffs following a WTO negotiated agreement, or would not participate in sectoral initiatives.
The tariff revenue losses calculated for Saudi Arabia would not apply if that country exercised its right as a RAM not to reduce tariffs in further. However, if GCC countries want to maintain common external tariffs on those products covered by a sectoral agreement, losses would occur in all GCC countries if one or more members want to participate. A critical mass approach may also allow a free ride, in which case GCC countries could benefit from other countries reducing their tariffs without requiring GCC countries to reduce or eliminate its tariffs in corresponding sectors. Uncertainty with respect to sectorals in the negotiations is high.
The Swiss formula will have the effect of harmonizing bound tariffs in the GCC. Since GCC countries are members of a customs union, a reduction in a common external tariff in one country will require a similar reduction in others. This occurs because the members have diverse bound rates, with Saudi Arabia and Oman having low rates compared with Kuwait and Bahrain. The former countries have 19
These are equivalent if there is no domestic production. 30
negotiated special provisions in this round, with Saudi Arabia not required to make tariff reductions as a very RAM and Oman not required to make cuts below 5 per cent, the common external tariff for the bulk of the NAMA items in the customs union. The remaining four countries have sufficient binding overhang so their applied tariffs are not affected in most cases, and hence remain above the common external tariff. Where tariffs are affected, the new tariff is no lower than 4 per cent, marginally lower than the 5 per cent on many goods. However, percentage reductions are particularly high in NAMA, in the extreme case of Kuwait, for example, about 80 per cent, much more than the percentage reduction in developed countries. This is the result of the harmonizing Swiss formula, which reduces high tariffs disproportionately. The policy space to increase applied tariffs if the trade policy is changed or, for example, to protect infant industries or to raise tariff revenue at a later stage, is substantially reduced.
Limitations of the analysis should be noted. Apart from the usual data issues, such as estimation of elasticities, there are concerns about whether the Doha implementation would occur as envisaged in the scenarios. Liberalization exposes an incentive to raise non-tariffs barriers, such as SPS measures on agricultural imports. A rise in spurious anti-dumping measures can be expected. For these reasons, the impacts of liberalization may be overstated. On the other hand, there are likely to be a range of other non-tariff measures that, if removed, would lead to a greater increase in imports than the removal of tariff barriers considered here. In addition, some of the policy changes simulated may occur in the absence of a Doha outcome. The European Union has plans to reduce its sugar support, and there are several regional and bilateral preferential trading arrangements under discussion. Finally, by the time the tariff changes are implemented, many economies may have grown and changed in structure, with some sectors disappeared and replaced by others.
Not included here are linkages to other sectors and factors of production, such as land, labour and capital. This implies the impacts are overestimated because resources lost from a declining sector are nor redeployed elsewhere, while an expanding sector is assumed not to attract resources out of other industries. In the NAMA analysis in particular, data limitations prevent inclusion of intersectoral effects in the analysis. This tends to overstate the impacts, because cross-price elasticities are generally the opposite sign of own-price elasticities. This should be kept in mind when considering the implications of the empirical results. Nonetheless, the results provide a good indication of the sign and magnitude of the likely effects, as the main determinants are the tariff changes and trade flows. The modeling results are best used for comparing different scenarios rather than identifying the magnitude of the potential trade flows and welfare impacts.
31
References FAO (FAOSTAT) http://faostat.fao.org/ Francois, J. (2007) „An Extended Global Simulation Model: Analysis of Tariffs & Anti-Dumping Policy Impacts on Prices, Output, Incomes, and Employment‟, http://www.intereconomics.com/handbook/Models/Spreadsheet%20Models/GSIMv2_Apr2007. pdf. Francois, J.F. and H.K. Hall (1997), „Partial Equilibrium Modeling,‟ in J.F. Francois and K. Reinert, eds., Applied Methods for Trade Policy Analysis: A Handbook, Cambridge University Press: Cambridge. Peters, R. and Vanzetti, D. (2004), 'User Manual and Handbook on the Agricultural Trade Policy Simulation Model (ATPSM)', UNCTAD Policy Issues in International Trade and Commodities Study Series No. 24. UNCTAD (2008), „Evolution of the international trading system and of international trade from a development perspective‟, TD/B/55/4. WTO (2005) „Doha Work Programme Ministerial Declaration Adopted on 18 December‟ WT/MIN(05)/DEC, Geneva. http://www.wto.org/english/thewto_e/minist_e/min05_e/final_text_e.htm. WTO (2008a) 'Revised draft modalities for agriculture', TN/AG/W/4/Rev.4, Geneva, 6 December. http://www.wto.org/english/tratop_e/agric_e/agchairtxt_dec08_a_e.pdf. WTO (2008b) 'Fourth Revision of Draft Modalities For Non-Agricultural Market Access', TN/MA/W/103/Rev.3, Geneva, 6 December. .
32
Appendix GSIM GSIM is static, deterministic, single commodity bilateral trade model driven by export supply and bilateral import demand equations. 20 Exports and imports are a function of the world price plus or minus the relevant bilateral trade tax or subsidy. Because taxes are bilateral, and possibly different from country to country, the change in tariffs leads to a change in relative prices that drive differential changes in imports from various sources. This is essential where tariffs are reduced in some countries but not others. An elasticity of substitution determines the extent to which changes in relative prices lead to a switch in the source of imports. The model solves numerically to a specified tolerance using Excel's Solver to find a market clearing price such that global imports equals global exports.
The crux of the model is the import demand equations. Import demand in country v for commodity i from country r is a function of prices and total expenditure on the commodity: (1)
M(i,v),r = f(P(i,v),r ,P(i,v),s r , Y(i,v) )
where M(i,v),r is imports, P(i,v),r internal prices, P(i,v),s r external prices and Y(i,v) expenditure on imports i in country v.
The response of imports to changes in relative prices depends on an expenditure share weighted sum of the composite demand elasticity, Em, and the supply elasticity, Es: (2)
N(i,v),r,s = θ(i,v),s (Em + Es), and
(3)
N(i,v),r,r = θ(i,v),r Em - Σ sr θ(i,v),sEs = θ(i,v),r Em – (1-θ(i,v),r Es).
The price linkage equations relate internal prices to exports prices: (4)
P(i,v),r =(1-t(i,v),r)P*i,r = T(i,v),rP*i,r
where T = (1+t), the power of the tariff. Quotas, or outright bans, can be expressed as a tariff equivalent. On the export side, exports are a function of world prices: (5)
X(i,v),r = f(rP*i,r).
These equations are in levels. By differentiating the import, export and price equations, it is possible to obtain expressions for the change in imports and exports according to changes in tariffs and world prices: (6)
M´i,r
= Σ v M´ (i,v),r = Σ v N(i,v),r,r P´ (i,v),r+ Σ v Σ sr N(i,v),r,s P´ (i,v),s = Σ v N(i,v),r,r [P*r+T´ (i,v),r] + Σ v Σ sr N(i,v),r,s [P*´s+T´ (i,v),s].
33
The model is solved numerically by finding a set of prices such that the change in global imports (equation 6) equals the change in global exports (the derivative of equation 5).
Once we have solved for world prices, it is possible to work backwards to solve for export quantities and import quantities. Changes in government revenues are simply determined by the trade flows times the tariff rates. Producer and consumer surplus effects can then be determined from changes in prices and quantities: (7)
∆PSi,r = R0i,r P´ i,r +0.5 R0i,r P´ i,r Xi,r
where R0i,r is the initial export revenue. Consumer surplus is more complex because consumption is a composite of imports from different sources. (7)
∆CSi,r = (Σ v R0(i,v),r T0 (i,v),r ) * (0.5 Em(i,v) P´ i,v2 * sign (P´ i,v) - P´ i,v)
Where P´ i,v = Σ r θ(i,v),r P*´r + T´ (i,v),r. P´ i,v represents the price for composite imports, and R 0 T0 the initial expenditure. Total welfare is the sum of producer and consumer surplus and the change in government revenue.
Data required for the model are bilateral trade flows (in values), bilateral trade taxes, and elasticties of supply, demand and substitution between imports (the so-called Armington elasticities).
Limitations of the model include the (log) linear demand and supply relationship. Linearity implies that large shocks to the model may induce some errors in the size of the quantity changes. For example, it is reasonable to expect that as prices rise consumers become less responsive. A second limitation is the lack of substitution between products on the demand side, such as beef and pork. Empirically, the cross effects tend to be rather small, depending on how the commodities are defined. A further consideration is the absence of upstream and downstream linkages, between beef and processed meats for example. There is no storage in the model, nor time related effects or uncertainty. These limitations need to be kept in mind when interpreting the results.
34