Pakistan Journal of Meteorology
Vol. 14, Issue 27: Jul, 2017
Projected Changes in Mean Annual Rainfall Pattern Over West Africa during the Twenty First Century Ekwezuo, C. S.1, 2, H. C. Nnamchi2, 3, P. O. Phil-Eze2 Abstract This study analysed projected changes in mean annual rainfall pattern over West Africa during the early (2010-2035), mid (2040-2065) and late (2070-2095) twenty first century using the Norwegian Earth System Model version 1 (NorESM1-M) at ~1.89° X 2.5° horizontal atmospheric resolution. We evaluated the ability of the model to simulate the observed mean annual rainfall for the baseline (1980-2005), using satellite derived precipitation data from Global Precipitation Climatology Project (GPCP). Projected changes in mean annual rainfall for the twenty first century, were calculated relative to the base line period using three possible future levels of atmospheric greenhouse gases concentration referred to as Representative Concentration Pathways (RCPs) 2.6 Wm-2, 4.5 Wm-2 and 8.5 Wm-2. The result of the analysis shows that, the model generally reproduced the observed mean annual rainfall pattern with maximum and minimum rainfall of ~2600 mm and ~50 mm respectively. The projected changes in mean annual rainfall pattern show that rainfall amount increases over the Guinea coast and decreases inland. Also the mid twenty first century, is projected to experience more changes in rainfall pattern than the early and late twenty first periods, with RCP 4.5 projecting the highest level of change. It is anticipated that if the projected changes in mean annual rainfall pattern occur in the future, it may lead to stress on water dependent sensitive sectors in the region.
Key Words: West Africa, NorESM1-M, Annual Rainfall, Climate change, RCPs, twenty first century.
Introduction Global climate models are fundamental research tool for understanding and projecting future state of the Earth’s climate systems. This is because changes in climate may result to severe negative impacts on diverse key sectors of the economy globally and regionally. Understanding the observed and future state of climatic elements has led to the development of Earth system models (ESM) a type of General Circulation Model (GCM), which incorporates chemistry, biogeochemical e.t.c. feedbacks in the climate system to the mechanics of fluids and radiations represented in the traditional GCM (Heavens et al, 2013). In comparison to the former model generation, these ‘Earth System Models’ (ESMs) incorporate additional components describing the atmosphere’s interaction with land-use and vegetation, as well as taking into account atmospheric chemistry, aerosols and the carbon cycle (Taylor et al, 2012). The new model generation is driven by newly defined atmospheric composition forcings - the ‘historical forcing’ for present climate conditions and the ‘Representative Concentration Pathways’ (RCPs, Moss et al., 2010; Meinshausen et al., 2011) for future scenarios. In the tropics, rainfall is perhaps, the most important climatic variable: this is because of the dependence of several socio-economic activities on it. Rainfall, is one of the weather elements whose changes exert significant impact on the dependent population. Mean Annual Rainfall Pattern (MARP) characterises the long term quantity of water available to a region for hydrological and agricultural purposes. Under rainfed conditions, it gives an upper limit to a region's sustainable agricultural potential if other factors (light, temperature, topography, soils etc.) are held constant. Not only is MARP important, it is probably also that climatic variable best known to hydrologists and farmers (Schulze et al, 1997). Understanding changes in rainfall patterns resulting from anthropogenic emissions of greenhouse gases remains an important and continuing area of research, both for scientific reasons to better constrain expected changes to the global 1
[email protected] Department of Geography, University of Nigeria, Nsukka, 410001, Nigeria. 3 GEOMAR|Helmholtz Centre for Ocean Research Kiel, Germany. 2
1
Projected Changes in Mean Annual Rainfall Pattern Over West Africa during the Twenty First Century
Vol. 14
and regional hydrological cycle, and due to the immense societal implications of any shift in rainfall intensity or frequency (Intergovernmental Panel on Climate Change (IPCC) 2011; Trenberth, 2011). West Africa is one of the regions in the world vulnerable to the impacts of adverse effects of weather and climate variability (IPCC, 2013), and one of the regions with low adaptive capacity to observed changes in climate (Omotosho and Abiodun, 2007). Because of the importance of understanding changes in rainfall pattern, several studies have assessed past and future changes in rainfall based on climate model simulations at regional and global scales (Rodrigues et al, 2013; Vizy et al, 2013; Dike et al, 2015; Akinsanola et al, 2015; Akinsanola et al, 2017). They all assert that there will be changes in future rainfall characteristics due to climate change as a result of increase in greenhouse gases in the Earth’s climate system. More importantly, because of the importance of understanding climate models in climate change and projections, we analysed an Earth System Model(ESM) viz NorESM1-M. This model has been evaluated by Veldore, et al (2013), over the Indian Sub-continent and used to study the Indian summer monsoon. They suggested that the overall performance of the NorESM1-M is better over the tropical region and can be used for further assessments of spatial and temporal scales of tropical climate. As more key systems and processes are considered by ESMs, the results derived from them may be a little bit different from those of GCMs. Considering such improvements in the ESMs, it is instructive to investigate how the climate changes in rainfall pattern differ with the consideration of more systems and processes. Thus, we analysed the Norwegian Earth System Model (NorESM1-M), historical simulation of mean annual rainfall pattern and used it to determine projected changes in mean annual rainfall pattern over West Africa, during the twenty first century under possible future levels of greenhouse gases.
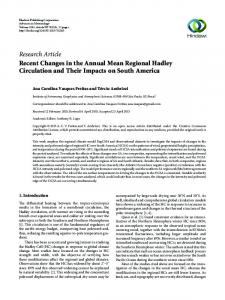
Data and Methodology Study Area The study area is West Africa; comprised of 16 countries namely Benin, Burkina Faso, Cameroun, Cote d’Ivoire, Gambia, Ghana, Guinea, Guinea-Bissau, Liberia, Mali, Mauritania, Niger, Nigeria, Senegal, Sierra Leone, and Togo (Figure 1).
Figure 1: The Study area (West Africa)
West Africa is located in the western part of Africa and covers a total land and water area of approximately 7,832,486 km2. The region is delineated here, using latitudes 2°N to 20°N of the Equator and longitudes 18°W to 15°E of the Greenwich Meridian. West Africa is bordered by the Atlantic Ocean to the south and west, Western Saharan, Algeria and Libya to the North, Chad and Central
2
Issue 27
Ekwezuo, C. S., H. C. Nnamchi, P. O. Phil-Eze
African Republic to the east. The region hosts a wide range of climates and ecosystems ranging from the rainy forest in the south to roughly desert conditions in the northern extremity. Data and Analysis This research analysed the version 1 of NorESM1-M. The model has a horizontal grid resolution of 1.875° x 2.500°and was taken from the archive of phase 5 of the coupled model intercomparison project (CMIP5) at http://cmip-pcmdi.llnl.gov/cmip5/. This model was developed at Norway Climate Centre, Norway in collaboration with researchers from the National Center for Atmospheric Research at the United States of America. The model is based on the Community Earth System Model version 1.0.3 (CESM1; Vertenstein et al., 2012), which is the predeccessor of the Community Climate System Model version 4 (CCSM4; Gent et al., 2011). We evaluated the NorESM1-M simulation using the Global Precipitation Climatology Project (GPCP) monthly precipitation analysis (Adler et al., 2003; Huffman, et al., 2009). GPCP is a globally comprehensive, monthly estimate of surface precipitation from satellite and has been validated by actual rain-guage measurements and used widely in most climate studies. It is available at 2.5° x 2.5° latitude-longitude global grids and spans the period 1979, to present. We analysed the historical period from 1980-2005, coinciding with the last years of available model simulation. This study, presents an assessment of mean annual rainfall pattern (MARP), over West Africa, for four periods; hereafter the “baseline” (1980–2005) “early twenty first century” (2010-2035), “mid twenty first century” (2040-2065) and “late twenty first century” (2070-2095), under three emission concentration scenarios, RCPs 2.6, 4.5 and 8.5 (Meinshausen et al. 2011). There is a 5 year gap between each period (the gap is to ensure we have a good reporting of the twenty-first century rainfall pattern). The RCPs are four greenhouse gas concentration trajectories adopted by the IPCC for its fifth Assessment Report (AR5), designed to sample a range of radiative forcing (RF) of the climate system at 2100, under certain socioeconomic assumptions. RCP 6.0 was not analysed, due to its similarity to RCP 4.5 and the number of mitigation scenarios leading to it is relatively low in literature. The ability of the model to reproduce the observed MARP is evaluated and the model bias (which indicates the systematic error in simulation of rainfall amount) was estimated using Eq. (1). 𝐵𝑖𝑎𝑠 = 𝑅𝑚𝑜𝑑𝑒𝑙 − 𝑅𝑜𝑏𝑠
…… (1)
Where, Rmodel is NorESM1-M simulated precipitation and Robs is GPCP precipitation and both are the annual means in mm. A value of zero indicates no systematic difference between simulated and observed MARP amounts whereas large bias indicates that the modelled rainfall amount largely deviates from the observed rainfall amount. Negative values indicate underestimation whereas positive value indicates overestimation.
Results and Discussion Rainfall Evaluation in the Baseline Period The GPCP-satellite derived mean annual rainfall distribution over West Africa for the baseline period of 1980-2005 is shown in Figure 2a. The domain (18°W-15°E, 4-20°N) average maximum and minimum annual rainfall is ~2500 mm and ~50 mm respectively. The mean annual total rainfall over West Africa is ~1,227.1 mm. The highest mean annual rainfall between ~1,200 and ~2,500 mm is received in the south-western extremity of West Africa in the Guinea and Fouta Djallon highland. Another band of rainfall maximum is observed in the south-eastern part of the region extending from the Mandara mountainous range down to the gulf of Guinea. Towards the north, rainfall amounts decline with latitude from ~1000 mm at latitude 12°N to ~100 mm at latitude 19°N. To a lesser extent, annual rainfall total is relatively low (~1000 mm) over a large area covering parts of the Ghana and Togo region often referred to as the Ghana-Togo gap (Acheampong, 1982). The mean annual
3
Projected Changes in Mean Annual Rainfall Pattern Over West Africa during the Twenty First Century
Vol. 14
distribution of rainfall in West Africa is generally zonal with the rainfall amount decreasing from coast to the hinterland (Gbobaniyi et al. 2013; Akinsanola et al. 2016, Ekwezuo, 2016, Nnamchi and Li, 2016, Akinsanola et al. 2017). The simulated pattern generally reproduces the observed pattern. Similar to the observations, the broad features of precipitation over West Africa such as the patterns of maximum and minimum annual rainfall and the Ghana-Togo gap was simulated by the model (Figure 2b). Nonetheless, there are some notable biases.
(a)
(b)
Figure 2: Mean annual rainfall pattern over West Africa for the baseline period (1980-2005). a) GPCP-observed and b) NorESM1-M-simulated
In order to quantify the model’s bias in simulating the observed mean annual pattern of rainfall over West Africa, we first interpolated the model output to the GPCP’s 2.5° X 2.5° grid resolution using bilinear remapping. As shown in Figure 3, large-scale dry biases are simulated around the south-western end and wet biases on the south-eastern part. There are also dry biases over parts of southern Nigeria (