losses incurred during harvesting, production and marketing can be minimized. With these ... simple digital imaging method for measuring and analyzing colour.
©2010 International Journal of Computer Applications (0975 – 8887) Volume 1 – No. 4
Prospects of Computer Vision Automated Grading and Sorting Systems in Agricultural and Food Products for Quality Evaluation Narendra V G Sr. Lecturer Dept. Of CSE, Manipal Institute Of Technology, Manipal, Karnataka, India-576 104
Hareesh K S Reader Dept. Of CSE, Manipal Institute Of Technology, Manipal, Karnataka, India-576 104
ABSTRACT The paper presents the recent development and application of image analysis and computer vision systems in sorting and grading of products in the field of agricultural and food. Basic concepts and technologies associated with computer vision, a tool used in image analysis and automated sorting and grading is highlighted. For the ever-increasing population, losses in handling and processing and the increased expectation of food products of high quality and safety standards, there is need for the growth of accurate, fast and objective quality determination of the characteristics of food and agricultural food products. Computer vision and image analysis, are non-destructive and cost-effective technique for sorting and grading of agricultural and food products during handling processes and commercial purposes. Different approaches based on image analysis and processing identified is related to variety of applications in agricultural and food products.
Keywords: Quality, Sorting and Grading, Automation, Image Processing, Machine Vision;
1. INTRODUCTION Technological advancement is gradually finding applications in the agricultural and food products, in response to one of the greatest challenges i.e. meeting the need of the growing population. Efforts are being geared up towards the replacement of human operator with automated systems, as human operations are inconsistent and less efficient. Automation means every action that is needed to control a process at optimum efficiency as controlled by a system that operates using instructions that have been programmed into it or response to some activities. Automated systems in most cases are faster and more precise. However, there are some basic infrastructures that must necessarily be in place in automation [1]. The technology of image analysis is relatively young and its origin can be traced back to the 1960s. It has experienced tremendous growth both in theory and in application. It has found application in areas such as medical diagnostics, automated manufacturing, aerial surveillance, remote sensing and very recently in the field of automated sorting and grading of agricultural and food products. Computer vision is a novel technology for acquiring and analyzing an image of a real scene by computers and other devices in order to obtain information or, to control machines or processes [47].
In Timmermans [51] opinion, computer vision system includes the capturing, processing and analyzing images to facilitate the objective and non-destructive assessment of visual quality characteristics in agricultural and food products. The techniques used in image analysis include image acquisition, image preprocessing and image interpretation, leading to quantification and classification of images and objects of interest within images. Harvesting and packing account for the major portion of the effort and cost incurred by farmers producing fresh fruits and vegetables to market. However the processing and manufacturing sectors require product sorting and grading for commercial and production purposes. There is continuous growth in the development of mechanical harvesting system, and the need for automated inspection, as well as grading systems so that the losses incurred during harvesting, production and marketing can be minimized. With these, the need arises to not only grow and harvest a quality crop, but also to pack in a consistent and acceptable manner to gain or to maintain market shareas well as prepare materials, which suits processing operations. These cannot be achieved without sorting and grading.assisted sorting and grading of an agricultural and food products is accomplished based on appearance, texture, colour, shape and sizes. Manual sorting and grading are based on traditional visual quality inspection performed by human operators, which is tedious, time-consuming, slow and non-consistent. A cost effective, consistent, superior speed and accurate sorting can be achieved with machine vision sorting and grading. Automated sorting and grading had undergone substantial growth in the field of agricultural and food, in the developed and developing nations because of availability of infrastructures. Computer application in agriculture and food industries have been applied in the areas of sorting, grading of fresh products, detection of defects such as cracks, dark spots and bruises on fresh fruits and seeds. The new technologies of image analysis and machine vision have not been fully explored in the development of automated machine in agricultural and food industries. There is increasing evidence that machine vision is being adopted at commercial level [22].The method used by the farmers and distributors to sort and grade agricultural and food products are through traditional quality inspection and handpicking which is time-consuming, laborious and less efficient. Sun et al. [48] observed that the basis of quality assessment is often subjective with attributes such as appearance,
1
©2010 International Journal of Computer Applications (0975 – 8887) Volume 1 – No. 4 smell, colour, texture and flavor frequently examined by human inspectors. Francis [13] found that human perception could easily be fooled. It is pertinent to explore the possibilities of adopting faster systems, which will save time and more accurate in sorting and grading of agricultural and food products. One of such reliable method is the automated computer vision system for sorting and grading.
Advances in computer technology have produced a surge of interest in image analysis during the last decade and the potential of this technique for the guidance or control of agricultural and food processes have been recognized [37]. Series of studies have been conducted in recent years to investigate the application of computer vision technology to sorting and grading of fresh agricultural and food products. Yam and Spyridon [60] used a simple digital imaging method for measuring and analyzing colour of food surfaces and found that the method allows measurements and analysis of the colour of food surfaces that are adequate for food engineering research. Payne and Shearer [33] developed a machine vision algorithm for grading of fresh market produce according to colour and damage while Alchanatis et al [3], used a neural network based classifier and colour machine vision instead of the conventional use of black and white cameras and geometric features for automatic classification of tissue culture segments of potato plantlets. It was found that instead of using only geometric features combining it with colour significantly increased the separability of the classes in the feature space. Real time detection of defects in fruits using a general hardware and image processing techniques was reported by Delwiche and Crowe [9]. Two fruits (apples and peaches) were tested at the rate of five fruits/second to evaluate system performance. They developed an algorithm to acquire and analyze two combined near infrared (NIR) images of each fruit in real time with a pipeline image processing system. Their result showed that the system was capable of executing the sorting algorithm at a rate of 14 fruits/second, which was greater than conventional fruit conveying rates. In this submission, it was observed that acquiring more than 2 images per fruit and using more than 6 lines of structured illumination per fruit would reduce the sorting errors slightly in the case of the apples and greatly improve the system performance with peaches. Algorithms were developed by Panigrahi and Misra [32] to measure fractal-based feature and dimensions (length, width, area and perimeter) of ear corn images to discriminate among various shapes. The analysis showed that the combination of the feature is able to discriminate the shape differences while Carrion et al [8] described sorting based on an unsupervised vision system. Raji [36] developed an algorithm for determining the area of 2dimensional objects by image analysis. This can be adapted in detection of leave type as a form of sorting to select the desired ones during harvesting. The discrimination of leave from weed using feature identification by analysis was investigated and reported by Tsheko [53]. Bull [7] observed the image capture techniques, which could be or are being used in the field of the agricultural and food, to generate image that can be analyzed and used as feedbacks for an automated systems. The appropriate technique to be adopted by each industry would depend on the property of the sample to be monitored, the
nature of the sample, its environments and other practical restrictions such as imaging time. With increased awareness and sophistication on the part of the consumers and the expectation for improved quality in consumer agricultural and food products which has increased the need for enhanced quality monitoring in field of agricultural and food, there is a need to develop various techniques of image analysis to meet the demand of the growing population. Quality is the sum of these attributes that can lead to the production of products acceptable to the consumer when they are combined. In the food industries in developing countries, there is growing need for automation due to the fact that the labour intensive manual processes are not efficient, accurate and effective. In the developed countries on the other hand Gunasekaran [14] observed that the food industry is now ranked among the top 10 industries using this technology. This study therefore sets out to review the state and level of application of image processing and machine vision in automated sorting and grading with its application and steps to be taken in improving and developing the emerging technology beyond its present state to agricultural and food products sorting and grading.
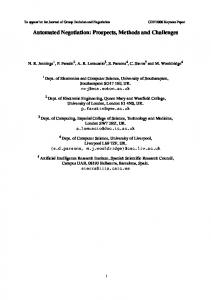
2. TECHNIQUES IN IMAGE PROCESSING 2.1. Equipment and Techniques A computer vision system consists of two basic components which are image acquisition: illumination and image capture device (camera) and image analysis: an image capture board (frame grabber or digitizer) and analysis software. A typical laboratory set for image processing is as shown in Figure 1.
Figure 1: Components of a computer vision system [56].
2.2. Computer Vision System The hardware configuration of computer-based Computer vision systems is relatively standard. Typically, a computer vision system consists of: • An illumination device, which illuminates the sample under test • A solid-state CCD array camera, to acquire an image • A frame-grabber, to perform the A/D (analog-to-digital) conversion of scan lines into picture elements or pixels digitized in a N row by M column image
2
©2010 International Journal of Computer Applications (0975 – 8887) Volume 1 – No. 4 • A personal computer or microprocessor system, to provide disk storage of images and computational capability with vendorsupplied software and specific application programs • A high-resolution colour monitor, which aids in visualizing images and the effects of various image analysis routines.
3. IMAGE ACQUISITION 3.1. Illumination Computer Vision Systems are affected by the level and quality of illumination as with the human eye. The performance of the illumination system greatly influences the quality of image and plays an important role in the overall efficiency and accuracy of the system. Illumination systems are the light sources. The light focuses on the materials (especially when used). Lighting type, location and colour quality play an important role in bringing out a clear image of the object. Lighting arrangements are grouped into front- or back-lighting [15]. Front lighting serve as illumination focusing on the object for better detection of external surface features of the product while back-lighting is used for enhancing the background of the object. Light sources used include incandescent lamps, fluorescent lamps, lasers, X-ray tubes and infra-red lamps.
3.2. Image Acquisition Image capturing devices or sensors are used to view and generate images of the samples. Some of the devices or sensors used in generating images include scanners, ultrasound, X-ray and near infrared spectroscopy. However, in machine vision, image sensors used are the solid state charged coupled device (CCD) (i.e. camera) technology with some applications using thermionic tube devices. Recent technology has seen the adoption of digital camera, which eliminates the additional component required to convert images taken by photographic and CCD cameras or other sensors to readable format by computer processors. Images captured or taken by digital camera maintain the features of the images with little noise due to its variable resolution.
4. IMAGE PRE-PROCESSING This refers to the initial processing of the raw image. The images captured or taken are transferred onto a computer and are converted to digital images. Digital images though displayed on the screen as pictures, are digits, which are readable by the computer and are converted to tiny dots or picture elements representing the real objects. In some cases preprocessing is done to improve the image quality by suppressing undesired distortions referred to as “noise” or by the enhancement of important features of interest. The images or pictures are transformed into computer digital readable format (i.e. digitized) if a digital camera did not take them by the image board digitizer. The digitized format is then transferred and used as the input data by the image processing software to carry out the necessary processes. Each or a combination of the digits represent the feature a small portion of the image called picture element (pixel). Objects are described as black and white pictures which are represented by digits ranging from 0 to 255 where 0 is black and 255 is white. Each pixel in coloured pictures is represented by 3 digits representing RGB [Red, Green, Blue] components with each being
(0 to 255) darkest to lightest RGB. An arrangement of these digits in row-column format gives a representation of the image. With this arrangement using the matrix theory does the analysis in image processing. Further details can be obtained in Tsheko [53], Raji [36], Raji et al [37] and any text or reports on image processing and computer machine vision.
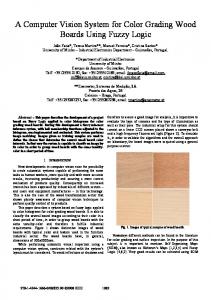
Figure 2: Different levels in the image processing [43]. Image acquisition and image pre-processing are categorized as low-level processing while the intermediate and the high level processing stages as classified by Sun [43] (Figure 2) are further processing stages required when integrating the preprocessing stages into an application device such as a sorter and grader. The intermediate-level processing involves image segmentation, image representation and image description. Image segmentation is a process of cutting, adding and feature analysis of images aimed at dividing an image into regions that have a strong correlation with objects or areas of interest using the principle of matrix analysis. Segmentation can be achieved by the following techniques: thresholding, edge based segmentation and region based segmentation. Thresholding is used in characterizing image regions based on constant reflectivity or light absorption of their surface. This shows that regions with same features are characterized and extracted together. Figure 3 shows a thresholding process where only the dark region is of interest, the other regions are converted to the background colour in the threshed image before further processing such as sending signals to a device to take a feature based decision. This process is useful in colour (maturity) and feature based (defect and damages detection) sorting.
Original Image Threshold image Figure 3. Thresholding Edge based segmentation relies on detection by edge-toedge operators, which detect discontinuities in grey level,
3
©2010 International Journal of Computer Applications (0975 – 8887) Volume 1 – No. 4 the pixel, colour, texture etc. Edge detection is useful in shape and size sorting. An example of edge detection result is shown in Figure 4. The application of this process was reported by Raji et al [37] who demonstrated the detection of defects in the shape of bread and biscuit samples on a processing line.
Figure 4: Edge based segmentation
Region based segmentation involves the grouping together and extraction of similar pixels to form regions representing single objects within the image. (Figures 5). In this process the other regions are deleted leaving only the feature of interest. High level processing deals with recognition and interpretation, typically using statistical classifiers or multiplayer neural networks of region of interest. These steps provide information necessary for the process or machine control for quality sorting and grading.
Figure 5. Region based segmentation An interaction of all these levels and knowledge database are very important and essential for more precise decision-making and is seen as an integral part of the image processing process. These theories when applied to images of products taken can be used to extract features, which are needed for the necessary processes. Generally, edge detection to determine shape and feature extraction to determine differences in colour is useful in sorting and harvesting.
5. APPLICATIONS IN AGRICULTURAL AND FOOD PROCESSING OPERATIONS Computer vision systems are being used increasingly in the field of agricultural and food products for quality assurance purpose. The system offers the generation of precise descriptive data and reduction of tedious human involvement. Computer vision system has proven successful for the objective, online measurement of several agricultural and food products with application ranging from routine inspection to the computer vision system guided robotic control [48]. Some of the areas where the techniques have been applied in agricultural and food processing which need to be developed further for commercial purposes include.
5.1 Bakery Products Appearance of baked products is an important quality attribute which influences the visual perceptions of customers and hence potential demands of the products. The appearance of the internal and external features contributes to the overall impression of the products quality. Computer vision system has been used to measure characteristics such as colour, size and shape with a view to sorting them to products with same characteristics before packing. Raji et al [37] developed a programme in FORTRAN using the principle of edge detection in image analysis to determine the edge of sliced breads and biscuits (round and rectangular) with a view to detecting defects (breakage). Scott [41] described a system, which measures the defects in baked loaves of bread, by analyzing its weight and slope of the top. The internal structure (crumb grain) of bread and cake was also examined by machine vision [40]. Dos Mohammed et al [10] also developed a system for the automated visual inspection of muffins. Visual features such as colour and size indicate the quality of many prepared consumer foods. Sun [43] investigated this in research on pizza in which pizza topping percentage and distribution were extracted from pizza images. Combining three algorithms used to segment many different types of pizzas as the traditional segmentation techniques were found to be inadequate for this application developed a new segmentation algorithm. It was found that the new region-based segmentation technique could effectively group pixels of the same topping together. As the result, topping exposure percentage can be easily determined. The study reported that the accuracy of measuring the topping percentage by the new algorithm reached 90%. The evaluation of the functional properties of cheese is assessed to ensure the necessary quality is achieved, especially for specialized applications such as consumer food toppings or ingredients. Wang and Sun [55] developed a computer vision method to evaluate the melting and browning of cheese. This novel non-contact method was employed to analyze the characteristics of cheddar and mozzarella cheeses during cooking and the results showed that the method provided an objective and easy approach for analyzing cheese functional properties [56,57]. Ni and Gunasekaran [29] developed an image-processing algorithm to recognize individual cheese shred and automatically measure the shred length. It was found that the algorithm recognized shreds well, even when they were overlapping. It was also reported that the shred length measurement errors were as low as 0.2% with a high of 10% in the worst case. The application of this method is therefore a promising approach to solving quality control inspection in the bakery products. This will improve the quality of baked products, where there are no standard sizes, shape and texture. The required system though may add to the cost of production but the added advantage will far outweigh the initial cost involved.
5.2. Fruits External qualities i.e. sizes, shapes and colour are considered of paramount importance in the marketing and sale of fruit. Presence of blemishes influences consumer perceptions and therefore determines the level of
4
©2010 International Journal of Computer Applications (0975 – 8887) Volume 1 – No. 4 acceptability prior to purchase. Computer vision system has been used for the automated inspection and grading of fruit to increase product throughput. The number of fruits (ripe and unripe) on a tree has been counted by image analysis prior to harvesting. This process involved the development of fruit location algorithms [24]. Images were taken from a distance of about 150cm and all the fruit on the tree placed within the vision field of a camera were counted. The visible fruits were considered to be those that the human eye can distinguish on the monitor. Algorithms based on the red/green relation and on threshold achieved the highest detection percentages on citrus fruit. The adoption can also be extended to the peasants through tractor hiring bodies or by forming cooperatives to acquire such devices, which only need to be attached to a tractor. The problem of unplanned fruit trees, which may make machine movement very difficult, will also need to be addressed. The high losses incurred presently on fruits in the market comes as a result of the damages and bruises as well as potential damage region inflicted on the fruits falling from the trees due to the method of harvesting of shaking the trees or the branches. The adoption can also be extended to the peasants through tractor hiring bodies or by forming cooperatives to acquire such devices, which only need to be attached to a tractor. The problem of unplanned fruit trees, which may make machine movement very difficult, will also need to be addressed. The high losses incurred presently on fruits in the market comes as a result of the damages and bruises as well as potential damage region inflicted on the fruits falling from the trees due to the method of harvesting of shaking the trees or the branches. Strawberry appearance and fruit quality are dependent on a number of pre- and post- harvest factors, hence variation occurs, necessitating the need for sorting. Nagata et al. [26] investigated the use of computer vision to sort fresh strawberries, based on size and shape. The experimental results show that the developed system was able to sort the 600 strawberries tested with an accuracy of 94-98% into three grades based on shape and five grades on size. Another automatic strawberry sorting system was developed by Bato et al. [6]. Average shape and size accuracies of 98 and 100%, respectively, were obtained regardless of the fruit orientation angle with judgement time within 1.18 s. Prior to export, papayas are subjected to inspection for the purpose of quality control and grading. For size grading, the fruit is weighted manually hence the practice is tedious, time consuming and labour intensive. Therefore, a computer vision system for papaya size grading using shape characteristic analysis. The shape characteristics consisting of area, mean diameter and perimeter were extracted from the papaya images. Slamet Riyadi et al. [43] classified according to combinations of the three features to study the uniqueness of the extracted features. The proposed technique showed the ability to perform papaya size classification with more than 94% accuracy.
5.3. Vegetables The need to be responsive to market demands places a greater emphasis on quality assessment resulting in the greater need for improved and more accurate grading and sorting practices. Computer vision system has shown to be a viable means of meeting these increased requirements for the vegetables field.
Plantlet segments of potato were subcultures for classification by colour machine vision system by Alchanatis et al., [3]. In related development, two algorithms were developed for analyzing digital binary images and estimating the location of stem root joints in processing carrots [5]. Both algorithms were capable of estimating the stem/root location with a standard deviation of 5mm. Also Haworth and Searcy [17] classified carrots on surface defects, curvature and brokenness. A line scans images with discrete Fourier transform was developed for the classification of broccoli heads for assessing its maturity. For the 160 observations from each of three broccolis cultivates, an accuracy of 85% was achieved for multiple cultivars. Mushrooms’ discolouration is undesirable in mushroom houses and it reduces market value. The colour and shape of the cap is the most important consideration of fresh mushrooms. Felfodi and Vizhanyo [11] used mushroom images recorded by a machine vision system to recognize and identify discolouration caused by bacterial disease. The method identified all the diseased spot as ‘diseased’ and none of the healthy mushrooms parts were detected as ‘diseased’. Reed et al [38] used camera-based technology to select mushroom by size for picking by a mushroom harvester. Potatoes have many possible shapes, which need to be graded for sale into uniform classes for different markets. This created difficulties for shape separation. A Fourier analysis based shape separation method for grading of potatoes using machine vision for automated inspection was developed by Tao et al. [50]. A shape separator based on harmonics of the transform was defined. Its accuracy of separation was 89% for 120 potato samples, in agreement with manual grading. Earlier, Lefebvre et al. [19] studied the use of computer vision for locating the position of pulp extraction automatically for the purpose of further analysis on the extracted sample. An image acquisition system was also constructed for mounting on a sweet potato harvester for the purpose of yield and grade monitoring [58]. It was found that culls were differentiated from saleable sweet potatoes with classification rates as high as 84%. Chilli is a variety grown extensively consumed by almost all the population. It has a high processing demand and proper sorting is required before filling or canning. A sorter that, Federico Hahn [12] classifies chilli by three different width sizes was built. The conveyor used baby suckers to align each chilli during sensing. Chilli width was determined by means of a photodiode scanner, which detected the incoming radiation sent by a laser line generator. Chilies presenting necrosis were detected with a radiometer and removed to increase product quality. Horizontal and vertical widths were measured for 200 chilies. The accuracy on the necrosis detection and width classification was of 96.3 and 87%, respectively. On-line necrosis measurements were 85% accurate when only the relative reflectance at 550nm was used. Vegetable quality is frequently referred to size, shape, mass, firmness, colour and bruises from which fruits can be classified and sorted. However, technological by small and middle producers implementation to assess this quality is unfeasible, due to high costs of software, equipment as well as operational costs. Based on these considerations, the Antonio Carlos Loureiro Lino et al. [4] research is to evaluate a new open software that enables the classification system by recognizing fruit shape,
5
©2010 International Journal of Computer Applications (0975 – 8887) Volume 1 – No. 4 volume, colour and possibly bruises at a unique glance. The software named ImageJ, compatible with Windows, Linux and MAC/OS, is quite popular in medical research and practices, and offers algorithms to obtain the above-mentioned parameters. The software allows calculation of volume, area, averages, border detection, image improvement and morphological operations in a variety of image archive formats. Some other earlier studies of computer vision associated with vegetable grading and inspection include colour and defect sorting of bell peppers [42]. Morrow et al. [25] presented the techniques of vision inspection of mushrooms, apples and potatoes for size, shape and colour. The use of computer vision for the location of stem/root joint in carrot has also been assessed [5]. Feature extraction and pattern recognition techniques were developed by Howarth and Searcy [17] to characterize and classify carrots for forking, surface defects, curvature and brokenness. The rate of misclassification was reported to be below 15% for the 250 samples examined. More recently sweet onions were line scanned for internal defects using X-ray imaging [52]. An overall accuracy of 90% was achieved when spatial and transform features were evaluated for product classification. Image analysis and machine vision in general from the foregoing can be said to offer a fast and reliable process in product sorting and grading, separation and detection of some other facilities.
5.4. Grains Grain quality attributes are very important for all users and especially the milling and baking industries. Computer vision has been used in grain quality inspection for many years. An early study by Zayas et al. [61] used machine vision to identify different varieties of wheat and to discriminate wheat from non-wheat components. In later research Zayas et al. [62] found that wheat classification methods could be improved by combining morphometry (computer vision analysis) and hardness analysis. Hard and soft recognition rates of 94% were achieved for the seventeen varieties examined. Twenty-three morphological features were used for the discriminant analysis of different cereal grains using machine vision [23]. Classification accuracies of 98, 91, 97,100 and 91% were recorded for CWRS (Canada Western Red Spring) wheat, CWAD (Canada Western Amber Durum) wheat, barley, oats and rye, respectively. 25 kernels per image were captured from a total of 6000 for each grain type examined.The relationship between colour and texture features of wheat samples to scab infection rate was studied using a neural network method [39]. It was found that the infection rates estimated by the system followed the actual ones with a correlation coefficient of 0.97 with human panel assessment and maximum and mean absolute errors of 5 and 2%, respectively. In this study machine vision-neural network based technique proved superior to the human panel. Image analysis has also been used to classify dockage components for CWRS (Canada Western Red Spring) wheat and other cereals [27]. Morphology, colour and morphology-colour models were evaluated for classifying the dockage components. Mean accuracies of 89 and 96% for the morphology model and 71 and 75% for the colour model were achieved when tested on the test and training data sets, respectively. Overall 6000 kernels for each grain type were analyzed. Machine vision was used to identify weeds commonly found in wheat fields in experimentation by Zhang and
Chaisattapagon [63]. Five shape parameters were used in leaf shape studies and were found effective in distinguishing broadleaf weed species such as pigweed, thistle and kochia from wheat. In order to preserve corn quality it is important to obtain physical properties and assess mechanical damage so as to design optimum handling and storage equipment. Measurements of kernel length, width and projected area independent of kernel orientation have been performed using machine vision [30]. The algorithm accuracy was between 0.86 and 0.89 measured by the correlation coefficient between predicted results and actual sieving for a 500 g sample. The processing time of the sizegrading program was reported as being between 0.66 and 0.74 s per kernel. Steenhoek and Precetti [46] performed a study to evaluate the concept of two-dimensional image analysis for classification of maize kernels according to size category. A total of 320 maize kernels were categorized into one of 16 size categories based on degree of roundness and flatness. Classification accuracy of both machine vision and screen systems was above 96% for round-hole analysis. However, sizing accuracy for flatness was less than 80%. Ng et al. [28] developed a machine vision algorithm for corn kernel mechanical and mould damage measurement, which demonstrated a standard deviation less than 5% of the mean value of the 250 grains examined. They found that this method was more consistent than other methods available. The automatic inspection of 600 corn kernels was also performed by Ni et al. [31] using machine vision. For whole and broken kernel identification on-line tests had successful classification rates of 91 and 94% for whole and broken kernels, respectively. The whiteness of corn has been measured by an on-line computer vision approach by Liu and Paulsen [20]. For the 63 samples (5080 kernels per sample) tested the technique was found to be easy to perform with a speed of 3 kernels per s. In other studies Xie and Paulsen [59] used machine vision to detect and quantify tetrazolium staining in corn kernels. The tetrazolium-machine vision algorithm was used to predict heat damage in corn due to drying air temperature and initial moisture content. As rice is one of the leading food crops of the world its quality evaluation is of importance to ensure it remains appealing to consumers. Liu et al. [20] developed a digital image analysis method for measuring the degree of milling of rice. They compared the method with conventional chemical analysis and obtained a coefficient of determination of R2 =/0.9819 for the 680 samples tested. Wan et al. [54] employed three online classification methods for rice quality inspection:-namely range selection, neural network and hybrid algorithms. The highest recorded online classification accuracy was around 91% at a rate of over 1200 kernels/min. The range selection method achieved this accuracy but required time-consuming and complicated adjustment. In another study, milled rice from a laboratory mill and a commercial-scale mill was evaluated for head rice yield and percentage whole kernels, using a shaker table and a machinevision system called the GrainCheck [21].
6. 3-D technique In general, only 2-dimensional (2D) data are needed for grading, classification, and analysis of most agricultural images. However, in many applications 3-dimensional
6
©2010 International Journal of Computer Applications (0975 – 8887) Volume 1 – No. 4 image analysis maybe needed as information on structure or added detail is required. A 3-D vision technique has been developed to derive a geometric description from a series of 2-D images [44]. In practice this technique might be useful for food inspection. For example, when studying the shape features of a piece of bakery, it is necessary to take 2-D images vertically and horizontally to obtain its roundness and thickness, respectively. Kanali et al. [18] investigated the feasibility of using a charge simulation method (CSM) algorithm to process primary image features for three dimensional shape recognition. The required features were transferred to a retinamodel identical to the prototype artificial retina and were compressed using the CSM by computing output signals at work cells located in the retina. An overall classification rate of 94% was obtained when the prototype artificial retina discriminated between distinct shapes of oranges for the 100 data sets tested. Gunasekaran and Ding [16] obtained 3D images of fat globules in cheddar cheese from 2-D images. This enabled the in situ 3-D evaluation of fat globule characteristics so as the process parameters and fat levels may be changed to achieve the required textural qualities.
7. PROBLEMS OF AUTOMATED SORTING AND GRADING The major problem of automated sorting and grading is one of socio-economic effects, which tend to reduce employment when the number of operators required in the processing line is reduced. It is not suitable in processes where manual skill is necessary or economically more attractive. It requires higher initial and maintenance cost and there may be the need for a precise understanding of the process for programming to achieve the required product quality Equipment associated problem involves radiance on accurate sensors to precisely measure process condition and the increased risk, delays and cost if the automatic system fails. The farm layout and very low production level which may make it uneconomically viable has also been highlighted.
8. PROSPECTS OF SORTING AND GRADING
AUTOMATED
The adoption of this emerging technology by first putting more effort into researches on the appropriate methods and ways of application will be of immense benefit to this country. Some of the other associated benefits include increased production rates (e.g. through optimization of equipment utilization), more efficient operation, production of more consistent product quality, greater product stability and safety. With the above in mind, the fruit and vegetable processing and marketing industries stand to gain from this emerging technology. This is because the losses incurred during the harvesting season on fruit are enormous. This results from large number of products to be handled and sold at the same time. These products consist of ripe and unripe fruits. The introduction of automated sorting and grading will encourage the sorting of the unripe (which can be kept for a relatively longer period) from the ripe, which are to be sold immediately. Presently the practice at the fruit market in to sell baskets of fruits containing both ripe and unripe. These products are found to get spoilt before they get to the final destination.
One of the major hindrances to the introduction of this technique is the level of production, which remains at the peasant level. Most of the products found in the markets are owned by a number of individuals with each controlling not more than 4 to 5 baskets, which will be too small for the adoption of an automated technique. However, encouraging wholesalers and retailers for groups and cooperatives in marketing as practiced in the village level for maize shelling will be a way out. The adaptation of computer vision system for quality evaluation of processed foods is the area for the greatest potential uptake of this technology, as analysis can be based on a standard requirement in already automated controlled conditions. More complex systems are needed for the automated grading and sorting of fresh produce because of the greater range in variability of quality and also as produce orientation may influence results. With the idea of precision and more environmental friendly agriculture becoming more realistic the potential for computer vision system in this area is immense with the need in field crop monitoring, assessment and guidance systems. However, techniques such as 3D and colour vision will ensure computer vision development continues to meet the accuracy and quality requirements needed in this highly competitive and changing industry.
9.CONCLUSIONS The paper presents the recent developments in computer vision system in the field of agricultural and food products. Computer vision systems have been used increasingly in industry for inspection and evaluation purposes as they can provide rapid, economic, hygienic, consistent and objective assessment. However, difficulties still exist, evident from the relatively slow commercial uptake of computer vision technology in all sectors. Even though adequately efficient and accurate algorithms have been produced, processing speeds still fail to meet modern manufacturing requirements. With few exceptions, research in this field has dealt with trials on a laboratory scales thus the area of mechatronics has been neglected, and hence it needs more focused and detailed study.
REFERENCES [1].A. Raji and A. Alamutu, “Prospects of Computer Vision Automated Sorting Systems in Agricultural Process Operations in Nigeria”, Agricultural Engineering International: the CIGR Journal of Scientific Research and Development, Vol. VII, Invited Overview, February 2005. [2].Ahmada, U., Kondo, N., Montaa, M., and H. Muraseh, “Machine Vision Based Quality Evaluation of Iyokan Orange Fruit using Neural Networks”, Computers and Electronics in Agriculture, 29(1-2), pp.135-147, 2000. [3].Alchanatis V., Peleg, K., and M. Ziv, “Classification of Tissue Culture Segments by Colour Machine Vision”, Journal of Agricultural Engineering Research, 55, pp. 299-311,1993. [4].Antonio Carlos Loureiro Lino; Juliana Sanches; Inacio Maria Dal Fabbro, “Image processing techniques for lemons and tomatoes classification”, Journal of Food and Engineering, 83(4), pp. 433–440, 2008. [5].Batchelor, M.M., and S.W. Searcy, “Computer Vision Determination of Stem/Root Joint on Processing Carrots”, Journal of Agricultural Engineering Research, 43, pp. 259-269, 1989.
7
©2010 International Journal of Computer Applications (0975 – 8887) Volume 1 – No. 4 [6].Bato, P.M., Nagata, M., Cao, Q.X., Hiyoshi, K., Kitahara, T., ”Study on sorting system for strawberry using machine vision (part 2): development of sorting system with direction and judgement functions for strawberry (Akihime variety)”, Journal of the Japanese Society of Agricultural Machinery, 62(2), pp. 101-110, 2000. [7].Bull, C.R., “A Review of Sensing Techniques which could be used to Generate Images of Agricultural and Food Materials”, Computers and Electronics in Agriculture, 8, pp. 1-29, 1992. [8].Carrion, J.A., Torregrosa, E.O., and E. Molto, “First Result of an Automatic Citrus Sorting Machine Based on an Unsupervised Vision System”, Proceedings of the InternationalConference on Agricultural Engineering, Oslo, August 1998. [9].Delwiche, M.J., and T.G. Crowe, “Real-Time Defect in FoodPart II: An Algorithm and Performance of a Prototype System”, Transactions of the ASAE, 39(6), pp. 2309-2317, 1996. [10].Dos Mohammed, A.M., Abdullah, Z.M., and A.S. Aziz, “Quality Inspection of Bakery Products using a Colour-Based Machine Vision System”, Journal of Food Quality, 23(1), pp. 3950, 2000. [11].Felfodi, J., and T. Vizhanyo, “Enhancing Colour Differences in Images of Diseased Mushrooms”, Computers and Electronics in Agriculture, 26, pp.187-198, 2000. [12].Federico Hahn,”Automatic Jalapeno Chilli Grading by Width”, Biosystems Engineering, 83(4), pp. 433–440, 2002. [13].Francis, F.J., “Colour Quality Evaluation of Horticultural crops”, HortScience, 15(1), pp. 14-15, 1980. [14].Gunasekaran, S., “Computer Vision Technology for Food Quality Assurance”, Trends in Food Science and Technolog, 7(8), pp. 245-256, 1996. [15].Gunasekaran, S., “Non-Destructive Food Evaluation Techniques to Analyze Properties and Quality”, Food Science and Technology Vol. 105, Marcel Decker, New York, 2001. [16].Gunasekaran, S., Ding, K., “Three-dimensional characteristics of fat globules in cheddar cheese”, Journal of Dairy Science 82, pp.1890-1896, 1999. [17].Howarth, M.S., and S.W. Searcy, “Inspection of Fresh Carrots by Machine Vision”, In Food Processing Automation II Proceedings of the 1992 ASAE Conference, St. Joseph, Michigan, USA, 1992. [18].Kanali, C., Murase, H., Honami, N., ”Three-dimensional shape recognition using a chargesimulation method to process image features”, Journal of Agricultural Engineering Research, 70, pp. 195-208, 1998. [19].Lefebvre, M., Gil, S., Brunet, D., Natonek, E., Baur, C., Gugeril, P., Pun, T., “Computer vision and agricultural robotics for disease control: the potato operation”, Computers and Electronics in Agriculture 9, pp. 85-102, 1993. [20].Liu, J., Paulsen, M.R., “Corn whiteness measurement and classification using machine vision”, In:1997 ASAE Annual International Meeting, Technical Papers, Paper No. 973045, ASAE, 2950 Niles Road, St. Joseph, MI 49085-9659, USA, 1997. [21].Lloyd, B.J., Cnossen, A.G., Siebenmorgen, T.J., “Evaluation of two methods for separating head rice from brokens for head rice yield determination”, In: 2000 ASAE Annual International Meeting, Paper No. 006074 ASAE, 2950 Niles Road, St. Joseph, MI 49085-9659, USA, 2000. [22].Locht, P., Thomas, K., and P. Mikkelsen, “Full Colour Image Analysis as a Tool for Quality Control and Process Development in the Food Industry”, In 1997 ASAE AnnualInternational Meeting, Paper No 973006, St. Joseph, Michigan, USA,1997.
[23].Majumdar, S., Jayas, D.S., Bulley, N.R., “Classification of cereal grains using machine vision, part 1: Morphological features”, In: 1997 ASAE Annual International Meeting Technical Papers, Paper No. 973101, ASAE, 2950 Niles Road, St. Joseph, MI 490859659, USA, 1997. [24].Molto, E., Pla, F., and F. Juste, “Vision Systems for the Location of Citrus Fruit in a Tree Canopy”, Journal of Agricultural Engineering Research, 52, pp. 101-110, 1992. [25].Morrow, C.T., Heinemann, P.H., Sommer, H.J., Tao, Y., Varghese, Z., “Automate inspection of potatoes, apples, and mushrooms”, In Proceedings of the International Advanced Robotics Programme, Avignon, France, pp. 179-188, 1990. [26].Nagata, M., Cao, Q., Bato, P.M., Shrestha, B.P., Kinoshita, O., “Basic study on strawberry sorting system in Japan”, In: 1997 ASAE Annual International Meeting Technical Papers, Paper No. 973095, ASAE, 2950 Niles Road, St. Joseph, Michigan 490859659, USA,1997. [27].Nair, M., Jayas, D.S., Bulley, N.R., “Dockage identification in wheat using machine vision”, 1997 ASAE Annual International Meeting Technical Papers, Paper No. 973043, ASAE, 2950 Niles Road, St. Joseph, Michigan 49085-9659, USA,1997. [28].Ng, H.F., Wilcke, W.F., Morey, R.V., Lang, J.P., “Machine vision evaluation of corn kernel mechanical and mould damage”, In: 1997 ASAE Annual International Meeting Technical Papers, Paper No. 973047, ASAE, 2950 Niles Road, St. Joseph, Michigan 4 9085-9659, USA, 1997. [29].Ni, H., Gunasekaran, S., “A computer vision system for determining quality of cheese shreds”, In: Food Processing Automation IV Proceedings of the FPAC Conference. ASAE, 2950 Niles Road, St. Joseph, Michigan 49085-9659, USA, 1995. [30].Ni, B., Paulsen, M.R., Reid, J.F., “Size grading of corn kernels with machine vision”, In: 1997 ASAE Annual International Meeting Technical Papers, Paper No. 973046, ASAE, 2950 Niles Road, St.Joseph, Michigan 49085-9659, USA, 1997a. [31].Ni, B., Paulsen, M.R., Liao, K., Reid, J.F., “Design of an automated corn kernel inspection system for machine vision”, Transactions of the ASAE, 40(2), pp. 491-497, 1997b. [32].Panigrahi, S., and M.K. Misra, “Feature Extraction Techniques for Corn Germplasm by Colour Computer Vision”, In 1990 ASAE International Summer Meeting, paper No 90-7050, St. Joseph, Michigan, USA ,1990. [33].Payne, F.A., and S.A. Shearer, “Colour and Defect Sorting of Bell Peppers using Machine Vision”, Transactions of the ASAE, 33(6), pp.2045-2050, 1990. [34].Pearson, T., and N. Toyofuku, “Automated Sorting of Pistachio Nuts with Closed Shells”, Applied Engineering in Agriculture, 16(1), pp.91-94, 2000. [35].Qui, W., and Shearer, S.A., “Maturity Assessment of Broccoli using the Discourse Fourier Transform”, Transaction of the ASAE, 35(6), pp. 2057-2062, 1992. [36].Raji, A.O., “Discrete Element Modeling of the Deformation of Bulk Agricultural Particulates”, Unpublished Ph.D Thesis, University of Newcastle-upon-Tyne, 1999. [37].Raji, A.O., Fagboun, A.A., and M.K. Dania, “An Approach to Detecting Defects in Food Products”, Proceedings of the First International Conference of the Nigerian Institution of Agricultural Engineers, pp.36-39, 2000. [38].Reed, J.N., Crook, S., and W. He., “Harvesting Mushrooms by Robot,. In Science and cultivation of edible fungi, pp . 385-391, Rotterdam: Elliott, Balkema, 1995.
8
©2010 International Journal of Computer Applications (0975 – 8887) Volume 1 – No. 4 [39].Ruan, R., Ning, S., Ning, A., Jones, R., Chen, P.L., “Estimation of scabby wheat incident rate using machine vision and neural network”, In: 1997 ASAE Annual International Meeting Technical Papers, Paper No. 973042, ASAE, 2950 Niles Road, St. Joseph, MI 49085-9659, USA, 1 997. [40].Sapirstein, H.D.,”Quality Control in Commercial Baking: Machine Processing”, Automation IV Proceedings of the ASAE FPAC Conference, St. Joseph, Michigan, USA, 1995. [41].Scott, A., “Automated Continuous Online Inspection, Detection and Rejection”, Food Technology Europe, 1(4), pp. 8688, 1994. [42].Shearer, S.A., Payne, F.A., “Colour and defect sorting of bell peppers using machine vision”, Transactions of the ASAE, 33 (6), pp. 2045-2050, 1990. [43].Slamet Riyadi, Ashrani A. Abd, Rahni Mohd, Marzuki Mustafa, and Aini Hussain, Member, “Shape Characteristics Analysis for Papaya Size Classification”, The 5th Student Conference on Research and Development-SCOReD 2007. [44].Sonka, M, Hlavac, V, Boyle, R., “Image Processing, Analysis, and Machine Vision”, PWS publishing, California, USA, 1999. [45].Steinmertz, V., Rogr, J.M., Molto, E., and J. Blasco, “Online Fusion of Colour Camera and Spectrophotometer for Sugar Content Prediction of Apples”, Journal of Agricultural Engineering Research, 73, pp. 207-216, 1999. [46].Steenhoek, L., Precetti, C., “Vision sizing of seed corn”, In: 2000 ASAE Annual International Meeting, Paper No. 003095 ASAE, 2950 Niles Road, St. Joseph, MI 49085-9659, USA, 2000. [47].Sun, D.W., “Computer Vision: An Objective, Rapid and Non-Contact Quality Evaluation Tool for the Food Industry”, Journal of Food Engineering, 61, pp.1-2, 2003. [48].Sun, D.W., and T. Brosnan, “Improving Quality Inspection of Food Products by Computer Vision: A Review”, Journal of Food Engineering, 61, pp. 3-16, 2003. [49].Tao, Y., and Z. Wen, “An Adaptive Spherical Image Transform for Characterizing Corn Growth and Development”, Transactions of the ASAE, 34(5), pp. 2245-2249, 1999. [50].Tao, Y., Morrow, C.T., Heinemann, P.H., Sommer, H.J., ”Fourier based separation techniques for shape grading of potatoes using machine vision”, Transactions of the ASAE, 38(3), pp. 949957, 1995b. [51].Timmermans, A.J.M., “Computer Vision System for Online Sorting of Pot Plants Based on Learning Techniques”, Acta Horticulturae, 421, pp. 91-98, 1998. [52].Tollner, E.W., Shahin, M.A., Maw, B.W., Gilaitis, R.D., Summer, D.R., “Classification of onions based on internal defects using imaging processing and neural network techniques”, In: 1999 ASEA International Meeting, Toronto, Onteroi, Paper no. 993165, ASAF, 2950 Niles Road, St. Joseph, MI 49085-9659, USA, 1999.
[53].Tsheko, R., “Image Analysis by Machine Vision”, Ph.D Thesis, University of Newcastleupon- Tyne, 1998. [54].Wan, Y.N., Lin, C.M., Chiou, J.F., “Adaptive classification method for an automatic grain quality inspection system using machine vision and neural network”, In: 2000 ASAE Annual International Meeting, Paper No. 003094 ASAE, 2950 Niles Road, St. Joseph, MI 49085-9659, USA, 2000. [55].Wang, H.-H., Sun, D.-W., “Evaluation of the functional properties of cheddar cheese using a computer vision method”, Journal of Food Engineering, 49(1), pp. 47-51, 2001. [56].Wang, H.-H., Sun, D.-W., “Melting characteristics of cheese: analysis of effects of cooking conditions using computer vision techniques”, Journal of Food Engineering, 52(3), pp. 279-284, 2002a. [57].Wang, H.-H., Sun, D.-W., “Correlation between cheese meltability determined with a computer vision method and with Arnott and Schreiber”, Journal of Food Science, 67(2), pp. 745749, 2002b. [58].Wooten, J.R., White, J.G., Thomasson, J.A., Thompson, P.G., “Yield and quality monitor for sweet potato with machine vision”, In: 2000 ASAE Annual International Meeting, Paper No. 001123, ASAE, 2950 Niles Road, St. Joseph, MI 49085-9659, USA, 2000. [59].Xie, W., Paulsen, M.R., “Machine vision detection of tetrazolium in corn”, In: 1997 ASAE Annual International Meeting Technical Papers, Paper No. 973044, ASAE, 2950 Niles Road, St. Joseph, MI 49085-9659, USA, 1997. [60].Yam, K.L., and E.P. Spyridon , “A Simple Digital Imaging Method for Measuring and Analyzing Colour of Food Surfaces”, Journal of Food Engineering, 61, pp. 137-142, 2003. [61].Zayas, I., Pomeranz, Y., Lai, F.S., “Discrimination of wheat and nonwheat components in grain samples by image analysis”, Cereal Chemistry, 66(3), pp. 233-237, 1989. [62].Zayas, I.Y., Martin, C.R., Steele, J.L., Katsevich, A., “Wheat classification using image analysis and crush force parameters”, Transactions of the ASAE 39 (6), pp. 2199-2204, 1996. [63].Zhang, N., Chaisattapagon, C., “Effective criteria for weed identification in wheat fields using machine vision”, Transactions of the ASAE, 38(3), 965-974, 1995.
9