2nd International Workshop on Software Engineering for Parallel and Distributed Systems, May 17-19, 1997, Boston, Massachusetts, IEEE CS Press, pages 74-83.
Prototype-Oriented Development of High-performance Systems 1 G. R. Ribeiro Justo, P. Vekariya, T. Delaitre, J. Zemerly, S. Winter Centre for Parallel Computing, University of Westminster, London E-mail:
[email protected],
Abstract In this paper, we discuss the problem of developing performance-oriented software and the need for methodologies. We then present the EDPEPPS (Environment for Design and Performance Evaluation of Portable Parallel Software) approach to the problem of designing and evaluating high-performance (parallel) applications. The EDPEPPS toolset is based on a rapid prototyping philosophy, where the designer synthesises a model of the intended software which may be simulated, and the performance is subsequently analysed using visualisation. The toolset combines a graphical design tool, a simulation facility, and a visualisation tool. The same design is used to produce a code suitable for simulation and real execution.
1 Introduction Many existing software engineering techniques which assist in the management of the complexity of serial programs can be directly applied to the development of parallel software. Many of the assumptions about serial programs, however, do not hold for parallel programs. Performance engineering, for example, is a low-priority activity in traditional life-cycle models but in high-performance computing, where parallel programming is applied, it is a dominant issue [16]. Attempts have been made to formulate methods following traditional life-cycle models which include performance engineering in the final stages of the development. For example, the generation of information at run-time for monitoring [22] and performance tuning [24]. Performance measurements are obtained after the program has been developed and, if necessary, the program is modified (redesigned and re-implemented) in order to improve performance. The cost and effort necessary in modifying a design when an error is found only after the implementation are normally very high. Yet parallel program designers are inevitably forced down this route because of performance design errors (inefficiencies). One solution is to detect performance design errors, like any design error, at the early stages of the development. 1 This
project is funded by an EPSRC PSTPA programme, Grant Number : GR/K40468
1
In [18], we have shown how performance engineering activities could be integrated in a template-oriented methodology based on formally defined program skeletons or templates. The main advantage of that approach is the use of formally defined transformation rules which can assist in the transformation and refinement of the templates. Another approach was introduced by Foster [9], based on analytical modelling. PCAM (Partitioning, Communication, Agglomeration and Mapping) is similar to a traditional development of parallel systems where tasks (processes) are identified and the inter-task communications defined and later refined, by amalgamating some tasks which are finally mapped to the hardware (processors). Performance engineering activities consist of defining performance models for the design. Unfortunately, there is not a systematic way in which the models are defined. This means that the process of creating the model can become as complex as the design of the application itself. Tools for the performance prediction of parallel programs at early stages of the software development have recently become available [23, 13, 7]. The idea behind them being to help the designers to create performance models for their applications. Transim [13] is a tool developed at the University of Westminster. The programs or prototypes of Transim are written in an occam-like2 language, and are executed (simulated) on a network of transputers. Even though, the prototypes can be simpler than the real occam code, they are very similar to the final implementation. They are not sufficiently abstract to be applied to high level designs. In addition, there is little support for design verification and transformation. N-MAP [8] goes a little further than Transim by proposing a performance/behaviour methodology based on the simulation of abstract specification of program skeletons from which behaviour and performance predictions are derived. A specification is based on three components: tasks, processes and packets. A task refers to a sequential program segment, and the behaviour (and requirements) of a task is expressed in units of time. Tasks are then ordered in processes which correspond to “virtual processors”. The packets denote the data transferred amongst virtual processors. The development process in N-MAP consists of providing a set of specifications for the components above, from which traces of the program simulation are generated. However, the specifications denote program structures which impact on the performance, and not necessarily important properties of the program design. Therefore, although N-MAP is claimed to integrate performance and software engineering activities, it is biased towards performance engineering. In this paper, we describe the EDPEPPS (Environment for Design and Performance Evaluation of Portable Parallel Software) approach to the problem of designing and evaluating high-performance (parallel) applications [5]. The EDPEPPS toolset is based on a rapid prototyping philosophy where the designer 2 occam
is a registered trademark of INMOS Limited.
2
synthesises a model of the intended software which may be simulated, and the performance is subsequently analysed using visualisation. The toolset combines a graphical design tool, a simulation facility, and a visualisation tool. The same design is used to produce a code suitable for simulation and real execution. The results of the simulation are an event-trace file and some statistical information about performance. The toolset is based on the PVM programming model [25]. In the next section, we present a general software process for high-performance systems (HPS). The idea is to identify the main activities and artifacts necessary in the development of HPS, and in particular how traditional software engineering activities can be combined with performance engineering activities, which are essential to HPS. In section 3, we introduce the EDPEPPS approach to HPS and outline how it covers the most important aspects of the software process presented in Section 2. The paper concludes, in Section 4 with a summary of the main results presented and a description of the work in progress.
2 The High-Performance Software Process According to Conradi, Fernstr¨om and Fuggetta [3], “a software process consists of all real-world elements involved in the production and maintenance of a software product”. These “real-world” elements correspond, more specifically, to the artifacts, activities, agents and support which compose the software process. In the current development stage of HPS, the number of agents (human performing activities related to a role) and their roles are not very important aspects of the software process – usually there is a single agent performing all activities. The essential elements of the process are, therefore, the artifacts produced or modified by the activities which are supported by tools. These elements are described in a process model using an appropriate (formal) notation. In [6], we put forward a software process model for HPS, and present a formal framework to describe software design methodologies (SDM) for those systems. The framework consists of two main parts: the software process activities which characterise the development of HPS, and the components of the SDM (concepts, artifacts, representation and actions) which are essential for any methodology. The framework relates these two parts by identifying generic components of each activity in the software process that can be used to classify and evaluate SDM for HPS. Another important property of the framework is that it has been formally specified using the language Z. As a result, it is also used to derive formal specifications of SDM. Our process model is represented in statechart [12] (Figure 1), a visual formalism which extends the notion of state diagram with hierarchy and abstraction. States (seen as sets) are denoted by blobs and arrows represent transitions. If two sub-states (sets) B and C of state A do not overlap, they are exclusive. In this case, state A can be in sub-state B or C. An arrow between non-atomic states (states which contain
3
Software Engineering Activities
Software Description
Hardware Description
Code Generation & Optimisation
Testing & Debugging
Performance Engineering Activities
Figure 1: A model of a high-performance software process. sub-states) means that all sub-states of one state are related to the all sub-states of the other state. Default arrows indicate default start states. A default arrow pointing to a non-atomic state means that every sub-state is a possible start state. Dotted lines stand for the (unordered) Cartesian product of states. In practical terms, they stand for concurrent activities (states). In order to simplify the process model, Figure 1 only illustrates the main activities and their relationships. The artifacts produced by an activity and used as raw material by another activity are considered implicitly, and are described in detail when the activities are analysed. One of the main differences between between traditional software development and HPS development is that in the former, performance usually plays a minor role and is only considered at the final stages of the development. For HPS, however, performance is a dominant issue and should be considered at all stages of the development [8]. This means that there can be tension between the performance activities (performance engineering activities) and the “traditional” development activities (software engineering activities). The first aspect of the model, therefore, is how to reconcile these two major groups of activities. In order to make the model more flexible it was decided to separate software and performance engineering activities as illustrated in Figure 1. As these activities are related in different ways by tools and methods, the two groups of activities were allowed to be carried out concurrently. This means, for example, that performance prototypes can be developed at early stages of the development as in [8, 18], and after the implementation as in [4].
2.1
Software Engineering Activities
In general these activities are very similar to those of traditional software processes. Although it is possible to start the development by creating throw-away prototypes, which may help in defining the
4
requirements, in most cases the development starts with a specification of the problem, and the eventual description of a solution design (software). An implementation is then derived from this description. The implementation (code) will be produced, possibly assuming a certain environment (target machine). So, the main artifact of this activity is the software product itself. The software description activities are concerned with the specification and design of the software product. One approach in the development of HPS is to produce a virtual design [15] which is independent of hardware (portable) but at the same time presents the level of performance required. Unfortunately, there is a trade-off between portability and performance – a specific design which exploits the characteristics of the hardware tends to present the best performance [1]. A novelty in terms of the development of HPS is that information about the target machine (hardware) will not only influence the implementation but it may also influence the solution itself. For this reason, the model allows for the hardware description to be constructed and analysed simultaneously with the software. This permits modelling SDMs where the hardware-dependent designs are derived from abstract (virtual) designs [15], and also where the hardware characteristics are taken into account during the design – especially to reduce “performance design errors” as proposed in [4]. The artifacts of the hardware description activities can be specific hardware characteristics or a description of the hardware which can best suit the software design [15]. For example, the description will be used to define explicitly the mapping of parallel tasks or simply annotations which will assist the compiler or run-time system to define the mapping. Certainly, an implementation is only derived after a software/hardware description has been produced. However, as discussed before, many approaches assume the transformation of already existing programs – parallelisation. The model accommodates these approaches by also allowing the software engineering activities to start from the code generation state as the default arrow in Figure 1 indicates. Although code optimisation can in general be done automatically, in the case of HPS many transformations require the programmer’s interaction [1], and can be very important in the adjustment or tuning of the software to hardware. Finally, the correctness of the implementation can be tested, and possible errors can be traced by using the debugging tools. It is essential to stress the importance of this kind of support for the development of HPS because the non-deterministic and complex behaviour of highly parallel programs make testing a difficult task.
5
2.2
Performance Engineering Activities
Performance activities are usually divided into two main groups: measuring the resources usage (performance) and the analysing of the results. The artifacts resulting from these activities usually consist of information which will be used by software engineering activities. Measurements can be produced in the initial phases of the development where prototypes or models of the system are created and the performance can be predicted. This information can be used by the software and hardware activities by assisting the designer in defining the best hardware/software description. The performance prediction activity is decomposed into two alternative sub-activities according to the way the prediction is performed. A traditional way of predicting performance is by using models of computation from which the complexity of the design can be computed and evaluated. Unfortunately, the lack of a general model of parallel computation has limited this route [20]. However, there are many special models which can give general and accurate results [10, 17]. The approach in the case of simulation is to apply a form of “symbolic execution” of an abstract view of the design. The main advantage of simulation is that, in general, the accuracy of the results is better than those obtained by analytical modelling [8, 2]. For this reason, simulation has been widely used as technique for studying the performance of HPS. Measurements can also be obtained after the program has been implemented. In this case a form of monitoring is used [4, 24]. These results are then used to modify the design or in a less costly way can be used to optimise the code by tuning the code to the specific hardware. The measurements obtained on the program performance (from prediction or from monitoring) usually pass through an analysis process before they can be finally used. The reason is that, even though the performance engineering activities heavily depend on the support of tools which measure the performance, the current state of the technology [16] does not provide tools which indicate the causes of a performance “bottleneck” [4]. Another important aspect is understanding that the analysis does not focus only on time or resource usage but also on certain quality metrics of the software product which are related to performance. Properties such as scalability and portability are a good measure of the relationship between the hardware and software [11]. Also, answers to questions like, “is it possible to obtain the same performance if a different hardware configuration is used?” or “will the performance increase when the hardware platform increases (more processors are used)?”, usually depend upon complex analysis which is very much related to performance.
6
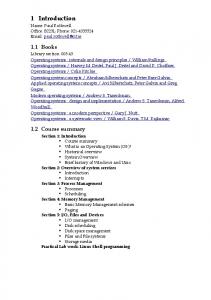
Figure 2: A design representation using PVMGraph.
3 The EDPEPPS Approach In this section, we present a methodology based on EDPEPPS. The methodology covers most of the important issues necessary in the development of HPS, and maintains a balance between software engineering and performance engineering aspects. In addition, the methodology is supported by tools which facilitate the execution of each step of the methodology and the production of the artifacts. At the current stage, EDPEPPS does not consider an analysis or specification phase. This means that the development starts at the design phase as many existing methodologies for HPS [9, 19, 16].
3.1
Design
As in PCAM [9], this phase starts with the identification of the main tasks. The EDPEPPS graphical design tool (PVMGraph) assists the designer in creating a graphical representation of the tasks. At the same time, PVM skeletons are automatically created. The designer can also reuse existing tasks. When a task is named, PVMGraph automatically imports a task with that name if it already exists. EDPEPPS does not prescribe any partitioning strategy, the designer is free to use the most suitable one [9]. The artifact generated by this step is a collection of task nodes, represented graphically, together with their PVM description. 7
Figure 2 illustrates a design in PVMGraph. The figure shows that the design is in different stages. For example, task KeyboardServer and GraphicsSever are represented by a simple box indicating that their behaviour has not been defined yet. The next step is the definition of each task (general) behaviour. The behavioural description consists of defining how the processes react to events (messages) they receive and which events they generate. More specifically, this is done by selecting PVM primitives. In PVMGraph, each primitive is represented by a graphical symbol, so the behaviour can described graphically. Again, for each graphical symbol added, PVMGraph automatically inserts the textual representation (code) in the task skeleton. Later, the designer can refine the textual representation. The resulting artifact is also a collection of tasks but some of them with their behaviour only partially defined. This means that the tasks nodes contain symbols representing part of their behaviour. In Figure 2, several tasks have their behaviour defined. For example, task UserInterface has 4 simple send actions and 4 simple receive actions. Figure 2 also illustrates part of the code associated with task UserInterface. The following step in the design is the definition of the communication structure as in PCAM. This corresponds to the description of the relationships between the tasks. However, unlike structured models such as [19], PVM allows the communication structure to be defined or modified arbitrarily during execution. Therefore, during the design the communication structure can be only partially defined. Another important aspect of PVM is the need to explicitly specify the configuration of tasks in terms of creation and destruction. This means to specify which tasks are spawned or killed by peer tasks. Again, unlike structured models such as [19], this can be done arbitrarily, and any task can spawn or kill other tasks. In PVMGraph, the design specifies this relationship graphically and the text is inserted in the skeleton. At this stage, the artifact is a connected graph, where relationships between tasks are presented by solid lines connecting them. In Figure 2, UserInterface sends and receives messages from MouseServer, ServerScreen and ScreenServer. Note, however, that ropeN performs send and receive actions which are not associated (linked) to any other task. Grouping is possible but not as in PCAM. Tasks are grouped only to simplify communication. The graph can be enhanced by the concept of sub-graphs which represent collections of nodes. Finally, the mapping can also be defined graphically by indicating in which virtual machines the tasks will be executed. However, the mapping does not have to be defined explicitly in PVM. In fact, it can even be left to PVM which uses a heuristic method to distribute the tasks across the virtual machine. This concept is graphically similar to that of a group except that a task can be member of more than one group but can only be allocated to a single virtual machine. Notice that unlike other methods and tools [13, 8], EDPEPPS combines the software description and hardware description. In Figure 2, two virtual machines have been defined, jaguar and horus. The mapping indicates that tasks MouseServer, KeyboardServer and ScreenServer have been allocated to jaguar where tasks ropeN, rope and rope1 have
8
Figure 3: Animation and statistical graphics in PVMVis. been allocated to horus. The mapping does not indicate the allocation of the other tasks. Figure 3 summarises the main steps and artifacts of the EDPEPPS development.
3.2
Prototyping and Performance Analysis
Rapid prototyping is a useful approach to the design of (high-performance) parallel software in that complete algorithms, outline designs, or even rough schemes can be evaluated at a relatively early stage in the development life-cycle, with respect to possible platform configurations and mapping strategies. Modifying the platform configurations and mapping will permit the prototype design to be refined, and this process may continue in an evolutionary fashion through out the life-cycle. As proposed in the software process model presented in Section 2, the EDPEPPS prototypes can be created at any stage of the development as soon as a (incomplete) task graph is produced. An important issue is what minimum information is required to provide precise performance prediction [8]. In EDPEPPS, the user should provide a specification of the program distribution or mapping and some information about each task’s functional behaviour or sequential algorithm. However, this information is not mandatory as a default mapping can be used, and no sequential algorithm is required. The sequential part of a task can also be defined as sequential blocks which are usually specified in an abstract way as an approximation of the execution time or workload [8]. The EDPPEPS simulation language (SimPVM) provides several other functions which allow the designer to specify abstract algorithms [5]. Even program skeletons can exhibit complex performance behaviour. So, the issue of what information is necessary and how to detect performance bottlenecks has to be an essential part of the methodology. 9
Performance tools must support this activity as the mere use of analytical models may not help very much. A recent study has been reported in [14]. In EDPEPPS, the visualisation tool (PVMVis) provides two main types of support. A step-by-step animation of the design together with statistical information about the various layers of the systems, from the application level (tasks and communications) to the operating systems (scheduling and communication protocols) hardware (processor and network) level. The important aspect is that at any time the designer can have a snapshot of the whole system performance. However, the task of finding what is the cause and the exact location of bottlenecks is still the designer’s responsibility. Figure 3 illustrates PVMVis. The main window shows the animation of the graphical representation where on the right the various statistical graphics are presented. Note that during the animation the tasks are only shown when they have started their execution. For example, in the figure only tasks UserInterface and rope have started. Also, only the current actions are illustrated. In EDPEPPS, a set of prototypes is created, where each prototype focuses on a specific aspect of the design. Each prototype is defined as follows:
Decomposition Prototypes: Initially, approximations of each task (total) workload in terms of timing equations are defined together with an (ideal) mapping, as suggested in PCAM [9].The designer uses this prototype to analyse processor efficiency (loading). Behaviour Prototype: Each task (total) workload is refined by replacing part of it with PVM code (actions). The designer can then have more insight of processor efficiency and scheduling. Communication Prototype: This prototype is used to evaluate the communication network instead of individual processors. Issues such as message size, network load and contention are considered here. Mapping Prototype: The ideal (initial) mapping must be refined to a more realistic one, taking into account the tasks’ behaviour and the communication network. The designer is also encouraged to evaluate and compare different mapping strategies. Refinement Prototype: Similarly to the Behaviour Prototype, in this prototype the remaining timing equations are replaced with the sequential algorithms. The designer can therefore have a more realistic view of the tasks and their final implementation.
Note that the above prototypes are complementary and are not necessarily created in sequence. Instead, as new information is added, the prototypes are revised and reevaluated. Modifications of the design or simply evaluation of different alternatives are important parts of any prototyping approach and of performance prototyping in particular. As our software process model 10
Performance Engineering Activities & Artifacts
Software Engineering Activities & Artifacts Task Decomposition
Decomposition Prototype
Task Nodes
Initial information about different decomposition strategies Behaviour Definition
Task Behaviour Node
Bahaviour Prototype Information about task behaviour
Comm. Structure
Definition
Communication Prototype
Task Graph
Information about the communication structure Mapping Definition
Task Graph Mapping
Mapping Prototype
Refined Graph
Refinement Prototype
Information about the mapping Task Refinement
Information about the sequential algorithms
Figure 4: An overview of the activities & artifacts in the EDPEPPS development. indicates, therefore, software engineering and performance engineering activities should occur concurrently. Figure 4 describes the possible types of prototypes which can be created at each stage of the development and their function.
3.3
Implementation
Since the task skeletons are already written in PVM, the final implementation is derived directly from them. However, details of the algorithm must be included. PVMGraph can generate the executable code. An important aspect of the EDPEPPS toolset is that performance analysis of the real code is possible using PVMVis. Since the event-trace file is based on TapePVM [21], this file can also be generated by instrumenting the real code. This allows the designer to compare the simulated and the real versions of the application. PVMVis can also be used as a debugging tool for the real code.
4 Conclusions and Work in Progress The number of tools available to support particular activities in the development of HPS is enormous. However, unlike traditional sequential system development which is supported by a large number of methods, few methods claim to cover all activities of the development of HPS. The main consequence is that HPS will continue to be dedicated to very specialised applications. In the same way, the use of parallelism as an important technique to produce modular and structured design will be diminished. This paper addressed the problem and claimed that one of most important causes was the lack of a
11
model or framework to describe the essential elements (activities and artifacts) in the development of HPS. The paper then suggested a software process model where these elements were described. In order to be applied to the evaluation and classification of most of the current methods and activities, the model only identified the high level elements. A more detailed model would decompose these activities into many sub-activities but could make its application more difficult. The graphical development method illustrated in the paper, unlike most of the methods current available, aims at providing the HPS developer with the same support widely available for sequential systems developers. It covers most of the activities described by the model, and integrates software and performance engineering activities in a structured way. The principle is to produce highly parallel systems which present high performance. This is the main challenge for HPS developers and the method attempts to guide them in this direction. As in sequential software development, the use of high-level structures such as patterns and frameworks are now becoming essential in the development of HPS. The main objective is to simplify the development by providing pre-defined abstractions which capture generic aspects of classes of applications. In this direction, we are currently developing new graphical elements which will enable the designer to create SPMD and client/server applications. Although the EDPEPPS toolset supports most of the activities required for HPS, some existing tools could be integrated to provide extra capabilities. We are currently working on the integration of a debugging tool for PVM applications.
References [1] D. F. Bacon, S. L. Graham, and O. J. Sharp. Compiler transformations for high-performance computing. ACM Computing Surveys, 26(4):345–420, December 1994. [2] D. C. Burger and D. A. Wood. Accuracy vs. performance in parallel simulation of interconnection networks. In International Symposium on Parallel Processing, pages 1–12. IEEE Press, April 1995. [3] R. Conradi, C. Fernstrom, and A. Fuggetta. A conceptual framework for evolving software processes. ACM SIGSOFT: Software Engineering Notes, 18(4):26–35, October 1993. [4] P. Dauphin. Combining functional and performance debugging of parallel and distributed systems based on model-driven monitoring. In 2nd Euromicro Workshop on Parallel and Distributed Processing, pages 463–470. IEEE Computer Society Press, 1994. [5] T. Delaitre, G. R. R. Justo, F. Spies, and S. C. Winter. A graphical toolset for simulation modelling of parallel systems. Journal of Parallel Computing, 1997 (Accepted for publication). [6] M. d’Inverno, G. R. Justo, and P. Howells. A formal framework for specifying design methodologies. Software Process: Improvement and Practice, 3, To Appear(1997). [7] A. Ferscha and J. Johnson. N-MAP: A virtual processor discrete event simulation tool for performance prediction in the CAPSE environment. In 28th Annual Hawaii International Conference on Systems Sciences, pages 276–285. IEEE Computer Society Press, 1995. [8] A. Ferscha and J. Johson. Perormance prototyping of parallel applications in N-MAP. In Second International Conference on Algorithms & architectures for Parallel Processing, pages 84–91. IEEE CS Press, June 1996.
12
[9] Ian Foster. Designing and Building Parallel Programs. Addison-Wesley, 1995. [10] J. L. Gustafson and Q. O. Snell. HINT: A new to measure computer performance. In 28th Annual Hawaii International Conference on Systems Sciences, pages 392–401. IEEE Computer Society Press, 1995. [11] O. Hansen. A method for optimising large scale parallel applications. In 28th Annual Hawaii International Conference on Systems Sciences, pages 192–201. IEEE Computer Society Press, 1995. [12] D. Harel. On visual formalisms. Communications of ACM, 31(5):514–530, May 1988. [13] E. Hart. TRANSIM: Prototyping Parallel Algorithms. University of Westminster Press, 1994. [14] J. K. Hollingsworth and M. Steele. Grindstone: A test suite for parallel performance tools. Technical Report UMIACS-TR-96-73, Institute of Advanced Computer Studies and Computer Science Department, University of Maryland, College Park, 1996. [15] L. H. Jamieson. Characterizing parallel algorithms. In L.H. Jamieson, D. Gannon, and R. J. Douglas, editors, The characteristics of Parallel Algorithms, pages 65–100. The MIT Press, 1987. [16] I. Jelly and I. Gorton. Software engineering for parallel systems. Information and Software Technology, 36(7):379– 380, 1994. [17] H. Jonkers, A. J. C. van Germund, and G. L. Reijns. A probabilistic approach to parallel systems performance modelling. In 28th Annual Hawaii International Conference on Systems Sciences, pages 412–421. IEEE Computer Society Press, 1995. [18] G. R. R. Justo. A graphical approach to performance-oriented development of parallel programs. In V. K. Prasanna S. Sahni and V. P. Bhatkar, editors, Second International Conference on High Performance Computing, pages 667–672. Tata McGraw Hill, 1996. [19] J. Magee, N. Dulay, and J. Kramer. A constructive development environment for parallel and distributed programs. In 2nd Int. Workshop on Configurable Distributed Systems, SEI, Carnegie Mellon University. IEEE Computer Society Press, March 1994. [20] B. M. Maggs, L. R. Matheson, and R. E. Tarjan. Models of parallel computation: A survey and synthesis. In 28th Annual Hawaii International Conference on Systems Sciences, pages 61–70. IEEE Computer Society Press, 1995. [21] E. Maillet. TAPE/PVM an efficient performance monitor for PVM applications – user guide. Technical report, LMC-IMAGE, University of Grenoble, 1995. [22] A. D. Malony, D. A. Reed, and H. A. G. Wijshoff. Performance measurement intrusion and perturbation analysis. IEEE Transactions on Parallel and Distributed Systems, 3(4):433–450, July 1992. [23] V. W. Mark and S. F. Lundstrom. Predicting performance of parallel computations. IEEE Transactions on Parallel and Distributed Systems, 1(3):257–270, July 1990. [24] R. McConnel, P. Milligan, J. McCann, and P. McMullan. Monitoring, analysis and tuning of parallel programs within the FortPort migration environment. In 2nd Euromicro Workshop on Parallel and Distributed Processing, pages 479–485. IEEE Computer Society Press, 1994. [25] V. S. Sunderam. PVM: A framework for parallel distributed computing. Concurrency: Practice And Experience, 2(4):315–339, December 1990.
13