Aug 11, 2016 - A Python framework has the advantage of ... gramming interface (API), developed by Google, based on the .... the performance of the dc.js library for generating synchronized plots; testing the performance of an interface.
Prototyping the graphical user interface for the operator of the Cherenkov Telescope Array I. Sadeha , I. Oyaa , J. Schwarzb , E. Pietrigac , and the CTA Consortiumd a
DESY-Zeuthen, D-15738 Zeuthen, Germany INAF - Osservatorio Astronomico di Brera, Italy INRIA Saclay - Ile de France, LRI (Univ. Paris-Sud & CNRS), France d http://www.cta-observatory.org/ b
c
arXiv:1608.03595v1 [astro-ph.IM] 11 Aug 2016
ABSTRACT The Cherenkov Telescope Array (CTA) is a planned gamma-ray observatory. CTA will incorporate about 100 imaging atmospheric Cherenkov telescopes (IACTs) at a Southern site, and about 20 in the North. Previous IACT experiments have used up to five telescopes. Subsequently, the design of a graphical user interface (GUI) for the operator of CTA involves new challenges. We present a GUI prototype, the concept for which is being developed in collaboration with experts from the field of Human-Computer Interaction. The prototype is based on Web technology; it incorporates a Python web server, Web Sockets and graphics generated with the d3.js Javascript library. Keywords: The Cherenkov Telescope Array, graphical user interface, Web technology.
1. INTRODUCTION The Cherenkov Telescope Array (CTA)1–3 is a planned observatory for very high-energy gamma-rays, sensitive to energies from 20 GeV to a few hundred TeV. Gamma-rays induce particle cascades in the atmosphere. These are accompanied by Cherenkov radiation, which is emitted by the charged particles in the cascade. The Cherenkov light may be detected by imaging atmospheric Cherenkov telescopes (IACTs).4 Using multiple telescopes in concert, Cherenkov showers can stereoscopically be sampled, allowing to reconstruct the properties of the primary gamma-ray. CTA will include three different telescope types, sensitive to different gamma-ray energy ranges. The telescopes will be deployed in two sites, Northern and Southern, which will respectively include about 100 and about 20 telescopes. Currently running IACT experiments such as H.E.S.S.,5 MAGIC6 and VERITAS,7 are restricted to up to five telescopes. Compared to these instruments, the large number of CTA telescopes will improve the sensitivity and the energy coverage of gamma-ray measurements by at least an order of magnitude. The large number of telescopes has implications for the development of a graphical user interface (GUI) for the operator of a CTA site. The complexity of the system presents new and interesting challenges, requiring innovative design. In the following, we detail the development process of the operator GUI. We discuss the requirements we have derived for the GUI, and describe our prototype implementation.∗
2. DEVELOPMENT PROCESS AND REQUIREMENTS FOR THE GUI In order to develop an effective user interface, we have drawn upon the lessons learned from the Atacama Large Millimeter/submillimeter Array (ALMA).8 ALMA is an astronomical interferometer of radio telescopes in the Atacama desert of northern Chile. It will be comprised of up to 66 radio antennas, and so will be comparable to CTA in complexity. During the early stages of ALMA, conventional user interfaces were developed. Early experience operating the ALMA array with only a few antennas indicated that the latter were not adequate. The initial interfaces required many unnecessary interactions to access relevant information. This resulted in extraneous cognitive ∗
Media resources illustrating features of the prototype are available at https://www-zeuthen.desy.de/~sadeh/ .
1
load, and was not efficient for quick diagnosis of system problems. The implementation was therefore improved, taking into account advances in the field of Human-Computer Interaction (HCI).9 For creating the GUI for the operator of CTA, we are following the design process used for ALMA. The GUI is being developed by involving experienced telescope operators and astroparticle physicists on the one hand, and experts from the field of HCI on the other. In contrast to ALMA, we have been able to adopt this model at the start of the design process for CTA. We will therefore be able to apply HCI input to all aspects of the operator interface. The development process includes practical face-to-face meetings, in tangent with brainstorming workshops with representatives of the relevant stakeholders. To date, we have held two such participatory design workshops. The outcome of the meetings is twofold. For one, the workshops helped us to refine the scope of the operator GUI, i.e., answer the question, “what should the GUI enable users to do?”. Additionally, we have defined a preliminary set of panels for the GUI. That is, we have began to address the question, “how should the GUI be designed?”. With regards to the first question, we first note that on-site operations related to observing with CTA will normally be automated. Consequently, the GUI for the operator of a CTA site will nominally be used to perform the following tasks: 1. initiate and end observations; 2. override the automated scheduled operations in order to perform a specific task, or for safety reasons, which might require manual control over a given telescope or group of telescopes; 3. monitor the state of the array during data acquisition, which includes monitoring of low-level hardware components, of software processes, and of the output of a near real-time data analysis; 4. identify and diagnose problems with specific sub-systems or processes, in order to solve minor problems or to notify technical experts, as needed. With regards to the second question, we have defined the following categories, which will be represented by different GUI panels (some of which may overlap): 1. Telescope: monitor the status of telescopes and their respective sub-systems; manually control single telescopes and sub-arrays, etc. 2. Process: monitor and modify predefined operation sequences, such as starting up the array at the beginning of the night, and performing a scheduled observing task. 3. Science: monitor the output of a physics analysis on the level of a single telescope or of a sub-array, including trigger rates, event-reconstruction metrics, science summary reports, etc. 4. Infrastructure: monitor the status of auxiliary systems, such as the power grid, as well as other indicators, such as alarms and data transfer rates. 5. Environment: monitor environmental systems, such as weather monitors, all-sky cameras, etc. 6. Miscellaneous: provide access to terminals, shift logs, expert call sheets, etc. With these guidelines in mind, we have identified the following set of initial requirements for the GUI: 1. the GUI will be able to convey information for various levels of telescope multiplicity; on the level of the entire array (∼ 100 telescopes); the level of sub arrays (between 1 and 32 groups); or the level of a single telescope and the associated sub-systems. Multi-telescope views for a given sub-system will also be available, which will take into account differences between telescope types. The various levels of information will be integrated using semantic zooming (defined below); 2. the GUI will need to be highly responsive, where the different panels of the GUI will have the option to be synchronized; 2
3. the GUI will integrate different interfaces to CTA software (databases, live feeds etc.) with various latencies; 4. the different components of the GUI will be modular, allowing for quick updates and for collaborative development. In the next section, we illustrate the requirements for the operator GUI using a prototype design. At this stage of development, the prototype by no means addresses the complete scope of the GUI. Instead, it acts as a proof of concept for those features which were identified as most important.
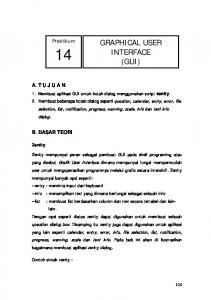
3. PROTOTYPING ACTIVITIES Our prototype is based on Web technologies. A Web-based framework has the advantage of being lightweight and modular. It also naturally allows for remote access, which will enable the GUI to be used for remote monitoring, and for remote operation. These will be useful both for physicists and for technical experts, who the operator of the array will need to consult. The back-end of the prototype is a Python server called Pyramid.† A Python framework has the advantage of being very versatile, incorporating the ability to use many off-the-shelf libraries for computation, communication, multi-threading and multi-processing. The front-end is a web browser. The design is responsive, i.e., adjustable according to the width of the display. It is implemented using Polymer,‡ a Web Component application programming interface (API), developed by Google, based on the Material Design§ concept. Data are displayed using an open-source Javascript library, called d3.js.¶ The latter is a data-driven framework, with integrated mechanisms for displaying, updating and animating vector graphics. Communication between the back-end and the front-end of the GUI is performed using Web Sockets. These allow asynchronous communication, facilitating quick and robust GUI behaviour. For plotting, we also use dc.js,k a library based on d3.js and on Crossfilter.∗∗ The latter is a Javascript library, which facilitates exploring large multivariate datasets. Figure 1 shows a representation of the layout of a CTA array, where each circle corresponds to a single telescope. The relative position of telescopes corresponds to a scaled physical layout on-site, constituting a pseudo-geographic display of the array. The attached numerical values and the colour scheme of elements correspond to a health metric. This metric may represent different properties according to the visualization context. The panel incorporates semantic zooming,10 which defines the context. Semantic zooming is a technique of assigning different layers of information to a given visual element. This behaviour complements the usual geometric zooming, where the size of elements changes with the zoom factor. For the type of semantic zoom implemented in this example, the level of detail associated with an element increases as one zooms-in. The figure shows the evolution of the display for different zoom factors, as follows. Zoom factor 1: Figure 1(a) shows a global view of all telescopes, emphasizing physical positions, as well as a general health metric. In this example, health corresponds to the combined health of all sub-systems of the telescope. For illustration, one of these sub-system, the camera, reports reduced health as the percentage of dead pixels. Zoom factor 7: Given this zoom level, Fig. 1(b) shows how the display changes for a given element which is hovered over. The hover action triggers a transition, where a circle representing a single telescope is replaced by a more detailed view of the associated sub-systems. The context from the previous zoom level is preserved during the transition. The health metric, which was previously represented by the full circle, has morphed into the red circle surrounding the four wedges. Each of the wedges represents one of the sub-systems of a telescope: the data-acquisition system (DAQ); the camera; the mirror system; and the mount (the structure of the telescope). Each of the latter now also reports its individual health metric. These are represented numerically, by colour and by the percentage of filled area within the corresponding wedge. †
See http://docs.pylonsproject.org/projects/pyramid/ . See https://www.polymer-project.org/ . § See https://design.google.com/ . ¶ See https://d3js.org/ . k See https://github.com/dc-js/dc.js . ∗∗ See http://square.github.io/crossfilter/ . ‡
3
(a)
(b)
(c)
(d)
Figure 1. Pseudo-geographic display of a CTA array, showing different semantic zoom levels, as described in the text. The zoom factors are 1 in (a), 7 in (b), and ∼ 14 in (c) and (d).
4
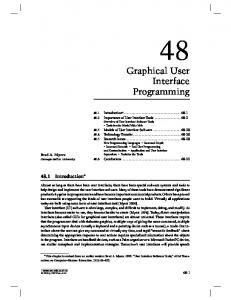
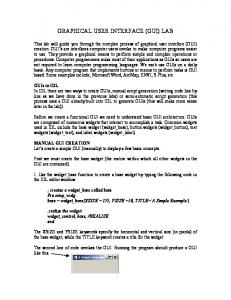
Zoom factor ∼ 14: Given this zoom level, another transition occurs. Figure 1(c) shows a second level of components, which is exposed for each of the four sub-systems. As before, the context from the previous zoom level is preserved; the health metric of each of the sub-systems is now represented by a thin outer arc. The inner wedges now each have different layouts of components. These are arranged in sunburst diagrams,11 which are a hierarchical variation on a pie chart. The change from the view shown in Fig. 1(c) to that shown in Fig. 1(d) occurs as the user clicks on the wedge of the mount. The sunburst diagram of the latter then opens up to a full 360◦ , and the wedges of the DAQ, camera and mirror disappear. The generic names (mount 0, mount 1, etc.) are temporary place-holders for different elements of the mount sub-system, such as drivers and PLC (programmable logic controller)12 status indicators. Figure 2 presents another telescope-centric view. In this case, two synchronized panels are provided side by side. The panel on the left shows the positions on the sky, at which telescopes point. The polar plot has two coordinates. The angular coordinate, denoted by ϕ, represents the azimuth on the sky; it spans the range from 0◦ (at the top-most position of the circle) to 180◦ (for the right-hand side), and 0◦ to −180◦ (for the left-hand side). The radial coordinate, denoted by δ, indicates the elevation, with values between 0◦ (at the edge of the figure) and 90◦ (on the centre). Telescopes are represented by full circles. Each one has an intended target position, indicated by rings, where faint dashed lines connect telescopes and targets. The display is updated in real-time, showing the movement of telescopes from their initial pointing, towards their respective target positions. The panel on the right shows a logical grouping of telescopes, as opposed to the pseudo-geographic display of Fig. 1. In this case, telescope positions indicate association to a sub-array, which here stands for a group of telescopes which all point at the same target on the sky. This type of visualization, called an enclosure diagram, is a hierarchical nested layout of elements. In this case, grey-shaded circles represent sub-arrays, with coloured circles standing for telescopes. Both the panel on the left and that on the right incorporate semantic zooming, as indicated by comparing Figs. 2(a), 2(b), and 2(c). For the left panel, the behaviour is a simple scaling of elements. As one zooms in or out, the size of telescopes and targets changes very slowly with respect to the changing scale of the coordinate system. For the panel on the right, the semantic zoom includes a threshold transition at zoom factor ∼ 2, as shown in Fig. 2(b). In this example, each telescope is represented by a circle and an arc; these respectively indicate the ϕ and δ coordinates of the telescope and its target, using the same visual language as for the panel on the left. Another threshold transition occurs at zoom factor ∼ 14, as presented in Fig. 2(c). In this instance, the purpose of the visualization is to provide detailed information, regarding the coordinates at which the telescope is pointing. The two panels are synchronized using brushing and linking, following the principles of coordinated multiple views.13 In Fig. 2(b), a sub-array is selected on the right panel; this causes the associated elements in the panel on the left to become highlighted. Such behaviour allows to quickly identify in the display on the left, which telescopes are assigned to which sub-array. In Fig. 2(c), the single selected telescope is similarly the only element in focus, both on the right panel and on the left. The interplay between the two panels illustrated here also serves to demonstrate an important feature of panel-synchronization. Namely, that synchronization need not necessarily work both ways. As in this case, user interactions with the panel on the right affect the panel on the left by focusing specific elements, but the reverse does not hold. Figure 3 shows three views of a panel featuring monitoring plots. In this example, the data are extracted from the database of a weather monitoring station. They include measurements of the humidity inside and outside of the weather station, of the speed and direction of the wind near the station, and of the atmospheric pressure. The monitoring plots are placed inside a container, designated as a Dashboard. Plots may be resized and dragged within the Dashboard, or placed in separate Dashboards. The plots are generated using dc.js. They are correlated (a feature of Crossfilter), as shown in, e.g., Fig. 3(b). In this case, the user has selected a range of values of the atmospheric pressure parameter (marked by the blue brush). The other plots reflect the selection, by showing only those measurements which have a corresponding atmospheric pressure within the chosen range. A side-menu may be overlaid on top of the plots, as shown in Fig. 3(c). Several control options exist. To name a few, the user may add new plots; the user may select new dates for querying the database; and the user may switch to a live-mode, where real-time data are updated every few seconds.
5
(a)
(b)
(c) Figure 2. Synchronized panels, showing the positions on the sky at which telescopes point (left), and the grouping of telescopes into sub-arrays (right), as described in the text. The zoom factors for the panel on the right are 1 in (a), 2 in (b), and ∼ 14 in (c).
6
(a)
(b)
(c)
Figure 3. Example of a monitoring panel, featuring data extracted from the database of a weather monitoring station. These include measurements of the humidity inside and outside of the weather station, of the speed and direction of the wind near the station, and of the atmospheric pressure. (a) : A selection of data monitoring plots. (b) : Illustration of the synchronization of plots. A selected range of values of the atmospheric pressure parameter (shaded in blue), affects the other plots, by excluding data outside of the chosen scope. (c) : A side-menu with various control options may be overlaid on top of the plots, upon clicking the purple button on the top right corner. The option also exists (not shown), of pinning the menu alongside the plots instead.
7
The main purpose for implementing this visualization was to create a practical example for a monitoring panel. In addition, it was also used as a platform to conduct tests of our prototype. These included the following: testing the performance of the dc.js library for generating synchronized plots; testing the performance of an interface between the Python web-server and an external database; splitting data processing tasks between the Python server and the web browser client. The results of these tests have so far been encouraging; they have indicated that a web-based framework is suitable for the next stages of development of the operator GUI.
4. SUMMARY The planned Cherenkov Telescope Array will be comparably more complex than existing IACT experiments. This poses new challenges for creating an effective graphical user interface for the operator of the array. The development of the GUI for CTA follows the successful working model of the ALMA experiment. The design process brings together experienced telescope operators and astroparticle physicists on the one hand, and experts from the field of Human-Computer Interaction on the other. The relevant stakeholders have so far conducted two participatory design workshops, in addition to other face-to-face meetings. The outcome of the work to date is: a refined definition of the scope of the GUI and of the requirements on its performance; a preliminary list of GUI panels; identification of a set of relevant data visualization techniques. A preliminary prototype of several GUI panels has been implemented. It is based on Web technologies, incorporating a Python web server, Web Sockets and graphics generated with the d3.js Javascript library. The prototype illustrates semantic zooming and coordinated multiple views, and serves for performance testing of the proposed technology.
ACKNOWLEDGMENTS We would like to thank Caroline Appert, Antonio Cabrera, Francesco Dazzi, Valentina Fioretti, Stafano Gabici, Markus Garczarczyk, Rosa Macias and the members of the ACTL team, for their helpful comments and insights.
REFERENCES [1] Actis, M. et al., “Design concepts for the Cherenkov Telescope Array CTA: an advanced facility for groundbased high-energy gamma-ray astronomy,” Experimental Astronomy 32, 193–316 (Dec. 2011). [2] Fuessling, M., Oya, I., Balzer, A., et al., “Status of the array control and data acquisition system for the cherenkov telescope array,” Proc. SPIE 9913, 99133C–99133C–12 (2016). [3] Oya, I., Fuessling, M., Antonino, P. O., et al., “The software architecture to control the cherenkov telescope array,” Proc. SPIE 9913, 991303–991303–15 (2016). [4] Hillas, A., “Evolution of ground-based gamma-ray astronomy from the early days to the cherenkov telescope arrays,” Astroparticle Physics 43, 19 – 43 (2013). Seeing the High-Energy Universe with the Cherenkov Telescope Array - The Science Explored with the CTA. [5] Aharonian, F. et al., “Observations of the Crab nebula with H.E.S.S.,” A&A 457, 899–915 (Oct. 2006). [6] Albert, J. et al., “VHE Gamma-Ray Observation of the Crab Nebula and Pulsar with MAGIC,” Astrophys. J. 674, 1037–1055 (2008). [7] Holder, J. et al., “The first VERITAS telescope,” Astropart. Phys. 25, 391–401 (2006). [8] Wootten, A. and Thompson, A. R., “The Atacama Large Millimeter/Submillimeter Array,” IEEE Proceedings 97, 1463–1471 (Aug. 2009). [9] Pietriga, E. et al., “Interaction design challenges and solutions for ALMA operations monitoring and control,” in [SPIE Astronomical Telescopes and Instrumentation ], SPIE, ed., Proc. SPIE 8451, Software and Cyberinfrastructure for Astronomy II 8451, SPIE (July 2012). [10] Perlin, K. and Fox, D., “Pad: An alternative approach to the computer interface,” in [Proceedings of the 20th Annual Conference on Computer Graphics and Interactive Techniques], SIGGRAPH ’93, 57–64, ACM (1993). [11] Stasko, J., Catrambonw, R., Guzdial, M., and McDonald, K., “An evaluation of space-filling information visualizations for depicting hierarchical structures,” Int. J. Hum.-Comput. Stud. 53, 663–694 (Nov. 2000). 8
[12] Behera, B., Oya, I., Birsin, E., K¨ oppel, H., Melkumyan, D., Schlenstedt, S., Schmidt, T., Schwanke, U., Wegner, P., Wiesand, S., and Winde, M., “Development of the ACS+OPC UA based control system for a CTA medium size telescope prototype,” in [Software and Cyberinfrastructure for Astronomy II ], Proc. SPIE 8451, 84510H (Sept. 2012). [13] North, C. and Shneiderman, B., “Snap-together visualization: a user interface for coordinating visualizations via relational schemata,” in [Proceedings of the working conference on Advanced visual interfaces], AVI ’00, 128–135, ACM (2000).
9