Apr 25, 2010 - V. TRUST ADVISER FILTERS/METRICS. This section presents a set of filters that capture similarity between two users. This similarity can be ...
PROTECT: Proximity-based Trust-advisor using Encounters for Mobile Societies Udayan Kumar, Gautam Thakur, Ahmed Helmy
arXiv:1004.4326v1 [cs.NI] 25 Apr 2010
Department of Computer and Information Science and Engineering, University of Florida Email: {ukumar, gsthakur, helmy}@cise.ufl.edu
Abstract—Many interactions between network users rely on trust, which is becoming particularly important given the security breaches in the Internet today. These problems are further exacerbated by the dynamics in wireless mobile networks. In this paper we address the issue of trust advisory and establishment in mobile networks, with application to ad hoc networks, including DTNs. We utilize encounters in mobile societies in novel ways, noticing that mobility provides opportunities to build proximity, location and similarity based trust. Four new trust advisor filters are introduced - including encounter frequency, duration, behavior vectors and behavior matrices - and evaluated over an extensive set of real-world traces collected from a major university. Two sets of statistical analyses are performed; the first examines the underlying encounter relationships in mobile societies, and the second evaluates DTN routing in mobile peerto-peer networks using trust and selfishness models. We find that for the analyzed trace, trust filters are stable in terms of growth with time (3 filters have close to 90% overlap of users over a period of 9 weeks) and the results produced by different filters are noticeably different. In our analysis for trust and selfishness model, our trust filters largely undo the effect of selfishness on the unreachability in a network. Thus improving the connectivity in a network with selfish nodes. We hope that our initial promising results open the door for further research on proximity-based trust.
I. I NTRODUCTION Most interactions between people take into consideration, and in many cases rely on, prior established trust. In the context of interactions over computer networks trust establishment is particularly important and challenging, given the identity theft, fraud and security breaches common in the Internet today. These problems are further exacerbated by the uncertainty and dynamics in wireless mobile networks. Furthermore, in infrastructure-less peer-to-peer mobile networks, such as ad hoc, delay tolerant (DTNs) or sensor networks, cooperation, and subsequently trust is imperative to the construction and operation of the network. Without cooperation and trust these networks would fail. With trust, several potential applications can be enabled including mobile social networking, building groups and communities of interest, localized alert and emergency notification, context-aware and similarity-based networking [1], to name a few. This study addresses the issue of trust advisory and establishment in mobile networks, with application to infrastructure-less wireless ad hoc networks, including DTNs. We utilize encounters in mobile societies in novel ways, noticing that mobility provides opportunities to build proximity,
location and similarity based trust. Each mobile device running our trust application shall keep simple history of other devices encountered (e.g., using existing neighbor discovery) and (if applicable) the location of the encounters (e.g., using GPS or access point association history). Four new so-called trust advisory filters are introduced to analyze the encounter and location history, including: 1. encounter frequency (F E) based filter, 2. encounter duration (DE) based filter, 3. encounter location based behavior-vector (BV ) filter based on - Count and Duration, and 4. location preference based behaviormatrix (BM ) filter. Each trust advisory filter provides a score reflecting the level of trust identified by our system, to aid the users in identifying potential trustworthy nodes in the network. The filters calculations are done in a fully distributed fashion that obviates the need for any server or trusted third party. Ultimately, an application with these filters shall provide the user with an option to choose trustworthy nodes in coordination with personal preferences, location priorities, contextual information, or encounter-based keys, as explained in Section V. The trust advisory filters are analyzed and evaluated over an extensive set of real-world traces collected from a major university, including over 35,000 users and spanning 12 weeks. Two sets of statistical analyses are performed. The first examines the underlying encounter relationships in mobile societies, including distribution of encounter frequency, duration, similarity scores based on location vectors and matrices, and the differences (and similarities) between the various proposed filters. The second evaluates DTN routing in mobile peerto-peer networks using trust and selfishness models, where epidemic routing is used to analyze the characteristics of the dynamic encounter graph. We find that for the analyzed trace, three filters (DE, F E, and BV -Count) create trust lists that remain consistent (with 90% overlap) for more than 9 weeks. Thus the results from these filters are stable. Initially, all the filters were expected to produce similar results in terms of recommended trusted nodes, but the results showed noticeable differences in the selection. Surprisingly, despite these differences the overall performance of epidemic routing based on the different filters (or even random selection) were found to be similar. This suggests that our methods for trust advisory can indeed provide the users with trust options without the sacrifice of performance in the context of DTNs. We note from the
trust and selfishness modeling that having trusted nodes as recommended by the trust filters largely eliminates the effect of selfishness in the network. The use of trust filters decreases the unreachability in the selfish network (from 0.146 at selfishness probability (S)=0.8 and trust (T )=40% to 0.122 using FE filter when 0.109 is the unreachability in network with no selfishness). To sum, the main contributions of this paper include: 1- The proposal of a trust advisory framework that utilizes mobile encounter characteristics, evolution and locations, 2- The introduction of four specific trust advisory filters based on encounter frequency, spatio-temporal statistics and similarity scores. The filters were evaluated using extensive mobile network traces from a university campus, compared and contrasted. 3- Performance of epidemic routing, in the context of DTN, was analyzed for the various trust advisory filters in conjunction with selfishness models. It was found that our trust advisors can indeed be utilized in DTN without adversely affecting the network performance. We note that our framework of establishing trust incrementally over a time window can be extended to include encounter-based keys [2], [3], using out of band exchange and to scenarios where trust evolves - strengthens or dissolves - over time. The studies conducted here focus on trust establishment to aid network connectivity and interaction, after which incentive [4], [5] and reputation [6] systems may be used to police, monitor and reward transfers. Our work is thus complimentary to, and can be integrated with, related work in these areas. Our future work shall investigate this direction further, in addition to analyzing other real-world traces from other contexts, and implementing, deploying and monitoring the trust advisory application in a test-bed. Following is an outline for the rest of this document, Section II discusses related work. Section IV provides overall motivation for using encounters. Section V introduces the trust advisory filters. Section VI provides the analysis of the filters using mobile network traces. Section VII analyzes performance of epidemic routing using trust and selfishness. Section VIII provides future work, applications and conclusion. II. R ELATED W ORK In this section, we discuss some of the recent work being done to establish trust and cooperation in the delay tolerant networks, which is a critical aspect in networks to communicate and deliver information. Several researchers have proposed novel approaches to establish trust and cooperation in mobile ad hoc and delay tolerant networks using credit and reputation based schemes, incentive and trust based schemes, game theory and efficient routing based algorithms. The reputation based scheme targets better peer selection based on previous interactions records and transfer, thus providing trust ratings and cooperation to nodes in a mobile adhoc network. In [6] a node detects misbehavior locally by observation and use of second-hand information, in [7] propose a fully distributed reputation system that can cope with
false disseminated information where each node maintains a reputation rating and a trust rating about other nodes. In [8], [9], [10] analysis of rewards provisions and punishment is conducted based game theoretic approaches to provide incentives for message delivery. In [11], authors derived performance and optimization statistics to measures the success in delivery probability for a message covering both cooperative and non cooperative scenarios. The study in [12] analyzed the effect of cooperation on three different routing algorithms. The authors investigated the performance of epidemic, twohop relaying and binary spray and wait routing to model a node’s cooperation probability to either drop a message or to forward the message to next hop level. However, these works focus mainly on limited size topology implementation, for only in particular scenarios. The routing and message delivery work do not address social trust development and cooperation in DTNs, which we focus on in this study based on historical events and incremental build-up of social parameters based on node encounters. The incentive based credit schemes rank the trust on neighboring nodes, in [13], authors proposed a game-theoretic model to discourage selfish behavior and stimulates the cooperation by leveraging Nash equilibria with socially optimal behavior, while in [4], authors proposed a pricing mechanism to give credits to the nodes who participate in message forwarding mechanism. However, in these, the cooperation is developed based on the number of messages transfered rather than socially acceptable criteria of encounter analysis. Message delivery mechanisms in DTN require node collaboration. However, in real deployment some nodes may refuse to cooperate. Such selfish nodes (or free riders) [14] could exploit the services by receiving the messages from other nodes but refusing to deliver it to next hop level. An analytical model that builds the concept of trust is discussed in [15], [16]. The authors show trust supports cooperation and is heavily based on the interactions and bonds that govern behavior in ad hoc and opportunistic scenarios. Other approaches discussed in [17], [2], [18] propose explicit authentication mechanism to generate trust and cooperation in network. These approaches are better modeled for small group deployments [17] and requires to exchange public keys and the installation of the private key on the users device [2]. They do not address some of issues of selfish nodes, scalability and overhead incurred due to the key exchange and global optimization. III. T RACES U SED For the purpose of this study we have used 3 month long (Sep to Nov 2007) Wireless LAN (WLAN) traces coming from University of Florida, Gainesville. More than 35,000 users who accessed the WLAN during this period have been considered in the study. Total number of Access Points is over 730. The information provided in the traces is anonymized. Tab. I shows a sample of the traces used in this work.
MAC 00:11:22:33:44:55 11:22:33:44:55:66 01:02:03:04:05:06 10:20:30:40:50:60 11:22:33:44:55:66
01 01 01 01 01
Jun Jun Jun Jun Jun
Start Time 2008 21:00:51 GMT 2008 21:01:30 GMT 2008 22:11:00 GMT 2008 22:15:30 GMT 2008 22:23:10 GMT
Duration(sec) 3000secs 10secs 200secs 600secs 180secs
AP/Location CS buildingAP1 ECE buildingAP2 MSL buildingAP1 MACA buildingAP1 CS buildingAP3
TABLE I S AMPLE WLAN TRACE
the time spend at different locations. Behavior-Matrix and Behavior-Vector based approaches discussed below belong to the class of filters that can directly measure similarity. Following we introduce A. Frequency of Encounters, B. Duration of Encounters, C. Behavior Vector, and D. Behavior Matrix filters. A. Frequency of Encounters (FE)
IV. E NCOUNTER /P ROXIMITY
BASED
T RUST
The foremost purpose of this work is to encourage interactions in the mobile societies and establish network connectivity in the context of ad-hoc and DTN networks. Trust can be the foundation of cooperation in networks in general and particularly in the infrastructure-less networks. In our context trust means that a user is: 1. Willing to interact through the network with the trusted node, and 2. In the context of DTN, ready to accept a message for the trusted user and genuinely attempt to route it. To develop trust between a pair of users, we leverage interactions between users based on proximity (when the devices come within radio range) and encounter information. Several properties of nodal encounter behavior have been investigated in [19]. The primary reasons for choosing encounters and proximity as measure to generate trust comes from the work on Homophily [20]. The principle of Homophily states that people with similar interest meet and interact often. Trusting frequently encountered users would mean trusting people similar to oneself (like work colleagues or classmates). This trust can have social incentives too. The second reason for choosing proximity/encounter for trust is that because the users are within the radio range of each other (for Bluetooth it is ∼15m) they can exchange out-of-band information. This outof-band exchange can enable a user to know more about the other user and can also be used to set-up cryptographically strong secrets between them [2]. This feature of out-of-band information exchange is not possible on wired networks (as the two terminals may be geographically far apart) but can be easily leveraged by mobile peer to peer wireless networks. The challenge is to find methods that can successfully discover potential similarities between the users. We refer to these methods as Trust Advisors Filters. In the implementation, a user would actually decide on which users to trust and the filters would serve as an advisors. Thus users would have full control over the selection of trusted users. These filters would act as the recommendation system that recommends users who are most similar to the user. In the next section we present a rich set of filters that find users most similar to the user. V. T RUST A DVISER F ILTERS /M ETRICS This section presents a set of filters that capture similarity between two users. This similarity can be captured indirectly by using encounters and measuring metrics such as frequency of encounters, duration of encounters, etc. The similarity can also be captured directly by comparing the behavior profiles/preferences with another user such as by comparing
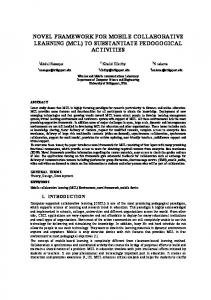
One of the basic filters to estimate similarity between a user-pair is the number of times they encounter (An encounter is defined as the event where a device is in radio range of another device such that it can discover the other device’s MAC address). The more they meet, the more similar (and are more trustworthy) they are. On this basis, we design the F E filter that counts the frequency of the encounters of the user with all the other users. To get the trust list from F E filter for a user, we sort all the encountered users by their number of encounters and select top users based on the trust (T ) value. The computational complexity of F E is O(N ) and space complexity is O(Nu ) per device, where N is the number of encounters and Nu is the number of unique users encountered. B. Duration of Encounters (DE) Another fundamental filter to estimate similarity is the percentage of time spend by the user with another user. The more the time spent together by the users, the more similar they are (and are more trustworthy) likely to be. On this basis we design the DE filter to keep count of the duration of time spent by a user with all the other users. From the ordered list of duration of encounters for the user, DE filter selects top trusted users based on the T value. The computational and space complexities for DE are similar to those of F E, computation complexity of O(N ) and space complexity of O(Nu ) per device. C. Behavior Vector (BV) An important characteristic of homophily is that similar people tend to go to similar locations. To capture this characteristic, we have designed a filter that stores location preferences of a user in a single dimensional vector. Each user maintains a single vector for oneself. The columns of the vectors represent the different location visited by a user and the values stored in each cell indicate either duration (BV − D) or count (BV − C) of the sessions at that particular location, depending on the type of BV used. To get similarity score between two users, they exchange the normalized BVs and compute the inner product of the two normalized BVs. The result of the inner product gives a score indicating the similarity between the two users. This score is higher if the two BV are similar and can be zero if the users do not have single visited location in common. Fig. 1 illustrates the design of a Behavior Vector. The space complexity of BV on each device is O(L + Nu ), where L is the number of unique locations visited by the user and Nu is the number of unique users whose similarity
( D F K �UR Z �UH S UH VH Q WV�WK H S H UF H Q WD J H �R I�WLP H �VS H Q W�D W�H D F K OR F D WLR Q �IR U�D �G D \ $ Q �H Q WU\ �UH S UH VH Q WV�WK H S H UF H Q WD J H �R I�R Q OLQ H �WLP H �G X ULQ J WLP H �G D \ �L�D W�OR F D WLR Q �M
Fig. 1.
Fig. 2.
scores are stored on the device. The computation complexity for computing similarity score for two BV of length L1 and L2 is O(L1 + L2). D. Behavioral Matrix (BM) We notice that for BV we maintain two vectors for duration and frequency to capture user behavior. A modification of vector into a matrix allows us to maintain a single entity to capture a spatio-temporal representation of user behavior. In this behavior matrix each column denotes a location and each row represents a single day (here the frequency is counted in terms of days). The value stored at each cell is the fraction of the on-line time spent by the user at a particular location on a particular day as shown in Fig. 2. To get the similarity score between two users, we compare the two matrices. This similarity has been exploited by the set of Profile-Cast protocols [1] and Behavior mining techniques [21]. To make the behavior similarity check efficient (in terms of space and computation complexity), we use the eigen values of the behavior matrix for exchange between the two users. The eigenvalues are generated using SVD (Singular Value Decomposition). SVD is applied to a behavior matrix M , such that: (1)
where a set of eigen-behavior vectors, v1 , v2 , ..., vrank(M) that summarize the important trends in the original matrix M can be obtained from matrix V , with their corresponding weights, wv1 , wv2 , ..., wvrank(V ) calculated from the eigenvalues in the matrix Σ. This set of vectors is referred to as the behavioral profile of the particular user, denoted as BP (M ), as they summarize the important trends in user M ’s behavioral pattern. The behavioral similarity metric between two users’ association matrices A and B is defined based on their behavioral profiles, vectors ai ’s and bj ’s and the corresponding weights, as follows: X
X
i=1
j=1
rank(A) rank(B)
Sim(BP (A), BP (B)) =
� �� �
�
�
[L� M � �
�
�
� �� º � »» � » » � » [ W � Q »¼
( D F K �F R OX P Q �F R UUH VS R Q G V�WR �D �OR F D WLR Q
Behavior Vector for a user
M = U · Σ · V T,
ª � �� «[ « � �� « � « « � « [ W �� ¬
2 IILF H
' R UP
wai wbj |ai · bj | (2)
which is essentially the weighted cosine inner product between the two sets of eigen-behavior vectors. The space complexity of BM filter is O(DL) per device, where L is the number of locations visited and D is the number of days included in the matrix. Computation complexity of SVD is O(D2 L + DL2 ).
Behavior Matrix for a user (from [1])
If we compare F E and DE filters with BV and BM , we find that BV and BM require information exchange between two users to calculate similarity. Since a user has to depend on information provided by another user, issues of data authenticity and privacy become important along with the additional costs incurred in communication for the transfer of vectors and matrix. To maintain authenticity of the data, several techniques have been proposed that use Trusted Platform Module (TPM) [22], [23], this module maintains the integrity of the sensed data. To lower the communication costs in BM , one can only send top 5 to 10 eigen values as it has been shown these can capture 90% of the user behavior [1]. E. Random Trust (RT) This filter as the name suggests selects T percent of encountered users randomly and adds them to the trust list, we use this filter for comparison purposes. Ideally, we would never want to refer to the advise by this filter, but we have kept it here to later study the impact of each filter with respect to random selection. We note that for each filter the user may also choose to have a lower threshold for selecting users before they are considered by the filters. For example, in F E filter the user may not want to consider users who have less than 2 encounters. However, due to lack of space we are not presenting the analysis using thresholds. VI. S TATISTICAL A NALYSIS
OF
T RUST F ILTERS
Trust adviser filters need information about previous encounters (history of encounters) to produce trust lists. In this section we conduct statistical analysis to investigate trust list’s stability with time, similarity between the trust list generated by the filters, and encounter similarity. This analysis can give us insight into the requirements and benefits of filters. For all the following analysis we use the WLAN traces. A. Encounter and Similarity Statistics To use a filter, it is necessary to know if the filter is going to give any results at all and would it be able to distinguish the users for trust advising. In this section, we present evaluation of the proposed filters. 1) FE: Fig. 3 illustrates encounters per user for the month of Nov 2007. The figure shows that out of the total population, 3,000 users have more than 1,000 encounters each in a month and more that 15,000 users (more than 2/3 of the population) have over 100 encounters. This result shows that users have
100,000
1000000
100000
1,000 User Pairs
Number of Encounters
10,000
100
10000
1000
10
1
100
0
5,000
10,000
15,000 Users
20,000
25,000
0.0
30,000
0.2
0.4
0.6
0.8
1.0
Similarity Score
Fig. 3. Encounters per user in the month of Nov 2007 (ordered in terms of Encounter Frequency)
Fig. 5. Similarity score using Behavior Vector-Duration(BV − D) filter for all the encountered pairs of users in Nov 2007
100,000
1000000
1,000 100000
User Pairs
Average Encounters Duration(in sec)
10,000
100
10000
10 1000
1
0
5,000
10,000
15,000 Users
20,000
25,000
30,000
100 0.0
0.2
0.4
0.6
0.8
1.0
Similarity Score
Fig. 4. Average Duration of Encounter per user in the month of Nov 2007 (ordered in terms of Duration of Encounter) Fig. 6. Similarity score using Behavior Matrix (BM ) filter for all the encountered pairs of users in Nov 2007
significant number of encounters and it justifies our use of F E as a trust filter. 2) DE: Fig. 4 illustrates the average duration of encounters for Nov 2007. We notice that average encounter duration for more than 20,000 users is greater than 1,000 seconds. This justifies the use of DE as a trust filter. 3) BV: Fig. 5 illustrates the similarity score between all the pair of users who encountered at least once in the month of Nov 2007. Large number of user pairs have low similarity (close to zero), which may mean that most of the users are not similar to each other and few user pairs have very high similarity scores. Results for BV − C are similar to BV − D (Fig. 5). 4) BM: BM similarity score like BV is close to zero for most of the user pairs and is high for a very few user pairs. This is illustrated in Fig. 6. This implies that BM scores would be able to distinguish between the users. B. Stability Analysis How the trust list grows and evolves over time can provide insight into the stability of the trust list. One can also decide based on the stability how much history to have before one gets suitable recommendations. For this analysis, we compare the list of trusted nodes at various lengths of history with trust (T ) value set at 40%. Fig. 7 shows the stability of the various trust filters. We use 9 weeks long WLAN traces (Sep
to Nov 2007) for the analysis. Except for the BV −D metrics, all the other metrics show high similarity with trusted list of previous months. For DE, F E, and BV − C the similarity between list for 1 week and 9 weeks is more than 89%. This implies that nodes trusted by DE, F E, and BV − C using 1 week of history may still be trusted when considering 9 weeks of history with the probability greater than 89%. This also implies that DE, F E, and BV − C produce stable lists. This stability can be attributed to the fact that user encounters patterns captured by these three filters are inherently stable. BM filter shows high stability in terms of trust list when the difference in history is less than 2 weeks (>80%) and the stability goes down to 55% for the 1 week of history when compared to 9 week of history. For the BV − D filter, the similarity between any list is around 40%. This implies that every week the list changes by 60%. This may point to a possibility that users go to same places regularly (by stability in BV − C) but may spend different amounts of time at the same place over the weeks. This can cause BV −D filter to pick different users in different length of behavior history. Overall, we note that some filters (DE, F E, and BV − C) stabilize in just one week of history. These filters can be a good choice for recommendations when trust history is short
100
98
98
96
96
96
94
92
90
Similarity Percentage
100
98
Similarity Percentage
Similarity Percentage
100
94
92
90 1 Week 2 Week 3 Week 4 Week 5 Week 6 Week 7 Week 8 Week 9 Week
88
86 1
2
3
4 5 6 Length of history in weeks
7
8
86 1
2
3
4 5 6 Length of history in weeks
7
8
1 Week 2 Week 3 Week 4 Week 5 Week 6 Week 7 Week 8 Week 9 Week
88
86 9
1
B. Frequency of Encounter (F E)
A. Duration of Encounter(DE) 100
2
3
4 5 6 Length of history in weeks
7
8
9
C. Behavior Vector using (BV − C)
100 1 Week 2 Week 3 Week 4 Week 5 Week 6 Week 7 Week 8 Week 9 Week
90
90
80 Similarity Percentage
80 Similarity Percentage
92
90 1 Week 2 Week 3 Week 4 Week 5 Week 6 Week 7 Week 8 Week 9 Week
88
9
94
70
60
50
70
60 1 Week 2 Week 3 Week 4 Week 5 Week 6 Week 7 Week 8 Week 9 Week
50
40
40
1
2
3
4 5 6 Length of history in weeks
7
8
9
1
2
D. Behavior Vector using Duration (BV − D)
3
4 5 6 Length of history in weeks
7
8
9
E. Behavior Matrix (BM )
Fig. 7. Comparison of trust list belonging to different history for various filters at T=40% (note that the y-axis scale for DE, F E, and BV − C starts at 85% and for BV − D and BM the scale starts at 35%)
80
and the time interval between trust list generation can also be long. For BV − D filter we would have to redo the trust list every week as the stability is comparatively low.
70 65 Similarity Percentage
C. Correlation Between filters It is important to study the differences between the trust list obtained from different filters over different length of traces (history). A smaller number of differences between a pair of filters would mean a stronger correlation between them and depending on the value it may make one filter redundant. On the other hand a large difference points to the orthogonality in the selection of users made by the filters. Fig. 8 plots the results of comparing DE, F E, BV − C, BV − D, and BM filters. For these results, we have set trust at T = 40%. The results show comparison of top T = 40% users given by the filters. Fig. 8 also presents the effect of history of each filter on every other filter. For example, in F E vs DE curve, we compare lists produced by F E filter using history of 1 to 9 weeks with the DE filter. We observe that BV − C and BV − D have the maximum similarity (>65%) and minimum similarity between the users is seen in the comparison of BV − D (or BV − C) with BM . We also notice that with time similarity between F E (or DE) and BM increases. If two filters recommend different sets of trustworthy users, the user can be recommended with a richer set of users to trust. If in future, we use a self-learning recommendation system, based on previous selection of users, it can choose the filter that matches closely to the users choices. Similarly, if two filters present similar set of users, depending upon the space and memory requirements one of the filters may be removed.
BV-C vs BM BV-D vs BM BV-D vs BV-C FE vs BM FE vs BV-C FE vs BV-D DE vs BM DE vs BV-C DE vs BV-D DE vs FE
75
60 55 50 45 40 35 30 25 1
2
3
4 5 6 Length of history in weeks
7
8
9
10
Fig. 8. Comparison of similarity between trust lists generated by various filters at T=40%
VII. E FFECT OF T RUST
AND
S ELFISHNESS
In the previous sections we saw how trust can be developed in an infrastructure-less p2p network. In this section, we induce trust (using the filters) into a network with selfish nodes and analyze the effect on connectivity of the graph. The aim of this exercise is to study how trust can overcome disruption in connectivity of a network due to selfishness. For this analysis we use Epidemic routing [24]. Epidemic routing floods messages in time and space. The sender forwards a copy of the message to every encountered node that did not already receive the message. All these encountered nodes in turn forward a copy of the message to all the
encountered nodes that did not already receive the message and so on. Epidemic routing maximizes the message delivery rate and minimizes the message delay. Epidemic routing in sense of message delivery success and message delay provides an upper bound on performance, i.e., no other routing protocol can provide better delivery rate or lesser delivery delay. This property allows us to use epidemic routing as a tool or benchmark to measure the dynamic connectivity of the encounter graphs with varying trust and selfishness. Before coupling trust and selfishness, we look at the effects on the dynamic encounter graphs by the selfishness of the network nodes only. This analysis allows us to appreciate the effect of trust in the later part of this section. But before that we present the setup of our trace driven simulation. A. Trace-driven Simulation Setup For the simulation, we have used WLAN traces belonging to Sep, Oct, and Nov 2007. The epidemic routing is simulated only on the traces belonging to Nov 2007. Sep and Oct 2007 traces are used to develop the history database for various trust filters. The total number of users in Nov 2007 traces are 26,198. For epidemic routing, we have randomly selected 873 node as the sources (3.33% of the total nodes) and all 26,198 nodes act as receivers. For analyzing each instance of the simulation, performance of epidemic routing is measured in terms of Unreachability, Delay and Overhead. We define Unreachability as the number of nodes out of all receivers (for Nov 2007 there are 26,198 receivers) that could not be reached by a given source. Delay is defined as the ratio of average time taken by a message to reach all the possible receivers over the max delay possible (for Nov 2007 it is 30 days). Overhead is defined as the average number of hops a message took to reach all the possible receivers using the shortest path. In all the graphs, we have sorted the sources in the ascending order of the measured quantity. B. Selfishness In infrastructure-less networks, without any incentive to route messages, nodes may become selfish and refuse to accept/route messages. Since an infrastructure-less network fundamentally depends on the participation of network nodes in routing and message transfers, selfishness can break down the connectivity in the network. To model the effect of selfishness on the connectivity of the network, we test the performance of epidemic routing when the network has selfish nodes. We define selfishness of a node as a probability (S) with which the node will not accept packet/message from another node for forwarding (assuming that if a node accepts packet for routing it would sincerely route it). For example if S = 0.9, then a node would not accept packets from 9 out of 10 nodes in the network. Using this probability (S) in the simulation of epidemic routing, with uniform random distribution, we decide the nodes to which a particular node is selfish to. (We have not considered misbehavior of the nodes but there are several techniques available
to detect misbehaving nodes [15], [25]. These techniques can be combined with our work.) Fig. 9 shows the effect of selfishness with varying S on the performance of epidemic routing in terms of unreachability, delay and overhead (hops per path). Looking at unreachability, we observe that it increases non-linearly with increase in S values. The average unreachability from S = 0 to S = .97 increases 4 times (1.6 times at S = 0.8). Understanding delay requires us to understand how delay is calculated. Delay is only calculated for nodes that were reachable. So as the S increases, less number of nodes are reachable and only these nodes are considered for delay calculations. Therefore we notice that delay decreases as S increases because the reachability is decreasing. This is evident by the observation that as S increases, increasing number of sources (12% at S = 0.97) report zero delay, indicating zero or very small reachability. Overhead measurement also reports overhead for the nodes that are reachable. We can see that with increase in S the overhead increases as the messages have to take more hops to reach a receiver. As the case with delay, in overhead too the increase in S increases the number of sources which have very low hop count (mostly zero). This low count again points that several of sources (12% at S = 0.97) are unable to transfer messages to any receiver with increase in S. The results show that selfishness in a network severely impacts the connectivity in the graphs. The increase in selfishness increases the network partitioning. More than 12% of the users may not be able to transfer message to any user if S > .97 and unreachabilty increases 4 times. C. Effect of Trust Selfishness adversely impact connectivity in an encounter graph. To offset the impact, we propose the use of trust built upon interactions and similarity between the users. This section presents the impact of using trust on the connectivity in the encounter graph. We again use the epidemic routing as the tool for evaluation of network connectivity. Trust between a pair of user is generated using the trust filters developed in Sec. V. The filters select users based on homophily and interaction. To derive trusted users for the experiment we select top T percent users based on the filters (For example, if T = 40% and we are using F E filter for a user A, then we would order all the users based on the number of encounters with A in decreasing order and select 40% of those from the top as trusted users). In a practical implementation, users would have individual control on how many and which users to trust, but for the simulation, we assume that higher similarity (via trust filter) means greater homophily and thus greater trust between them. Once a user is considered trusted by a node, the node would accept all packets from this user and attempt to route them, regardless of the selfishness (S). This condition is analogous to the fact that a user in real life may not be selfish to a person he/she knows as opposed to a stranger. Fig. 10 shows the flow chart that a user’s device may use before accepting and routing packets from another user. Here, an incoming message is
Unreachability at S (several) and T=0%
Delay at S (several) and T=0%
1
Overhead at S (several) and T=0%
0.9
35 S=0.00 S=0.10 S=0.30 S=0.50 S=0.70 S=0.80 S=0.83 S=0.85 S=0.87 S=0.90 S=0.93 S=0.95 S=0.97
0.8 30 Overhead - Average Hops per receiver
0.1
0.6
Delay
Unreachability Ratio
0.7
S=0.00 S=0.10 S=0.30 S=0.50 S=0.70 S=0.80 S=0.83 S=0.85 S=0.87 S=0.90 S=0.93 S=0.95 S=0.97
0.01
0.5 0.4
S=0.00 S=0.10 S=0.30 S=0.50 S=0.70 S=0.80 S=0.83 S=0.85 S=0.87 S=0.90 S=0.93 S=0.95 S=0.97
0.3 0.2 0.1
0.001 100
200
300
400 500 Sources
600
700
800
900
Metrics Weights Selector
100
200
300
400 500 Sources
600
700
800
900
0
100
200
300
400 500 Sources
600
700
800
900
C. Overhead
Unreachability, Delay and Overhead at several S and T=0%, during trace period of Nov 2007
Message
Not Trusted
Selfish Filter (User Specified S)
Accept/Send
DTN Routing Engine
Accept/Send
Do not accept Stop
Fig. 10.
10
B. Delay
Trust Generator Engine
Sender’s score over all metrics
15
0 0
A. Unreachability Fig. 9.
20
5
0 0
25
Flow chart for making routing decisions
processed by the Trust Generator Engine. This engine checks if the message is from a trusted node (information given by trust filters) and accepts the message if the node is trusted otherwise it is sent to the Selfish Filter. This selfishness filter stores userspecified selfishness probability and with this probability it decides whether to accept the message or reject it. The trust lists are updated once a week, this can be justified (and is also realistic) as calculation of filter list after every encounter or even every day may occupy computational resources of the devices especially since many of the filters are stable. The comparison and stability with time is presented in previous section. For the simulation, filters bootstrap with two months of history and the trust lists are updated weekly. Fig. 11 shows the effect of trust on the performance (thus connectivity) when nodes are selfish. The trust value is fixed to T = 40% and S = 0.8. (We have performed several experiments like varying trust and history on all the filters, but due to lack of space we are presenting limited set of results.) We observe that the presence of trust improves the performance of the network. The average unreachability goes down from 0.146 to 0.122 (from S = 0.8 and T = 0% to S = 0.8 and T = 40% (F E)), where as the average unreachability at S = 0.0 and T = 0% (no selfishness) is 0.109. The unreachability at S = 0.8 and T = 0% is 33% more than the network with no selfishness, the trust reduces this unreachability to 11% more than the network with no selfishness. We observe that RT filter performs marginally
better in terms of improvements in the reachability. This may be because RT selects users randomly which may be providing shortcuts in the encounter graph. All the filters show similar performance for unreachability. The Delay graph (Fig. 11B.) shows that the delay decreases with selfishness, this is because the connectivity goes down with selfishness and thus the time taken to reach the reachable nodes also decreases. So delay may not give correct information, but we can argue that adding trust is moving the delay towards the scenario where the network has no selfishness. The Overhead graph (Fig. 11C.) shows trends similar to unreachability. All the filters provide similar performance. Tab. II provides average of unreachability, delay and overhead for all the filters. F E filter performs the best (apart from RT filter). However, both BV − C and BV − D perform slightly inferior to DE and F E. Filter S=0.0 & T=0% S=0.8 & T=0% DE FE BV-D BV-C BM RT
Unreachability 0.108998 0.145975 0.125623 0.121892 0.125686 0.125686 0.12458 0.119043
Delay 0.707754 0.688934 0.695938 0.697582 0.695215 0.695215 0.696189 0.699930
Overhead 14.2889 15.4238 14.9732 14.8221 15.1567 15.1567 15.0937 14.8389
TABLE II AVERAGE U NREACHABILITY, D ELAY AND OVERHEAD USING VARIOUS FILTERS (S=0.8 & T=40%)
D. Trust and Selfishness To understand the effect of selfishness and trust on each other, Fig. 12 shows average unreachability, delay and overhead at multiple S and T values using DE filter (other filters give similar results). We observe that increase in trust (T ) reduces unreachability, delay and overhead regardless of selfishness (S). The effect of trust is higher when the selfishness in the network is high (the gradient of S = 0.9 is maximum between any two values of trust). This is a critical result since the utility of trust increases with the increase in
1
0.9
30
0.8 25
0.6
Delay
Unreachability Ratio
0.1
Overhead - Average Hops per receiver
0.7
0.5
0.4
0.01
0.3 S=0.0, T=00% S=0.8, T=00% DE FE BV-D BV-C BM RT
S=0.0, T=00% S=0.8, T=00% DE FE BV-D BV-C BM RT
0.2
0.1
0.001 100
200
300
400 500 Sources
600
700
800
900
15
10 S=0.0, T=00% S=0.8, T=00% DE FE BV-D BV-C BM RT
5
0 0
20
0 0
100
A. Unreachability
200
300
400 500 Sources
600
700
800
900
0
100
200
B. Delay Fig. 11.
400 500 Sources
600
700
800
900
C. Overhead
Unreachability, Delay and Overhead for all filters at S=0.8 and T=40%
selfishness of the network. The more is the selfishness, the more is the value derived from trust. Similarly, we notice that for S = 0.1 to 0.4 (a low value of selfishness) where increase in trust does not affect the connectivity in the network in a major way. So, trust is useful mainly in the networks with high selfishness (S > 0.4). We also notice that maximum change happens in unreachability, delay and overhead at T = 20% from T = 0%. For this reason we have selected S = 0.8 in the previous experiment as it serves as a middle ground. In this section we observed how selfishness can affect the connectivity in the encounter graphs. We also observed that using the trust list created by the trust advisor filters the effects of selfishness can be reduced. VIII. C ONCLUSIONS
300
AND FUTURE
W ORK
In this work we discuss novel methods that can convert social interactions and similarities into trust for cooperation in mobile adhoc and DTN. We propose several trust advisor filters that can measure similarity between two users. We perform statistical studies to capture the properties of the filters. We find that several filters produce trust list that are stable for more than 2 months. We note that results of different filters are noticeably different and thus are capable of providing a rich selection to the user. Our paper also examines effects on network connectivity due to selfishness in the network using real WLAN traces. Selfishness adversely affects the reachability and partitions the connectivity graph. Unreachability increases by 150% as the selfishness reaches S = 0.8. We also analyze the effects of having trusted nodes in a selfish network. We note that having trusted nodes increases the connectivity and thus the reachability in the network with selfish nodes. At trust of T = 40% in a selfish network (S = 0.8) the unreachability remains at 120% of the levels of a network with no selfishness. We note that in a selfish network if the nodes trust the nodes that are similar to themselves, the effect of selfishness in the network can be drastically reduced. A major application of this work is to serve as a guide to applications running on a mobile devices in making routing and forwarding decisions, where presence of a node in the trusted list can increases the chances of message delivery. In the future, we plan to work on analyzing other trust filters. We would also like to implement a scoring/weight system
that can combine together the scores of all the filter for a encountered user. This score system would allow a user to consider single score before adding another user to the trust list. We would also like to design protocols that utilize the filters and implement these filters on a mobile device. R EFERENCES [1] W. Hsu, D. Dutta, and A. Helmy, “Profile-cast: Behavior-aware mobile networking,” in Proc. IEEE WCNC, Las Vegas,NV, March 2008. [2] C.-H. O. Chen, C.-W. Chen, C. Kuo, Y.-H. Lai, J. M. McCune, A. Studer, A. Perrig, B.-Y. Yang, and T.-C. Wu, “Gangs: gather, authenticate ’n group securely,” in MobiCom ’08: Proceedings of the 14th ACM international conference on Mobile computing and networking, 2008. [3] J. Manweiler, R. Scudellari, and L. P. Cox, “SMILE: encounter-based trust for mobile social services,” in CCS ’09: Proceedings of the 16th ACM conference on Computer and communications security. New York, NY, USA: ACM, 2009, pp. 246–255. [4] S. Zhong, J. Chen, and R. Yang, “Sprite: A Simple, Cheat-Proof, CreditBased System for Mobile Ad-Hoc Networks,” in Proceedings of IEEE INFOCOM, 2002. [5] L. Buttyn and J.-P. Hubaux, “Nuglets: a virtual currency to stimulate cooperation in self-organized mobile ad hoc networks,” ETH, Tech. Rep., 2001. [6] S. Buchegger and J.-Y. Le Boudec, “Self-Policing Mobile Ad-Hoc Networks by Reputation,” IEEE Communication Magazine, vol. 43, no. 7, p. 101, 2005. [7] A Robust Reputation System for Mobile Ad-hoc Networks, 2003. [8] V. S. Pavan, V. Srinivasan, P. Nuggehalli, C. F. Chiasserini, and R. R. Rao, “Cooperation in wireless ad hoc networks,” in In Proceedings of IEEE Infocom, 2003. [9] E. Altman, A. A. Kherani, P. Michiardi, R. Molva, P. M. , and R. M. , “Non-cooperative forwarding in ad-hoc networks,” In Proceedings of the International Symposium on Personal, Indoor and Mobile Radio Communications (PIMRC, Tech. Rep., 2004. ¨ [10] J. Crowcroft, R. Gibbens, F. Kelly, and S. Ostring, “Modelling incentives for collaboration in mobile ad hoc networks,” Performance Evaluation, vol. 57, no. 4, pp. 427–439, 2004. [11] E. Altman, “Competition and cooperation between nodes in delay tolerant networks with two hop routing.” in NET-COOP, ser. Lecture Notes in Computer Science, vol. 5894. Springer, 2009, pp. 264–278. [12] A. Panagakis, A. Vaios, and I. Stavrakakis, “On the Effects of Cooperation in DTNs,” in Communication Systems Software and Middleware, 2007. COMSWARE 2007. 2nd International Conference on, Jan. 2007, pp. 1–6. [13] L. Buttyan, L. Dora, M. Felegyhazi, and I. Vajda, “Barter-based cooperation in delay-tolerant personal wireless networks,” in World of Wireless, Mobile and Multimedia Networks (WoWMoM) 2007, 2007. [14] P. Michiardi, , P. Michiardi, and R. Molva, “Simulation-based analysis of security exposures in mobile ad hoc networks,” in in Mobile Ad Hoc Networks. European Wireless Conference, 2002. [15] S. Marti, T. J. Giuli, K. Lai, and M. Baker, “Mitigating routing misbehavior in mobile ad hoc networks,” in Mobicom. ACM, 2000, pp. 255–265.
0.2
0.71 S=0.1 S=0.2 S=0.3 S=0.4 S=0.5 S=0.6 S=0.7 S=0.8 S=0.9
0.19 0.18
0.7 15.4
15.2
0.69 0.685
0.14
0.68
0.13
0.675
0.12
0.67
0.11
0.665
0.1
0.66 T=0%
T=20%
T=40%
T=60%
T=80%
Trust
A. Unreachability Fig. 12.
T=100%
Overhead
0.16 0.15
S=0.1 S=0.2 S=0.3 S=0.4 S=0.5 S=0.6 S=0.7 S=0.8 S=0.9
15.6
0.695
Delay
Unreachability
0.17
15.8
0.705
15
14.8 S=0.1 S=0.2 S=0.3 S=0.4 S=0.5 S=0.6 S=0.7 S=0.8 S=0.9
14.6
14.4
14.2 T=0%
T=20%
T=40%
T=60% Trust
B. Delay
T=80%
T=100%
T=0%
T=20%
T=40%
Average Unreachability, Delay and Overhead at various values of T and S for DE filter
[16] P. Hwang and W. P. Burgers, “Properties of trust: An analytical view,” Organizational Behavior and Human Decision Processes, vol. 69, no. 1, pp. 67–73, January 1997. [17] Y.-H. Lin, A. Studer, H.-C. Hsiao, J. M. McCune, K.-H. Wang, M. Krohn, P.-L. Lin, A. Perrig, H.-M. Sun, and B.-Y. Yang, “Spate: small-group pki-less authenticated trust establishment,” in MobiSys ’09: Proceedings of the 7th international conference on Mobile systems, applications, and services. New York, NY, USA: ACM, 2009, pp. 1–14. [18] J. M. McCune, A. Perrig, and M. K. Reiter, “Seeing Is Believing: using camera phones for human authentication,” Int. J. Secur. Netw., vol. 4, no. 1/2, pp. 43–56, 2009. [19] W. jen Hsu and A. Helmy, “On nodal encounter patterns in wireless lan traces,” in IEEE Int.l Workshop on Wireless Network Measurement (WiNMee), 2006. [20] M. Mcpherson, L. S. Lovin, and J. M. Cook, “Birds of a feather: Homophily in social networks,” Annual Review of Sociology, vol. 27, no. 1, pp. 415–444, 2001. [21] W. Hsu, D. Dutta, and A. Helmy, “Mining behavioral groups in large wireless lans,” in MobiCom ’07: Proceedings of the 13th annual ACM international conference on Mobile computing and networking. New York, NY, USA: ACM, 2007, pp. 338–341. [22] A. Dua, N. Bulusu, W. chang Feng, and W. Hu, “Towards trustworthy participatory sensing,” in Proceedings of the 4th USENIX Workshop on Hot Topics in Security (HotSec 2009), 2009. [23] P. Gilbert, L. P. Cox, J. Jung, and D. Wetherall, “Toward trustworthy mobile sensing,” in HotMobile ’10: Proceedings of the Eleventh Workshop on Mobile Computing Systems and Applications, 2010, pp. 31–36. [24] A. Vahdat and D. Becker, “Epidemic routing for partially-connected ad hoc networks,” Duke University, Tech. Rep., 2000. [25] S. Tanachaiwiwat, P. Dave, R. Bhindwale, and A. Helmy, “Locationcentric isolation of misbehavior and trust routing in energy-constrained sensor networks,” in IEEE Workshop on Energy-Efficient Wireless Communications and Networks (EWCN), in conjunction with IEEE IPCCC, 2004, pp. 14–17.
T=60% Trust
C. Overhead
T=80%
T=100%