reverberation. Using a post-filter for separating coherent signals has also been studied [8]. The authors recently proposed PSD estimation in beamspace, a PSD ...
2014 14th International Workshop on Acoustic Signal Enhancement (IWAENC)
PSD ESTIMATION IN BEAMSPACE FOR SOURCE SEPARATION IN A DIFFUSE NOISE FIELD Yusuke Hioka
Kenta Niwa
Department of Mechanical Engineering University of Auckland Private Bag 92019 Auckland 1142 New Zealand
NTT Media Intelligence Laboratories NTT Corporation 3-9-11 Midori-cho, Musashino Tokyo 180-8585 Japan
ABSTRACT
framework generally consists of two procedures, beamforming followed by a post-filter. It has been shown that the minimum variance distortionless response (MVDR) beamformer [1] combined with the Wiener filter provides the optimal solution to the problem provided the minimum mean square error (MMSE) is used as the optimisation criteria [4]. Since the power spectral densities (PSD) of both the target signal and interference/noise are needed to calculate the Wiener filter, the problem of the post-filter design is in the estimation of those PSDs. In [5], the PSDs are estimated by assuming the noise observed by each microphone is spatially uncorrelated. Although this model well represents signals such as additive sensor noise, it is not quite effective in practical use since the ambient noise and reverberation are much more dominant compared to the sensor noise. Thus a method that applies diffuse sound field model [6] to the noise was proposed by McCowan et al. [7] because the model better agrees with the spatial characteristics of the ambient noise and reverberation. Using a post-filter for separating coherent signals has also been studied [8]. The authors recently proposed PSD estimation in beamspace, a PSD estimation method that is applicable even to the under-determined source separation problems [9]. This previous method estimates the PSD of sources using signals in the beamspace; it utilises the directivity gain of several different beamformers for estimating the PSD of sources located in different direction. Nevertheless, although the previous method was successful in separating coherent signals, the method did not take into account the incoherent noise in its modelling. In this paper an extension of the PSD estimation in beamspace which is able to separate the PSDs of both coherent signals and incoherent noise will be discussed. Note that the beamforming preceding the post-filter1 is not in the scope of this study, thus only the PSD estimation for calculating the post-filter is focused in this paper. The rest of this paper is organised as follows. In Section 2 the problem of this study including the modelling of the observed signals is defined, then the extension of the PSD estimation in beamspace is introduced in Section 3. Discussions with experimental results are presented in Section 4 and finally the paper is concluded with some remarks in Section 5.
An extension of the method for estimating the power spectral densities of both coherent signals and incoherent noise is proposed. The previous method utilised the different combination of the directivity gain, which is realised by applying several beamformings to the observation of a microphone array, in order to estimate the power spectral density of coherent signals. The extension introduces the diffuse sound field model in order to estimate the power spectral density of the incoherent noise as well as that of the coherent signals. Experiments for source separation and noise reduction prove the proposed method can accurately estimate the power spectral densities of both coherent signals and incoherent noise. Index Terms— microphone array, source separation, post filter, power spectral density, diffuse sound field, beamspace 1. INTRODUCTION Along with the increasing popularity of using hands-free audio interfaces for interacting with digital devices, quality of the acquired sound has become more critical in order to maintain favourable performance of the interfaces. Due to the high sensitivity of the microphones used in the interfaces, a sound source separation and/or noise suppression technology is imperative for acquiring the target speech with better quality. To this end, the use of microphone arrays has been attracting researchers and engineers for many years because of its ability to utilise the spatial information of the sound sources [1]. Beamforming [2] is a well-known technique that is used to generate a spatial directivity of a sensor array. Various beamforming algorithms have been proposed and applied to microphone arrays for the purpose of source separation and noise reduction in the last few decades [3]. Although beamforming is capable of retrieving sound signals arriving from a particular direction/position without causing nonlinear distortions, there are a few drawbacks which may be crucial in practical use. One of the drawbacks is its limited performance to incoherent noise which is often observed in practical scenarios as ambient noise, sensor noise, and reverberation. Another drawback is the maximum number of separable coherent signals achieved by conventional beamforming is bounded by the number of microphones used in the array. Due to cost, digital devices developed for commercial use are rarely equipped with many microphones. To overcome the limited performance of beamforming in practical use, a post-filter is applied to the output signal of the beamforming. This framework is known as beamforming with postfilter [4], which first appeared in the literature presented by Zelinski [5]. The
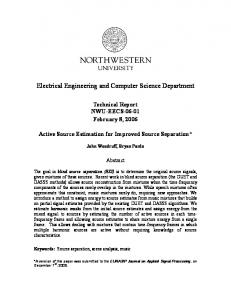
2. PROBLEM SETUP An M -sensors microphone array observes signals arriving from the N sound sources located at different angles θn in a noisy environment as depicted in Fig. 1. Assume that the aperture of the micro1 This
86
beamforming will be referred as main-path beamforming hereafter
2014 14th International Workshop on Acoustic Signal Enhancement (IWAENC)
Am,θn(ω)
S1(ω)
M
microphone array x
| | Law Square
y
H(ω)
| | beamforming
m
XM(ω)
Yl(ω)
φYl(ω)
z (n)
φV (ω)
PSD estimation
2
coherent sound sources
1
M
SN(ω)
Z (ω)
Y (ω)
(main-path) beamforming
+
θn
Sn(ω)
inverse FT
2
X1(ω) X2(ω)
Fourier Trans.
1
Wiener filter φSn(ω)
PSD estimation in beamspace
incoherent noise source
Fig. 2. Source separation by beamforming and postfiltering. Fig. 1. Sound observation using microphone array in noisy environment. 3.1. Beamforming and its output PSD Let L(> N ) different beamformers be applied to the microphone array observation. Given Wl,m (ω) is the weight of an arbitrary beamformer l for the microphone m, the output of the beamformer l is
phone array is small enough compared to the distance to the sound sources so that the plane wave model [2] can be assumed for the observation. Let Xm (ω) be the Fourier transform of the signal observed by the m-th microphone of the array where ω denotes the frequency. Xm (ω) is modelled by Xm (ω) =
N X
Yl (ω) =
M X
Wl,m (ω)Xm (ω)
(5)
m=1
Z Am,θn (ω)Sn (ω) +
n=1
Am,θ (ω)Vθ (ω)dθ,
(1)
=
θ
N X M X
Wl,m (ω)Am,θn (ω)Sn (ω)
n=1 m=1
where Am,θ (ω) denotes the transfer function from the angle θ to the microphone m, and Sn (ω) and Vθ (ω) are the spectra of the sound source n and the incoherent noise component arriving from the angle θ, respectively. A diffuse sound field model [6] is applied to the incoherent noise where an isotropic distribution of the sound energy can be assumed. Each of the signals included in (1) is assumed to be uncorrelated with each other, i.e. the following relationships hold E[Sn (ω)Sn0 (ω)] = 0 E[Vθ (ω)Vθ0 (ω)] = 0 E[Sn (ω)Vθ (ω)] = 0,
(n 6= n0 ), 0
(θ 6= θ ),
+
M X
Z Wl,m (ω)
m=1
=
N X
Am,θ (ω)Vθ (ω)dθ
(6)
θ
Z Dl,θn (ω)Sn (ω) +
n=1
Dl,θ (ω)Vθ (ω)dθ
(7)
θ
P where Dl,θ (ω) := M m=1 Wl,m (ω)Am,θ (ω) is the directivity function of the beamformer l to the angle θ. The PSD of the beamformer output can be easily calculated using (8), which can be approximated by (9).
(2) (3) (4)
φYl (ω) = E[|Yl (ω)|2 ]
where E[·] denotes the expectation operator. The source separation problem considered here aims at separating an arbitrary target source Sn (ω) from the remaining N − 1 interfering sources and the incoherent noise. Note that although the signals in the rest of this paper are represented in the frequency domain, a time-frequency representation should be used if the source signals are non-stationary.
≈
N X n=1
|Dl,θn (ω)|2 φSn (ω) +
(8) Z
|Dl,θ (ω)|2 φVθ (ω)dθ
θ
(9) Note the assumptions in (2) – (4) are used for the approximation from (8) to (9). With the diffused sound field assumption [6], the PSD of the incoherent noise can be represented by a constant value
3. PSD ESTIMATION IN BEAMSPACE FOR SOURCE SEPARATION IN A DIFFUSE NOISE FIELD
φVθ (ω) = φV¯ (ω) = const. ∀θ,
(10)
which will provide further approximation derived in (11)
The signal flow of the beamforming with post-filtering algorithm, in which the PSD estimation in beamspace is embedded, is summarised in Fig. 2. The beamforming with post-filtering consists of a mainpath beamforming, the Wiener filter, and a PSD estimation process. The PSD estimation in beamspace algorithm estimates PSDs for the Wiener filter calculation, which requires L beamformings besides the main-path beamformer. The details of the proposed PSD estimation algorithm, which is an extension of [9], is presented in the rest of this section.
φYl (ω) ≈
N X n=1
|Dl,θn (ω)|2 φSn (ω) + φV¯ (ω)
Z
|Dl,θ (ω)|2 dθ.
θ
(11) Equation (11) explicitly expresses that the PSD of the beamformers’ output can be approximated by the summation of the source PSDs multiplied by the directivity gain of the beamformers.
87
The output PSDs of the L different beamformers give the simultaneous equations R φ |D1,θ1 |2 · · · |D1,θN |2 θ |D1,θ |2 dθ S1 φY1 . . .. .. .. .. .. . .. = . . . . φS R 2 2 2 N φYL |DL,θ1 | · · · |DL,θN | |DL,θ | dθ θ | {z } | {z } φV¯ | {z } Φ (ω) D(ω) (12)
∆SINR [dB]
-10 proposed
-10
-6
0 (b)
10
20
-6
0 (c)
10
20
-6
0 Input SNR [dB]
10
20
previous
McCowan
(16)
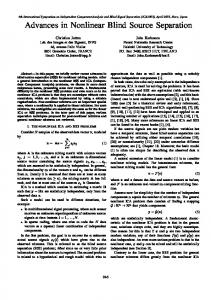
where t is the frame index. A uniform circular microphone array with the diameter of 4 cm was employed. Coherent signals observed by the microphone array were simulated by convolving speech signals with impulse responses corresponding to Am,θ (ω). The incoherent noise was generated by summing up independent Gaussian noise whose sources are located at every 1◦ from 0◦ to 359◦ in order to reproduce the isotropicity of the diffuse sound field. The input signal-to-noise ratio (SNR) was varied from −10 to 20 dB whereas the average power of all the coherent signals was equal in the observation. Monte Carlo simulation with 100 trials was conducted for each test using randomly selected source angles θn which were identically distributed from 0◦ to 360◦ . Because the performance of source separation achieved by the PSD estimation is the scope of this paper, only the effectiveness of the post-filtering was evaluated; i.e. the main-path beamforming was bypassed. The proposed method was compared to the previous method [9] which was intended to separate coherent interferences, and to the McCowan’s method [7] that assumed diffuse sound field for reducing incoherent noise. Improvement of three different metrics between the input and output signals was utilised for the evaluation: signal-to-interferenceplus-noise ratio (∆SINR), signal-to-interference ratio (∆SIR), and signal-to-noise ratio (∆SNR) [11]. ∆SINR represents the overall performance of a method whereas ∆SIR and ∆SNR represent only the performance of coherent source separation and incoherent noise reduction, respectively. Because of the different scopes of the previous and McCowan’s methods, ∆SIR was utilised to compare with the previous method whereas ∆SNR was used to compare with McCowan’s method. Fig. 3 shows the median and the mean deviation of the source separation performance for different input SNR in an ideally anechoic environment. The proposed method outperformed both the previous and the McCowan’s methods in terms of the overall performance (i.e. ∆SINR) unless the input SNR was extremely low (e.g.
where + and ˆ· represent the Moore-Penrose pseudo inverse and an estimated value, respectively. The novelty of this PSD estimation algorithm from the one in the previous study [9] is the introduction of the last (i.e. (N + 1)-th) column in D(ω) for estimating φV¯ (ω), which was derived by applying the diffuse sound field assumption to the incoherent noise (see (11)). 3.3. Post-filtering for source separation Finally the post-filtering is realised by applying the Wiener filter to the output signal of the main-path beamforming Y (ω) (14)
where the Wiener filter for separating the n-th source is derived by φˆSn (ω) . ˆ ˆ ¯ (ω) n=1 φSn (ω) + φV
-10 proposed
McCowan
φYl (ω, t) = (1 − α)|Yl (ω, t)|2 + αφYl (ω, t − 1),
Note that ω is omitted in (12) for the sake of brevity. The PSD of the coherent signals, i.e. φSn (ω) and that of the incoherent noise, i.e. φV¯ (ω) are estimated by solving the simultaneous equations using least squares as � −1 D (ω)ΦY (ω) (L = N + 1) ˆ S+V (ω) = Φ , (13) D+ (ω)ΦY (ω) (L 6= N + 1)
H(ω) = PN
20 15 10 5 0
previous
used for the PSD estimation. Parameters summarised in Table 1 were used unless otherwise specified. Due to the speech signals being non-stationary, the short-time Fourier transform was applied instead of the Fourier transform, and Welch’s method [10] was used for calculating the PSD of l-th beamformer’s output given by
ΦS+V (ω)
Z(ω) = H(ω)Y (ω),
20 15 10 5 0
(a) proposed
Fig. 3. Source separation performance in ideally anechoic noisy environment of different input SNR. Bars represent the median of: (a) ∆SINR (b) ∆SIR, and (c) ∆SNR. Error bars show the mean deviation from the median.
3.2. PSD estimation in beamspace
Y
20 15 10 5 0
∆SIR [dB]
Table 1. Parameters for simulation. Sampling frequency 16000 Hz Frame size 512 Frame shift (overlap) 256 FFT length 512 M 4 L 4 N 3 ϕ {20◦ , 110◦ , 200◦ , 290◦ } Input SNR 10 dB α 0.9
∆SNR [dB]
2014 14th International Workshop on Acoustic Signal Enhancement (IWAENC)
(15)
Finally the output signal of the source separation is produced by applying inverse Fourier transform to Z(ω). 4. EXPERIMENTAL RESULTS AND DISCUSSIONS For validating the benefit of the proposed extension of the PSD estimation in beamspace, some experiments were conducted by computer simulation. As in the previous study [9], delay-and-sum beamformers whose mainlobes were pointed to the set of angles ϕ were
88
(a)
120 100 80 60 40 20
0 0 2 4 6 8 10 12 14 16 18 average ∆SIR [dB]
shortest distance of source angles [deg]
shortest distance of source angles [deg]
2014 14th International Workshop on Acoustic Signal Enhancement (IWAENC)
(b)
120
to the performance of the proposed method. Further study should be conducted to mitigate the effect of reverberation.
100 80
5. CONCLUSION
60
The previously proposed PSD estimation in beamspace has been extended in order to achieve source separation in noisy environments. The extension utilises the isotropic distribution of incoherent noise which enables estimation of PSDs of both coherent interferers and incoherent noise. Experimental results have revealed that the proposed method is capable of reducing incoherent noise while separating coherent interferences. Further study is required for improving the performance of the proposed method in a highly reverberant environment. Evaluation in a practical environment including subjective testing of the sound quality is another remaining task.
40 20 0 0
2
4 6 8 10 average ∆SNR [dB]
12
∆SIR [dB]
20 15 10 5 0 20 15 10 5 0
∆SNR [dB]
∆SINR [dB]
Fig. 4. Distribution of the shortest distance of source angles against: (a) ∆SIR, (b)∆SNR.
20 15 10 5 0
(a) proposed
anechoic
0.14
(b)
previous
0.22
0.14
(c)
0.22
0.14 0.22 Reverberation time T60 [sec]
previous
0.35 proposed
anechoic
[1] M. Brandstein and D. Ward, Eds., Microphone Arrays: Signal Processing Techniques and Applications, Springer, 1 edition, June 2001. [2] D.H. Johnson and D.E. Dudgeon, Array Signal Processing: Concepts and Techniques, Prentice Hall, 1993. [3] G.W. Elko, “Microphone array systems for hands-free telecommunication,” Speech Communication, vol. 20, no. 34, pp. 229 – 240, 1996, Acoustic Echo Control and Speech Enhancement Techniques. [4] K.U. Simmer, J. Bitzer, and C. Marro, Microphone Arrays: Signal Processing Techniques and Applications, chapter 3, pp. 39–60, Springer, 1 edition, 2001. [5] R. Zelinski, “A microphone array with adaptive post-filtering for noise reduction in reverberant rooms,” in International Conference on Acoustics, Speech, and Signal Processing ICASSP-88., Apr 1988, vol. 5, pp. 2578 –2581. [6] H. Kuttruff, Room Acoustics, Applied Science Publishers LTD, fifth edition, 2009. [7] I.A. McCowan and H. Bourlard, “Microphone array post-filter based on noise field coherence,” IEEE Transactions on Speech and Audio Processing, vol. 11, no. 6, pp. 709 – 716, Nov 2003. [8] S. Fischer and K.U. Simmer, “Beamforming microphone arrays for speech acquisition in noisy environments,” Speech Communication, vol. 20, no. 3-4, pp. 215 – 227, 1996. [9] Y. Hioka, K. Furuya, K. Kobayashi, K. Niwa, and Y. Haneda, “Underdetermined sound source separation using power spectrum density estimated by combination of directivity gain,” IEEE Transactions on Audio, Speech, and Language Processing, vol. 21, no. 6, pp. 1240–1250, Jun 2013. [10] P.D. Welch, “The use of fast fourier transform for the estimation of power spectra: A method based on time averaging over short, modified periodograms,” IEEE Transactions on Audio and Electroacoustics, vol. 15, no. 2, pp. 70–73, Jun 1967. [11] M. Joho, H. Mathis, and R.H. Lambert, “Overdetermined blind source separation: Using more sensors than source signals in a noisy mixture,” in Proc. International Conference on Independent Component Analysis and Blind Signal Separation, 2000, pp. 81–86. [12] J.B. Allen and D.A. Berkley, “Image method for efficiently simulating small room acoustics,” The Journal of the Acoustical Society of America, vol. 65, no. 4, pp. 943–950, 1979.
0.35 proposed
anechoic
6. REFERENCES
McCowan
McCowan
0.35
Fig. 5. Source separation performance evaluated in simulated reverberant rooms. Bars represent the median of: (a) ∆SINR (b) ∆SIR, and (c) ∆SNR. Error bars show the mean deviation from the median.
input SNR: −10 dB). By looking at the comparison using ∆SIR and ∆SNR, the proposed method achieved the performance close to that of both the previous and the McCowan’s methods. These results lead to the conclusion that the proposed method succeeded in realising its aim; separating a target source from the interfering sources and the incoherent noise. The source separation performance was poor in some sets of the Monte Carlo simulation. These results were mainly cases where two or more coherent signal sources were closely located to each other. Fig. 4 shows the distribution of the shortest distance of source angles plotted against the source separation performance of the proposed method. An obvious trend can be seen for both ∆SIR and ∆SNR that the pairs of sound sources located in close angles were responsible for the degraded performance of the proposed method. Considering the median of ∆SIR and ∆SNR at the input SNR of 10 dB in Fig. 3, the sources of the coherent interferences should be located more than approximately 30 degrees apart from each other in order to realise a sufficient performance. Finally the effect of the reverberation to the source separation performance was evaluated. The image method [12] was utilised for simulating the impulse responses in a reverberant room whose size was 4.5 × 6.5 × 2.7 [m]. The reverberation time of the room T60 [6] was varied. Fig. 5 shows that the proposed method outperformed both the previous and the McCowan’s methods in terms of the overall source separation performance, i.e. ∆SINR. However, at the same time, obviously the reverberation had a detrimental effect
89