www.ccsenet.org/cis
Computer and Information Science
Vol. 4, No. 1; January 2011
PSO Clustering with Preprocessing of Data Using Artificial Immune System Ch.Suresh, E. Vinod kumar, L.v.v.r.k.Sriharsha & Suresh Chandra Satapathy Anil Neerukonda Insistute of Technology and Sciences Sangivalasa, Vishakapatnam district, AndhraPradesh, India E-mail: sureshchittineni,vinod.it64,harsha.lanka15,
[email protected] PVGD Prasad Reddy Professor, Department of CS&SE, Andhra University Engineering College Vishakapatnam, Andhra Pradesh, India E-mail:
[email protected] Abstract It has been proved by several researchers that particle swarm optimization has shown better results for clustering large datasets. In this paper we present a different approach to that of conventional particle swarm optimization technique. We have used aiNet algorithm of Artificial Immune System(AIS) to preprocess the data i.e. generating the antibodies with more affinity values among different datasets .The obtained result is given to PSO as centroids to get better intra cluster distance compared to that of randomly generated centroids. The comparisons reveal the superiority of AIS over PSO approach for data clustering. Keywords: Clustering,K-means, PSO, AIS 1. Introduction to clustering Data clustering is a process of grouping data into clusters so that data within a cluster have high similarity in comparison to one another but or dissimilar to data in other clusters. Clustering involves dividing a set of objects into a specified number of clusters. The motivation behind clustering a set of data is to find inherent structure in data and to expose this structure as a set of groups. Two basic approaches widely followed are “Partitioning Methods” and “Hierarchal Methods”. The partioning method partitions a collection of datasets into a set of non-overlapping groups and uses an iterative relocation technique to improve portioning. The hierarchal method works by grouping data into a tree of clusters. Strategies for hierarchical clustering generally fall into two types a) Agglomerative: This is a "bottom up" approach: each observation starts in its own cluster, and pairs of clusters are merged as one moves up the hierarchy. b) Divisive: This is a "top down" approach: all observations start in one cluster, and splits are performed recursively as one moves down the hierarchy. In this paper we have chosen the partioning approach for a study. There are several evolutionary techniques like Genetic algorithm (Bezdek et al 1994, Maulik et al 2000), Particle Swarm optimization (PSO) (Kennedy et al 1995) and the like for data clustering using partional approach. In all these techniques the initial centroids are chosen randomly from the investigated dataset or from the minimum and maximum values of the attributes of the dataset. These techniques are found to alleviate initial centroid choosing problem of popular K-means (Van der Merwe et al 2003) algorithm. However, the performance of GA and PSO can improved further if some amount of preprocessing is done while choosing the initial centroids for solving clustering problems. In this paper we present a different approach to that of conventional particle swarm optimization clustering (De Castro, L.N et al 2001) technique while choosing the centroids. In this, we used aiNet (De Castro et al 2002) algorithm of artificial immune system to preprocess the data i.e. generating the antibodies with more affinity values with different datasets .The obtained result is given to PSO as centroids so that we can obtain better intra cluster distance compared to that of randomly generated cluster distance within the upper and lower limits of datasets (De Castro, L.N et al 2001).The overall merit of our suggested approach can be seen in the gain in time i.e. the results have been obtained with less number of iterations compared to conventional PSO(De Castro, L.N et al 2001).
Published by Canadian Center of Science and Education
163
www.ccsenet.org/cis
Computer and Information Science
Vol. 4, No. 1; January 2011
The rest of the paper is organized as follows. Section2 gives a brief overview of aiNet data analysis. In Section 3 the PSO algorithm is described for clustering with the suggested preprocessing. Experimental results are given in section 4 and finally conclusion and future enhancements are briefly discussed in section 5. 1.1 aiNet- An AIS Method for Data Analysis The human body performs a variety of effective and powerful biological functions. Computer scientists have been exploring the mystery of these functions and they are applying their mechanism to learn algorithms. Neural networks and genetic algorithms are two such families of algorithms. A third yet new, family of biologically-inspired, learning algorithms, dubbed as artificial immune system(AIS)( De Castro et al 2002) has begin to draw people’s attention.AIS are computational systems, inspired by theoretical immunology and observed immune system functions. They have been successfully applied in various fields like engineering optimization problems, data mining problems, intrusion detection problems, bioinformatics problems etc (Timmis et al 2001, Knight et al 2001, De Castro et al 2002, Bezerra et al 2003, De Castro et al 2003). The aiNet is one such algorithm to data clustering (De Castro et al 2002).For completeness, the immune system principles involved by aiNet are first summarized in section 2.1 and aiNet algorithm in 2.2 1.1.1 Immune System principles The immune system is a complex of cells, molecules and organs that aim to protect the body against infection. In the presence of infection, antigens, the substances capable of simulating an immune response are generated. The immune system usually produces a group of B cells, which secrete antibodies. These antibodies can bind antigens and kill them. The affinity between antibody and antigen describes the strength of antibody- antigen interaction; the tighter it is the better it can bind the antigen to the antibody. The body employs a group of immune mechanisms that facilitate B-cell mechanism which in turn binds the antigen. The following sub sections cover a few principles that are exploited in aiNet. 1.1.1 a Clonal Selection & Affinity Selection The immune system generates many B-cells. The B-cell with the highest affinity towards a particular antigen is cloned. These cloned cells can easily bind the antigens, and are thus called memory cells. The cloning process of generating memory cells is called clonal selection. Memory cells do not have a long life time and are useful when infection occurs. The B-cells with lower affinity are either mutated or eliminated. Mutation process “customizes” the bound surface of B-cell to obtain comparative high affinity. This process is known as affinity maturation. 1.1.1 b Immune Network Theory The immune network theory indicates that interaction occurs not only between antibodies and antigens but also between antibodies and antibodies. Cells can connect with each other to form a network representing an internal image of original antigens. The network can have a positive or a negative response. A positive response results in cell proliferation. A negative response results in network suppression (De Castro et al 2002). 2. Immuned PSO approach for obtaining the optimized solution The following set of algorithms address the problem of obtaining the optimized solution in fewer number of iterations 2.1 The aiNet algorithm In the aiNet (U Maulik et al 2000, J Kennedy et al 1995) algorithm, each data point is treated as an antigen. The algorithm evolves with set of antibodies with best affinity values through a set of operations that include clonal selection, affinity maturation and the like. These antibodies construct a network which represents antibodies in a constructed way called aiNet model. The procedure of evolving antibodies (Ab) to represent antigens (Ag) is explained as follows. First they randomly generate a set of antibodies and put them in ‘M’ then follow the subsequent steps: a)
Affinity calculation: calculate the affinity between current Ag and each Ab from M
b) Clonal Selection: Select the subset of Ab’s with highest affinity and clone them. The clone size is proportional to the affinity of Ab’s i.e. higher the affinity more the cloning. c)
Affinity maturation: Mutate each Ab toward Ag with a rate inversely proportional to affinity.
d) Reselection: Calculate each affinity between each Ab and current Ag. Reselect the subset of Ab’s with higher affinity and discard the lower affinity ones.
164
ISSN 1913-8989
E-ISSN 1913-8997
www.ccsenet.org/cis
Computer and Information Science
Vol. 4, No. 1; January 2011
e)
Network Suppression: Remove redundan Ab’s and add the resulting Ab’s into M.
f)
Repeat (a)-(e) for each Ag. The memory matrix eventually contains the memory cells i.e. the Ab’s bind the Ag.
g) Suppress M: Remove the redundant Ab’s generated. h) Add new set of values i.e. Ab’s into M. i) j)
Repeat (a)-(h) until predefined number of iterations is reached. Repeat the predecessor steps for each cluster of antibodies up to n clusters
There are 4 tunable parameters of aiNet they are: ns: The number of Ab’s selected for cloning in step(b) σs: The suppression threshold for step(e) and(g) ζ: The percentage of reselected Ab’s for step (d) σd: The death rate which defines the threshold to remove the low-affinity Abs after reselection of step (d) In sum, the aiNet constructs a network of antibodies to represent original antigens. The rate of antibody population variation of network is proportional to the novel antibodies that are added in each iteration minus the death of low affinity antibodies in step(e) and step(g) plus the reproduction of high affinity antibodies(step(e) & step(g)) plus the reproduction of high affinity antibodies in step(2). The numbers of antibodies generated at the end are provided to the PSO as the set of centroids with n clusters. Below are the brief descriptions of the above procedures as an illustrative example. (1) Initially a set of antibodies is generated within the bound of antigens i.e. from the data set under investigation for n clusters. Each cluster contains m attributes tantamount to referenced dataset attributes. For example in Iris dataset each data object has 4 attributes so in our example the generated one also contains 4 attributes. The below given data is a set of antibodies for one cluster 6.4525 4.6657 4.5273 6.0943 7.0596 4.3535 4.3625 5.1785 6.6747 6.6742
4.2780 2.1568 2.6341 2.6972 3.5987 2.6917 3.9665 3.9728 2.5138 2.4401
2.7039 2.3824 6.8972 4.9693 1.7726 5.8187 4.6647 2.5530 4.5525 4.7556
2.2332 2.3394 0.6088 2.3992 0.3290 2.4652 1.4445 1.9087 1.5518 0.5087
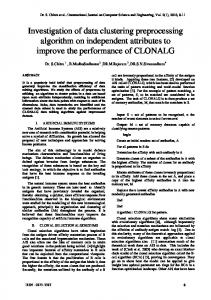
(2) The distance from each antigen to every antibody is calculated as per step (a) in Section 2.2 2.8755 2.7450 5.6093 4.3829 2.0013 5.0859 3.6012 2.1163 3.9010 3.8674 The above numerical values are the Euclidian distance from first antigen (i.e. objects from the dataset) to all antibodies generated above. This is repeated for antigens. (3) Sorting of antibodies having good values i.e. having less Euclidian distance and a subset is formed by taking values that are >1 and less than number of antibodies. These are shown in Figure 1 and Figure 2 as obtained after the experiments. (4) The Cloning of antibodies in proportional to the affinity i.e. higher the affinity more the closining as per step(b) of Section 2.2 If affinity value is 5.0859 then it is rounded to 5 and the respective antibody ( i.e. 4.3535 2.6917 5.8187 2.4652) is cloned five times. The example is shown below. 4.3535 2.6917 5.8187 2.4652 4.3535 2.6917 5.8187 2.4652 4.3535 2.6917 5.8187 2.4652 4.3535 2.6917 5.8187 2.4652 4.3535 2.6917 5.8187 2.4652 This process is repeated for all values.
Published by Canadian Center of Science and Education
165
www.ccsenet.org/cis
Computer and Information Science
Vol. 4, No. 1; January 2011
(5) Now each antibody is mutated towards antigen with the rate inversely proportional to affinity.This has been done to assure that antigen matures as per the step © in section 2.2. For example If antigen is: 6.4525 4.2780 2.7039 2.2332 and the Euclidian distance from antigen to cloned antibody say (5.1000 3.5000 1.4000 0.2000) is 2.8755. The mutation value is computed by dividing the computed affinity (i.e 2.8755) with the least attribute value in the cloned antibody i.e 2.2. Hence the mutation value is 1.3071 for the exapmle. This value is added to the cloned antibody to get 6.4071 4.8071 2.7071 1.5071. This process is repeated for each antibody. (6) Now the range of the antobody obtained using the above step is checked and restricted so that the affinity maturation never strays off the boundary. If it crosses the maximum value it is set as maximum and if it goes below minimum it is set as minimum value. For example if the value got is 7.963 2.563 0.0009 3.566 then it is changed to 7.900 2.563 0.010 3.566 (7) Now the process of reselection is started from (step (d) in section 2.2). In this again, the process of distance calculation is followed by removing the lower affinity ones and then selecting the subset. (8) In the the process of network supression from step (e) section 2.2 the redundant antibodies are removed so that only distinct antibodies remain. For example If their exists 6.4071 4.8071 2.7071 1.5071. 6.4071 4.8071 2.7071 1.5071. 6.4071 4.8071 2.7071 1.5071. The redundant ones are removed so that only one antibody exists with those values. (9) Repeat the steps from 2-8 are repeated so that antibodies that bind the antigens are obtained. (10) New antibodies are added until predefined number of iterations are reached . Finally, a set of of antibodies with high affinity values is got: 5.7820 3.2731 3.4987 3.4557 6.0342 4.8285 3.4087 2.7644 7.9000 4.1222 6.4377 2.1908 7.9000 4.5430 2.7169 1.2733 4.8622 4.2202 2.1927 0.1203 6.7808 2.9623 3.2395 2.2676 7.6961 3.1376 1.1048 2.0679 4.5066 2.2163 5.1103 0.4532 4.5073 2.1521 5.2647 0.1809 6.8046 2.5308 4.6898 1.3319 6.3725 2.6894 6.2668 0.3222 5.3529 3.9726 6.8647 0.2628 7.8031 4.2147 6.6565 1.4516 7.7219 2.7637 2.5688 0.2466 Similarly the above set of operations are followed for each individul cluster.If there exists n clsuters i.e. n times. 2.2 Particle Swarm Optimization and clustering Particle Swarm Optimization (PSO) is a population-based stochastic search process, modeled after the social behavior of a bird flock (De Castro et al 2001, De Castro et al 2002). The algorithm maintains a population of particles, where each particle represents a potential solution to an optimization problem. In the context of PSO, a swarm refers to a number of potential solutions to the optimization problem, where each potential solution is referred to as a particle. The aim of the PSO is to find the particle position that results in the best evaluation of a given fitness (objective) function. Each particle represents a position in Nd dimensional space, and is: “flown” through this multi-dimensional search space, adjusting its position toward both the particle's best position found thus far. and the best position in the neighborhood of that particle. Each particle i maintains the following information: xi : The current position of the particle;
166
vi : The current velocity. of the particle;
ISSN 1913-8989
E-ISSN 1913-8997
www.ccsenet.org/cis
Computer and Information Science
Vol. 4, No. 1; January 2011
yi : The personal best position of the particle.
Using the above notations, a particle’s position is adjusted according to ^ vi, k t 1 wvi, k t c1r1, k t yi, k t xi, k t c2r2, k t y k t xi, k t
xi t 1 xi t vi t 1
(1) (2)
r1, j t , r2, j t ~ U 0,1 and k=1,….., N d where w is the inertia weight, c1 , c 2 are the acceleration constants
The velocity is thus calculated based on three contributions: (1) a fraction of the previous velocity, (2) the cognitive component which is a function of the distance of the particle from its personal best position, and (3) the social component which is a function of the distance of the particle from the best particle found thus far (i.e. the best of the personal bests) The PSO is usually executed with repeated application of equations (1) and (2) until a specified number of iterations have been exceeded. Alternatively, the algorithm can he terminated when the velocity updates are close to zero over a number of iterations.
N c cluster centroid vectors. That is, each particle
In the context of clustering, a single particle represents the
xi is constructed as follows: (3) xi= ( mi1,…,mij,…..miNc) refers to the j-th cluster centroid vector of the i-th particle in cluster Cij. Therefore, a swarm where represents a number of candidate clusters for the current data vectors. The fitness of particles is measured using the intra cluster distance values. The lower the intra cluster distance, the fitter the particle. 2.3 PSO Cluster Algorithm Using the standard gbest PSO, data vectors can be clustered as follows: 1) Each particle is initialized to contain N c randomly selected cluster centroids. X11
X12
X13
- - - - - - - X1i- - - - - - X1m
X21
X22
X13
- - - - - - - X2i- - - - - - X2m
X31
X32
X33
- - - - - - - X3i- - - - - - X3m
|
|
|
-------
|
------
|
|
|
|
-------
|
------
|
Xn1 2) For
Xn2
Xn3
- - - - - - - Xni- - - - - - Xnm
do
(a) For each particle i do (b) For each data vector
zp
i) The Euclidean distance is calculated as ii)
z p is assigned to a cluster
d z p , mi, j
to all cluster centroids
with smallest Euclidean distance.
iii) The fitness (i.e. intra cluster distance) is calculated (c) The global best position and personal best position are updated (d) The cluster centroids are updated using equations (1) and (2) where t,,, is the maximum number of iterations. The population-based search of the PSO algorithm reduces the effect that initial conditions have, as opposed to the K-means algorithm by searching for multiple positions in parallel. However, it has been seen that the time taken to converge to optimal solution is very large and often it is trapped in local optima values. To overcome Published by Canadian Center of Science and Education
167
www.ccsenet.org/cis
Computer and Information Science
Vol. 4, No. 1; January 2011
these two difficulties a new approach of initializing the particles in Step 1 of PSO cluster Algorithm with aiNet approach has been suggested. In this approach, the initialization of particles is the output of the aiNet processing (as described in previous section). Due to the antibody effect to immunization the particles often initialized to better centroids as compared to conventional PSO clustering algorithm. The aiNet is used as a pre-processing step for PSO clustering. The results of a comparison of fitness values of various approaches in the next section demonstrate the effectiveness of our suggested approach on different datasets. 3. Experimental Results Experiments are conducted on various data sets namely iris, blood transfusion, breast cancer, all collected from UCI machine repository. The details of these datasets are presented in table 1. The whole experiment is carried out in two phases. In phase one the aiNet is applied to each dataset to find out the set of antibodies with best affinity values and the second phase the PSO clustering technique is applied, taking these antibodies as initial cluster centroids in the population of particles. For comparison purpose, only PSO for clustering has been simulated. Table 2 shows the fitness comparison in terms of intra cluster distances for all datasets taking only PSO and AIS-PSO into account. In aiNet by varying the four tunable parameters (ns,σs,ζ,σd) discussed in section 2.2 the best parameter setting for aiNet_PSO has been obtained. The most essential parameter σs controls final network size and is responsible for network plasticity. The ns and ζ can adjusts the network size to a degree based on the selected σs and makes the final network as small as possible. σd is responsible for eliminating the antibodies with low antigenic affinity. It is clearly seen from the table 2 that the clustering results are significantly improved in aiNet applied PSO (preprocessed data). The gain in maximum iteration in AIS-PSO is due to availability of better centroids in the initial population of PSO.The following three graphs (Fig 3-5) show the fitness in terms of intra cluster distance using our suggested AIS-PSO approach. 3.1 Conclusion and Future Enhancement This paper presents an approach for data clustering based on aiNet(an immune system base approach) for data analysis.By using this algorithm we refine the data by eliminating redundancy and noise.Hence this approach produces a set of antibodies(centroids in PSO) with high affinity.These antibodies is thus capable of obtaining better clustering results than directly clustering the raw datasets.Our proposed approach also is computaionaly faster in terms of maximum iterations needed to cluster for investigated dataset in comparison to PSO approach alone . As further enhancement, we would like to study various other hybrid approach with variants of PSO models and we would also like to investigate if this preprocessing approach can be suitable to find better performance with other swarm intelligence algorithms. References Bezerra, B and De Castro, L.N. (2003). Bioinformatics data analysis using an artificial immune network. Proceedings of ICARIS 2003, eds. Timmis, J., Bentley, P. and Hart, E. Lecture Notes in Computer Science 2787, pp. Springer-Verlag, 2003. De Castro, L. N. & Von Zuben, F. J. (2002), Learning and Optimisation Using the Clonal Selection Principle. IEEE Transactions on Evolutionary Computation, Special Issue on Artificial Immune Systems, 6(3), pp. 239-251. De Castro, L. N. & Von Zuben, F. J. (2002), Learning and Optimisation Using the Clonal Selection Principle. IEEE Transactions on Evolutionary Computation, Special Issue on Artificial Immune Systems, 6(3), pp. 239-251. De Castro, L.N and Timmis, J. (2002). Artificial Immune Systems: A New Computational Intelligence Approach. Springer-Verlag. De Castro, L.N and Von Zuben, F. (2001). aiNET: An Artificial Immune Network for Data Analysis, in Data Mining: A euristic Approach. Abbas, H, Sarker, R and Newton, C (Eds). Idea Group Publishing. De Castro, L.N. (2003). The Immune response of an Artificial Immune Network (aiNET). Congress on Evolutionary Computation (CEC) pp. 1273-1280. IEEE press. J C Bezdek, S Boggavaparu,et al. (1994). Genetic algorithm guided clustering, in Proc. IEEE Congr. Evol. Comput., 1994,pp.34-40.
168
ISSN 1913-8989
E-ISSN 1913-8997
www.ccsenet.org/cis
Computer and Information Science
Vol. 4, No. 1; January 2011
J Kennedy, RC Eberhart. (1995). Particle Swarm Optimization, Proceedings of the IEEE International Joint Conference on Neural Networks, Vol. 4, pp 1942-1948, 1995. Knight, T and Timmis, J. (2001). AINE: An Immunological Approach to Data Mining. In Cercone, N, Lin, T and Wu X. (Eds) IEEE International Conference on Data Mining. Pp. 297-304, San Jose. CA. Timmis, J and Neal, M. (2001). A Resource Limited Artificial Immune System for Data Analysis. Knowledge Based Systems, 14(3-4):121-130. U Maulik and S Bandyopadhyay. (2000). Genetic Algorithm-based clustreing technique, pattern Recognit., vol.33,pp.1455-1465,2000. Van der Merwe, D. W. and Engelbrecht, A. P. (2003). Data clustering using particle swarm optimization. Proceedings of IEEE Congress on Evolutionary Computation 2003 (CEC 2003), Canbella, Australia. pp. 215-220, 2003. Table 1. Information about datasets DataSet
Total no of records 150 748 685
Iris Blood Transfusion Breast Cancer
No of Attributes 4 4 9
clusters 3 2 2
Table 2. Fitness Comparisons Dataset
Maximum Iteration
Intracluster distance
PSO
AIS-PSO
PSO
AIS-PSO
Iris
300
20
96.12
97.221
Blood Transfusion
400
100
139.23
142.78
Breast cancer
380
50
235.16
241.87
Figure 1. Represents sorted in accordance with affitinity values
Published by Canadian Center of Science and Education
169
www.ccsenet.org/cis
Computer and Information Science
Vol. 4, No. 1; January 2011
Figure 2. Represents subset in sorted value
Figure 3. Fitness curve for Iris data
170
ISSN 1913-8989
E-ISSN 1913-8997
www.ccsenet.org/cis
Computer and Information Science
Vol. 4, No. 1; January 2011
Figure 4. Fitness curve for Blood Transfusion data
Figure 5. Fitness curve for Breast cancer data
Published by Canadian Center of Science and Education
171