Jul 11, 2012 ... Psychometrics With Stata. The Pilot Study. Item Response Characteristics. Item
Response Theory. What are the characteristics of each item?
Psychometrics With Stata Introduction
Psychometrics Using Stata Chuck Huber Senior Statistician StataCorp LP
San Diego, CA
C. Huber (StataCorp)
July 27, 2012
1 / 127
Psychometrics With Stata Introduction
Humor involves two risks May not be funny May offend
Disclaimer The use of clinical depression and its diagnosis in this talk is not meant to make light of this very serious condition. The examples use a depression index and the examples are silly (and fictitious!). This is not meant to imply that depression is silly.
C. Huber (StataCorp)
July 27, 2012
2 / 127
Psychometrics With Stata Introduction
Given the current state of the world economy, the staff at StataCorp began to worry about the emotional well-being of our users. In early 2010, the marketing department hired a consultant to design a depression index to assess our users. The index was pilot-tested on StataCorp employees to determine its psychometric properties. The index was then sent to 1000 randomly selected Stata users. (All data are simulated and this is completely fictitious!)
C. Huber (StataCorp)
July 27, 2012
3 / 127
Psychometrics With Stata The Pilot Study
C. Huber (StataCorp)
July 27, 2012
4 / 127
Psychometrics With Stata The Pilot Study
C. Huber (StataCorp)
July 27, 2012
5 / 127
Psychometrics With Stata The Pilot Study
C. Huber (StataCorp)
July 27, 2012
6 / 127
Psychometrics With Stata The Pilot Study
Administered to all StataCorp employees Explore the psychometric properties of the index Descriptive Statistics Item Response Characteristics Reliability Validity Dimensionality and Exploratory Factor Analysis
C. Huber (StataCorp)
July 27, 2012
7 / 127
Psychometrics With Stata The Pilot Study Descriptive Statistics
. describe id qu1_t1-qu20_t1
variable name id qu1_t1 qu2_t1 qu3_t1 qu4_t1 qu5_t1 qu6_t1 qu7_t1 qu8_t1 qu9_t1 qu10_t1 qu11_t1 qu12_t1 qu13_t1 qu14_t1 qu15_t1 qu16_t1 qu17_t1 qu18_t1 qu19_t1 qu20_t1
storage type
display format
value label
variable label
byte byte byte byte byte byte byte byte byte byte byte byte byte byte byte byte byte byte byte byte byte
%9.0g %16.0g %16.0g %16.0g %16.0g %16.0g %16.0g %16.0g %16.0g %16.0g %16.0g %16.0g %16.0g %16.0g %16.0g %16.0g %16.0g %16.0g %16.0g %16.0g %16.0g
qu1_t1 qu2_t1 qu3_t1 qu4_t1 qu5_t1 qu6_t1 qu7_t1 qu8_t1 qu9_t1 qu10_t1 qu11_t1 qu12_t1 qu13_t1 qu14_t1 qu15_t1 qu16_t1 qu17_t1 qu18_t1 qu19_t1 qu20_t1
Identification Number ...feel sad ...feel pessimistic about the future ...feel like a failure ...feel dissatisfied ...feel guilty or unworthy ...feel that I am being punished ...feel disappointed in myself ...feel am very critical of myself ...feel like harming myself ...feel like crying more than usual ...become annoyed or irritated easily ...have lost interest in other people ...have trouble making decisions ...feel unattractive ...feel like not working ...have trouble sleeping ...feel tired or fatigued ...makes my appetite lower than usual ...concerned about my health ...experience decreased libido
C. Huber (StataCorp)
July 27, 2012
8 / 127
Psychometrics With Stata The Pilot Study Descriptive Statistics
. summ qu1_t1-qu20_t1 Variable
Obs
Mean
Std. Dev.
Min
Max
qu1_t1 qu2_t1 qu3_t1 qu4_t1 qu5_t1
100 100 100 100 100
3.09 2.7 3.1 3.07 3.04
.8656754 .9265991 .8819171 .8905225 .9419516
1 1 1 1 1
5 5 5 5 5
qu6_t1 qu7_t1 qu8_t1 qu9_t1 qu10_t1
100 100 100 100 100
3.1 3.09 3.11 3.12 3.13
.8932971 .8052229 .8633386 .832181 .8836906
1 1 1 1 1
5 5 5 5 5
qu11_t1 qu12_t1 qu13_t1 qu14_t1 qu15_t1
100 100 100 100 100
3.07 3.14 3.16 2.49 2.89
.8072275 .7656779 .7877855 .8586459 .8274947
1 1 1 1 1
5 5 5 5 5
qu16_t1 qu17_t1 qu18_t1 qu19_t1 qu20_t1
100 100 100 100 100
3.05 3.04 3.11 3.11 2.29
.8087276 .7774603 .7371115 .8515583 .8909761
1 1 1 1 1
5 5 5 5 5
C. Huber (StataCorp)
July 27, 2012
9 / 127
Psychometrics With Stata The Pilot Study Descriptive Statistics
. tab qu1_t1 ...feel sad
Freq.
Percent
Cum.
StronglyDisagree Disagree Neutral Agree StronglyAgree
2 22 46 25 5
2.00 22.00 46.00 25.00 5.00
2.00 24.00 70.00 95.00 100.00
Total
100
100.00
C. Huber (StataCorp)
July 27, 2012
10 / 127
Psychometrics With Stata The Pilot Study Descriptive Statistics
Q1: My statistical software makes me... ...feel sad StronglyDisagree
Disagree
Neutral
Agree
StronglyAgree
0
10
C. Huber (StataCorp)
20 30 Number of Respondents
July 27, 2012
40
50
11 / 127
Psychometrics With Stata The Pilot Study Descriptive Statistics
My statistical software makes me... SD="Stongly Disagree", D="Disagree", N="Neutral", A="Agree", SA="Strongly Agree" Q1: ...feel sad
Q2: ...feel pessimistic about the future
SD D N A SA
SD D N A SA 0
10
20
30
40
50
60
0
Q6: ...feel that I am being punished SD D N A SA
10
20
30
40
50
60
0
10
20
30
40
50
60
SD D N A SA
0
10
20
30
40
50
60
Q12: ...have lost interest in other people
10
20
30
40
50
60
SD D N A SA
0
10
20
30
40
50
10
20
30
40
50
60
20
30
40
50
60
10
20
30
40
50
60
10
20
30
40
50
60
Q9: ...feel like harming myself SD D N A SA
0
10
20
30
40
50
60
0
10
20
30
40
50
0
10
20
30
40
50
60
60
20
30
40
50
60
10
20
30
40
50
60
10
20
30
40
50
60
Q15: ...feel like not working SD D N A SA
0
10
20
30
40
50
60
0
Q19: ...concerned about my health SD D N A SA
10
0
Q14: ...feel unattractive
Q18: ...makes my appetite lower than usual
0
0
Q10: ...feel like crying more than usual SD D N A SA
SD D N A SA
SD D N A SA 0
0
Q13: ...have trouble making decisions
60
Q17: ...feel tired or fatigued SD D N A SA
0
10
SD D N A SA
Q16: ...have trouble sleeping
Q5: ...feel guilty or unworthy SD D N A SA
Q8: ...feel am very critical of myself SD D N A SA
SD D N A SA 0
Q4: ...feel dissatisfied SD D N A SA
0
Q7: ...feel disappointed in myself SD D N A SA
Q11: ...become annoyed or irritated easily
Q3: ...feel like a failure SD D N A SA
10
20
30
40
50
60
Q20: ...experience decreased libido SD D N A SA
0
10
20
30
40
50
60
0
10
20
30
40
50
60
Number of Respondents
C. Huber (StataCorp)
July 27, 2012
12 / 127
Psychometrics With Stata The Pilot Study Descriptive Statistics
...how did I make that graph?!? // CREATE A TEMPORARY VARIABLE CALLED "one" FOR USE IN THE GRAPHS BELOW gen one = 1 // GRAPH EACH OF QUESTIONS 1-20 FOR THE COMBO GRAPH forvalues i = 1(1)20 { local GraphTitle : variable label qu‘i’_t1 graph hbar (count) one, over(qu‘i’_t1, relabel(1 SD 2 D 3 N 4 A 5 SA)) /// bar(1, fcolor(blue) lcolor(black)) /// title("Q‘i’: ‘GraphTitle’", size(medsmall) color(black)) /// ytitle(" ") ylabel(0(10)60) ymtick(0(10)60) /// scheme(s1color) /// name(qu‘i’_t1, replace) } // COMBINE THE GRAPHS OF EACH QUESTION INTO A SINGLE GRAPH graph combine qu1_t1 qu2_t1 qu3_t1 qu4_t1 qu5_t1 qu6_t1 qu7_t1 qu8_t1 qu9_t1 qu10_t1 /// qu11_t1 qu12_t1 qu13_t1 qu14_t1 qu15_t1 qu16_t1 qu17_t1 qu18_t1 qu19_t1 qu20_t1, /// rows(4) cols(5) /// title("My statistical software makes me...") /// subtitle(‘"SD="Stongly Disagree", D="Disagree", N="Neutral", A="Agree", SA="Strongly Agree""’, /// size(vsmall) color(black)) /// b1title(Number of Respondents) /// scheme(s1color) graph export .\graphs\Figure1.png, as(png) replace graph export .\graphs\Figure1.ps, as(ps) mag(160) logo(off) orientation(landscape) replace // REMOVE THE "one" VARIABLE drop one
C. Huber (StataCorp)
July 27, 2012
13 / 127
Psychometrics With Stata The Pilot Study Item Response Characteristics
The Pilot Study
Descriptive Statistics Item Response Characteristics Reliability Validity Dimensionality and Exploratory Factor Analysis
C. Huber (StataCorp)
July 27, 2012
14 / 127
Psychometrics With Stata The Pilot Study Item Response Characteristics
Item Response Theory
What are the characteristics of each item? How do they relate to the overall test score? Are some items more predictive than others?
C. Huber (StataCorp)
July 27, 2012
15 / 127
Psychometrics With Stata The Pilot Study Item Response Characteristics
The Latent Trait: Depression
The Idea We observe the responses to the 20 questions We would like to use these responses to infer something about a latent trait which we will call depression.
The Mechanics Dichotomize each question as Yes/No based on their ordinal response Sum the dichotomized responses to create a total score The total score is our latent variable (theta)
C. Huber (StataCorp)
July 27, 2012
16 / 127
Psychometrics With Stata The Pilot Study Item Response Characteristics
C. Huber (StataCorp)
July 27, 2012
17 / 127
Psychometrics With Stata The Pilot Study Item Response Characteristics
Create A Dichotomous Variable For Each Question // CREATE A DICHOTOMOUS VARIABLE FOR EACH QUESTION (1,2,3 = 0 & 4,5 = 1) forvalues i = 1(1)20 { recode qu‘i’_t1 (1/3=0 "No") (4/5=1 "Yes"), gen(qu‘i’_t1_bin) local TempLabel : variable label qu‘i’_t1 label var qu‘i’_t1_bin "‘TempLabel’ (binary)" } . tab qu1_t1 qu1_t1_bin ...feel sad
...feel sad (binary) No Yes
Total
StronglyDisagree Disagree Neutral Agree StronglyAgree
2 22 46 0 0
0 0 0 25 5
2 22 46 25 5
Total
70
30
100
C. Huber (StataCorp)
July 27, 2012
18 / 127
Psychometrics With Stata The Pilot Study Item Response Characteristics
Create The Latent Variable (theta) // SUM THE 20 BINARY QUESTIONS egen TotalBinary = rowtotal(qu1_t1_bin - qu20_t1_bin) label var TotalBinary "Sum of all 20 binary question scores" Responses for Participant #1 ...feel sad (binary) = ...feel pessimistic about the future (binary) = ...feel like a failure (binary) = ...feel dissatisfied (binary) = ...feel guilty or unworthy (binary) = ...feel that I am being punished (binary) = ...feel disappointed in myself (binary) = ...feel am very critical of myself (binary) = ...feel like harming myself (binary) = ...feel like crying more than usual (binary) = ...become annoyed or irritated easily (binary) = ...have lost interest in other people (binary) = ...have trouble making decisions (binary) = ...feel unattractive (binary) = ...feel like not working (binary) = ...have trouble sleeping (binary) = ...feel tired or fatigued (binary) = ...makes my appetite lower than usual (binary) = ...concerned about my health (binary) = ...experience decreased libido (binary) =
0 0 0 0 0 0 0 0 0 0 0 0 1 0 0 1 0 0 1 0
Sum of all 20 binary question scores =
3
C. Huber (StataCorp)
July 27, 2012
19 / 127
Psychometrics With Stata The Pilot Study Item Response Characteristics
Create The Latent Variable (theta) // SUM THE 20 BINARY QUESTIONS egen TotalBinary = rowtotal(qu1_t1_bin - qu20_t1_bin) label var TotalBinary "Sum of all 20 binary question scores" Responses for Participant #1 ...feel sad (binary) = ...feel pessimistic about the future (binary) = ...feel like a failure (binary) = ...feel dissatisfied (binary) = ...feel guilty or unworthy (binary) = ...feel that I am being punished (binary) = ...feel disappointed in myself (binary) = ...feel am very critical of myself (binary) = ...feel like harming myself (binary) = ...feel like crying more than usual (binary) = ...become annoyed or irritated easily (binary) = ...have lost interest in other people (binary) = ...have trouble making decisions (binary) = ...feel unattractive (binary) = ...feel like not working (binary) = ...have trouble sleeping (binary) = ...feel tired or fatigued (binary) = ...makes my appetite lower than usual (binary) = ...concerned about my health (binary) = ...experience decreased libido (binary) =
0 0 0 0 0 0 0 0 0 0 0 0 1 0 0 1 0 0 1 0
Sum of all 20 binary question scores =
3
C. Huber (StataCorp)
July 27, 2012
20 / 127
Psychometrics With Stata The Pilot Study Item Response Characteristics
0
.05
Density .1
.15
.2
Distribution of the Total Test Scores
0
5
10 Raw Sum of All Binary Items
C. Huber (StataCorp)
July 27, 2012
15
20
21 / 127
Psychometrics With Stata The Pilot Study Item Response Characteristics
0
.5
Density
1
1.5
Distribution of the Standardized Test Scores
−3
−2
−1 0 1 2 Standardized Sum of All Binary Items (Theta)
C. Huber (StataCorp)
July 27, 2012
3
22 / 127
Psychometrics With Stata The Pilot Study Item Response Characteristics
We can then fit a logistic regression model for each binary outcome using the latent variable (standardized test score) as a continuous predictor variable:
Response Curve for Question 1
0
.2
P(Response=1 | Theta) .4 .6 .8
1
...feel sad
−3
−2
−1 0 1 Standardized Test Score (Theta)
C. Huber (StataCorp)
July 27, 2012
2
3
23 / 127
Psychometrics With Stata The Pilot Study Item Response Characteristics
Response Curves My statistical software makes me...
−2
−1
0
1
2
3
−3
−2
−1
0
1
2
3
−3
−2
−1
0
1
2
3
−1
0
1
2
3
−3
−2
−1
0
1
2
−2
−1
0
1
2
3
0
1
2
3
−3
−2
−1
0
1
2
−2
−1
0
1
2
−3
−1
0
1
2
3
−3
−2
−1
0
1
2
−3
−2
−1
0
1
2
3
3
−3
−2
−1
0
1
2
3
Q10: ...feel like crying more than usual
−2
−1
0
1
2
3
−3
Q14: ...feel unattractive
−3
Q18: ...makes my appetite lower than usual
3
−2
Q9: ...feel like harming myself
3
0 .2 .4 .6 .8 1 −3
0 .2 .4 .6 .8 1 −3
Q13: ...have trouble making decisions
3
Q17: ...feel tired or fatigued 0 .2 .4 .6 .8 1
0 .2 .4 .6 .8 1
Q16: ...have trouble sleeping
−3
−1
0 .2 .4 .6 .8 1
0 .2 .4 .6 .8 1
0 .2 .4 .6 .8 1
−2
−2
Q8: ...feel am very critical of myself
Q11: ...become annoyed or irritated easily Q12: ...have lost interest in other people
−3
0 .2 .4 .6 .8 1 −3
Q7: ...feel disappointed in myself 0 .2 .4 .6 .8 1
0 .2 .4 .6 .8 1
0 .2 .4 .6 .8 1 −3
0 .2 .4 .6 .8 1
3
−2
−1
0
1
2
3
Q15: ...feel like not working 0 .2 .4 .6 .8 1
2
−2
−1
0
1
2
3
−3
Q19: ...concerned about my health
−2
−1
0
1
2
3
Q20: ...experience decreased libido 0 .2 .4 .6 .8 1
1
0 .2 .4 .6 .8 1
0
0 .2 .4 .6 .8 1
−1
Q5: ...feel guilty or unworthy
0 .2 .4 .6 .8 1
−2
Q6: ...feel that I am being punished
Q4: ...feel dissatisfied
0 .2 .4 .6 .8 1
−3
P(Response=1 | Theta)
Q3: ...feel like a failure
0 .2 .4 .6 .8 1
Q2: ...feel pessimistic about the future
0 .2 .4 .6 .8 1
Q1: ...feel sad
−3
−2
−1
0
1
2
3
−3
−2
−1
0
1
2
3
Standardized Test Score (Theta)
C. Huber (StataCorp)
July 27, 2012
24 / 127
Psychometrics With Stata The Pilot Study Item Response Characteristics
The Rasch Model Since each individual responds to all 20 questions, we could conceptualize this as a multilevel model. Could fit a mixed-effects logistic regression model with a coefficient for each question. The simplest form of this kind of model is known as The Rasch Model.
C. Huber (StataCorp)
July 27, 2012
25 / 127
Psychometrics With Stata The Pilot Study Item Response Characteristics
Reshape the Data From Wide to Long Format list id qu1_t1_bin-qu10_t1_bin if id==1, nolabel id 1.
qu1_t1~n qu2_t1~n qu3_t1~n qu4_t1~n qu5_t1~n qu6_t1~n qu7_t1~n qu8_t1~n qu9_t1~n qu10_t~n
1
0
0
0
0
0
0
0
0
0
0
. reshape long qu@_t1_bin, i(id) j(question) . list id question qu_t1_bin if id==1, nolab id
question
qu_t1_~n
1. 2. 3. 4. 5.
1 1 1 1 1
1 2 3 4 5
0 0 0 0 0
6. 7. 8. 9. 10.
1 1 1 1 1
6 7 8 9 10
0 0 0 0 0
11. 12. 13. 14. 15.
1 1 1 1 1
11 12 13 14 15
0 0 1 0 0
16. 17. 18. 19. 20.
1 1 1 1 1
16 17 18 19 20
1 0 0 1 0
C. Huber (StataCorp)
July 27, 2012
26 / 127
Psychometrics With Stata The Pilot Study Item Response Characteristics
Create Indicator Variables for Each Question forvalues num =1/20{ gen Delta‘num’ = -(question==‘num’) } . list id qu_t1_bin question Delta1-Delta10 if id==1, nodisplay noobs nolabel id
qu_t1_~n
question
1 1 1 1 1
0 0 0 0 0
1 2 3 4 5
Delta1 Delta2 Delta3 Delta4 Delta5 Delta6 Delta7 Delta8 Delta9 Delta10 -1 0 0 0 0
0 -1 0 0 0
0 0 -1 0 0
0 0 0 -1 0
0 0 0 0 -1
0 0 0 0 0
0 0 0 0 0
0 0 0 0 0
0 0 0 0 0
0 0 0 0 0
1 1 1 1 1
0 0 0 0 0
6 7 8 9 10
0 0 0 0 0
0 0 0 0 0
0 0 0 0 0
0 0 0 0 0
0 0 0 0 0
-1 0 0 0 0
0 -1 0 0 0
0 0 -1 0 0
0 0 0 -1 0
0 0 0 0 -1
1 1 1 1 1
0 0 1 0 0
11 12 13 14 15
0 0 0 0 0
0 0 0 0 0
0 0 0 0 0
0 0 0 0 0
0 0 0 0 0
0 0 0 0 0
0 0 0 0 0
0 0 0 0 0
0 0 0 0 0
0 0 0 0 0
1 1 1 1 1
1 0 0 1 0
16 17 18 19 20
0 0 0 0 0
0 0 0 0 0
0 0 0 0 0
0 0 0 0 0
0 0 0 0 0
0 0 0 0 0
0 0 0 0 0
0 0 0 0 0
0 0 0 0 0
0 0 0 0 0
C. Huber (StataCorp)
July 27, 2012
27 / 127
Psychometrics With Stata The Pilot Study Item Response Characteristics
Fit the Rasch Model with -xtmelogitxtmelogit qu_t1_bin Delta1-Delta20, noconstant || id:, covariance(identity) nolog Mixed-effects logistic regression Group variable: id
Number of obs Number of groups Obs per group: min avg max Wald chi2(20) Prob > chi2
Integration points = 7 Log likelihood = -765.69974 qu_t1_bin
Coef.
Delta1 Delta2 Delta3 Delta4 Delta5 Delta6 Delta7 Delta8 Delta9 Delta10 Delta11 Delta12 Delta13 Delta14 Delta15 Delta16 Delta17 Delta18 Delta19 Delta20
1.805149 3.171066 1.555716 1.72126 2.062939 1.47382 1.975836 1.805149 1.975836 1.638157 2.241544 1.975836 1.889959 4.444528 2.829789 2.333454 2.622612 2.523699 2.062939 4.946324
Random-effects Parameters
= = = = = = =
2000 100 20 20.0 20 117.44 0.0000
Std. Err.
z
P>|z|
[95% Conf. Interval]
.4280238 .4758495 .4238328 .4264998 .4335186 .4226682 .4315174 .4280238 .4315174 .4251067 .4381266 .4315174 .4296914 .5805036 .4589574 .4407813 .4505291 .4469441 .4335186 .6431941
4.22 6.66 3.67 4.04 4.76 3.49 4.58 4.22 4.58 3.85 5.12 4.58 4.40 7.66 6.17 5.29 5.82 5.65 4.76 7.69
0.000 0.000 0.000 0.000 0.000 0.000 0.000 0.000 0.000 0.000 0.000 0.000 0.000 0.000 0.000 0.000 0.000 0.000 0.000 0.000
.9662381 2.238418 .7250189 .885336 1.213258 .6454058 1.130078 .9662382 1.130077 .8049635 1.382832 1.130077 1.04778 3.306762 1.930249 1.469538 1.739592 1.647705 1.213258 3.685686
2.644061 4.103714 2.386413 2.557185 2.91262 2.302235 2.821595 2.644061 2.821595 2.471351 3.100256 2.821595 2.732139 5.582295 3.729329 3.197369 3.505633 3.399694 2.91262 6.206961
Estimate
Std. Err.
[95% Conf. Interval]
2.777908
.3097652
2.232545
id: Identity sd(_cons)
LR test vs. logistic regression: chibar2(01) =
C. Huber (StataCorp)
3.456492
643.87 Prob>=chibar2 = 0.0000
July 27, 2012
28 / 127
Psychometrics With Stata The Pilot Study Item Response Characteristics
0
.2
P(Response=1 | Theta) .4 .6 .8
1
Item Characteristic Curve for Question 1
−3
−2
−1 0 1 Standardized Test Score (Theta)
C. Huber (StataCorp)
July 27, 2012
2
3
29 / 127
Psychometrics With Stata The Pilot Study Item Response Characteristics
Item Characteristic Curves My statistical software makes me...
−2
−1
0
1
2
3
−3
−2
−1
0
1
2
3
−3
−2
−1
0
1
2
3
−1
0
1
2
3
−3
−2
−1
0
1
2
−2
−1
0
1
2
3
0
1
2
3
−3
−2
−1
0
1
2
−2
−1
0
1
2
−3
−1
0
1
2
3
−3
−2
−1
0
1
2
−3
−2
−1
0
1
2
3
3
−3
−2
−1
0
1
2
3
Q10: ...feel like crying more than usual
−2
−1
0
1
2
3
−3
Q14: ...feel unattractive
−3
Q18: ...makes my appetite lower than usual
3
−2
Q9: ...feel like harming myself
3
0 .2 .4 .6 .8 1 −3
0 .2 .4 .6 .8 1 −3
Q13: ...have trouble making decisions
3
Q17: ...feel tired or fatigued 0 .2 .4 .6 .8 1
0 .2 .4 .6 .8 1
Q16: ...have trouble sleeping
−3
−1
0 .2 .4 .6 .8 1
0 .2 .4 .6 .8 1
0 .2 .4 .6 .8 1
−2
−2
Q8: ...feel am very critical of myself
Q11: ...become annoyed or irritated easily Q12: ...have lost interest in other people
−3
0 .2 .4 .6 .8 1 −3
Q7: ...feel disappointed in myself 0 .2 .4 .6 .8 1
0 .2 .4 .6 .8 1
0 .2 .4 .6 .8 1 −3
0 .2 .4 .6 .8 1
3
−2
−1
0
1
2
3
Q15: ...feel like not working 0 .2 .4 .6 .8 1
2
−2
−1
0
1
2
3
−3
Q19: ...concerned about my health
−2
−1
0
1
2
3
Q20: ...experience decreased libido 0 .2 .4 .6 .8 1
1
0 .2 .4 .6 .8 1
0
0 .2 .4 .6 .8 1
−1
Q5: ...feel guilty or unworthy
0 .2 .4 .6 .8 1
−2
Q6: ...feel that I am being punished
Q4: ...feel dissatisfied
0 .2 .4 .6 .8 1
−3
P(Response=1 | Theta)
Q3: ...feel like a failure
0 .2 .4 .6 .8 1
Q2: ...feel pessimistic about the future
0 .2 .4 .6 .8 1
Q1: ...feel sad
−3
−2
−1
0
1
2
3
−3
−2
−1
0
1
2
3
Standardized Test Score (Theta)
C. Huber (StataCorp)
July 27, 2012
30 / 127
Psychometrics With Stata The Pilot Study Item Response Characteristics
Extensions of the Rasch Model
The Rasch Model One parameter logistic or 1PL model Parameter quantifies the difficulty of the item
Two parameter logistic (2PL) model A second parameter accounts for guessing
Three parameter logistic (3PL) model A third parameter accounts for the ability of the question to discriminate between people with high and low values of the latent trait
C. Huber (StataCorp)
July 27, 2012
31 / 127
Psychometrics With Stata The Pilot Study Item Response Characteristics
User Written IRT Commands -raschtest- by Jean-Benoit Hardouin Fixed and random effects Rasch Models Stata Journal (2007) Volume 7, Number 1, pp. 22-44
Nonparametric IRT models by Jean-Benoit Hardouin, Ang`elique Bonnaud-Antignac and V`eronique S`ebille Trace lines, Mokken scales, Loevinger coefficients, Guttman errors Stata Journal (2011) Volume 11, Number 1, pp. 30-51
-openirt- by Tristan Zajonc Fits 1PL, 2PL and 3PL models Maximum Likelihood (ML) Bayesian Expected a Posterior (EAP) Plausible Values (Multiple Imputation)
C. Huber (StataCorp)
July 27, 2012
32 / 127
Psychometrics With Stata The Pilot Study Reliability
The Pilot Study
Descriptive Statistics Item Response Characteristics Reliability Validity Dimensionality and Exploratory Factor Analysis
C. Huber (StataCorp)
July 27, 2012
33 / 127
Psychometrics With Stata The Pilot Study Reliability
Reliability
We would like for our depression index to be reliable in the sense that repeated administration of the instrument would yield similar results. Test-Retest Reliability Could be quantified using canonical correlation Quantified by the intraclass correlation coefficient (ICC)
Split-half reliability Quantified by the Spearman-Brown prophesy formula
Internal Consistency Quantified by Cronbach’s alpha
C. Huber (StataCorp)
July 27, 2012
34 / 127
Psychometrics With Stata The Pilot Study Reliability
Test-Retest Reliability
Perhaps the most obvious way to assess the reliability of a psychometric instrument is to administer it twice to the same group of people and examine the degree of agreement Could quantify reliability as the canonical correlation between the two sets of repeated questions Could consider repeated responses within a participant as longitudinal data and compute the intraclass correlation coefficient (ICC) based on a mixed-effects linear model
C. Huber (StataCorp)
July 27, 2012
35 / 127
Psychometrics With Stata The Pilot Study Reliability
Canonical Correlation Each participant was given the Stata Depression Index twice with a 6-month interval between tests. The canonical correlation between the two sets of questions was then estimated: canon (qu1_t1-qu20_t1) (qu1_t2-qu20_t2), lc(1) Canonical correlations: 0.9907 0.7895 0.7468
0.6918
0.6207
0.5908
0.5407
Tests of significance of all canonical correlations Statistic df1 df2 Wilks’ lambda .000128345 400 914.629 Pillai’s trace 4.82041 400 1580 Lawley-Hotelling trace 60.0375 400 1162 Roy’s largest root 53.2379 20 79
0.4998
0.4755
F 2.0138 1.2544 8.7204 210.2896
0.4131
Prob>F 0.0000 0.0016 0.0000 0.0000
a a a u
e = exact, a = approximate, u = upper bound on F
C. Huber (StataCorp)
July 27, 2012
36 / 127
Psychometrics With Stata The Pilot Study Reliability
Intraclass Correlation Coefficient (ICC) We could manually compute the intraclass correlation coefficient for Question 1 using Stata’s -xtmixed- command: . xtmixed qu1_t, || id:, covariance(identity) variance nolog Mixed-effects ML regression Group variable: id
Number of obs Number of groups Obs per group: min avg max Wald chi2(0) Prob > chi2
Log likelihood = -244.98455 qu1_t
Coef.
Std. Err.
_cons
3.055
.0744631
Random-effects Parameters
z 41.03
= = = = = = =
200 100 2 2.0 2 . .
P>|z|
[95% Conf. Interval]
0.000
2.909055
3.200945
Estimate
Std. Err.
[95% Conf. Interval]
var(_cons)
.346975
.0837256
.216223
.5567938
var(Residual)
.415
.0586899
.3145358
.547553
id: Identity
LR test vs. linear regression: chibar2(01) = . estat icc Intraclass correlation Level
ICC
id
.4553627
23.24 Prob >= chibar2 = 0.0000
Std. Err. .0792645
C. Huber (StataCorp)
[95% Conf. Interval] .308863
July 27, 2012
.6100182
37 / 127
Psychometrics With Stata The Pilot Study Reliability
Intraclass Correlation Coefficient (ICC) But it would be more convenient to simply use Stata’s built-in -icccommand: . icc qu1_t id time Intraclass correlations Two-way random-effects model Absolute agreement Random effects: id Random effects: time
Number of targets = Number of raters =
qu1_t
ICC
Individual Average
.4587313 .6289456
100 2
[95% Conf. Interval] .2890881 .4485157
F test that ICC=0.00: F(99.0, 99.0) = 2.69
.6004393 .7503431
Prob > F = 0.000
Note: ICCs estimate correlations between individual measurements and between average measurements made on the same target.
C. Huber (StataCorp)
July 27, 2012
38 / 127
Psychometrics With Stata The Pilot Study Reliability
Intraclass Correlation Coefficient (ICC) We could even loop through all 20 questions quickly: forvalues i = 1(1)20 { quietly icc qu‘i’_t id time disp as text "The ICC for Question ‘i’ = " _col(30) as result %5.4f r(icc_i) } The The The The The The The The The The The The The The The The The The The The
ICC ICC ICC ICC ICC ICC ICC ICC ICC ICC ICC ICC ICC ICC ICC ICC ICC ICC ICC ICC
for for for for for for for for for for for for for for for for for for for for
Question Question Question Question Question Question Question Question Question Question Question Question Question Question Question Question Question Question Question Question
1 = 2 = 3 = 4 = 5 = 6 = 7 = 8 = 9 = 10 = 11 = 12 = 13 = 14 = 15 = 16 = 17 = 18 = 19 = 20 =
0.4587 0.4367 0.5210 0.5450 0.5847 0.5299 0.4914 0.4329 0.5044 0.4634 0.4848 0.3827 0.4706 0.3806 0.3376 0.4766 0.4859 0.3879 0.4704 0.2491
C. Huber (StataCorp)
July 27, 2012
39 / 127
Psychometrics With Stata The Pilot Study Reliability
Split-Half Reliability If we could assume that we have two equivalent forms of the instrument, we could simply calculate the correlation between those two ”halves” of the test. For example, we could examine the correlation between the even numbered questions and the odd numbered questions. egen TotalEven = rowtotal(qu2_t1 qu4_t1 qu6_t1 qu8_t1 qu10_t1 qu12_t1 qu14_t1 qu16_t1 qu18_t1 qu20_t1) egen TotalOdd = rowtotal(qu1_t1 qu3_t1 qu5_t1 qu7_t1 qu9_t1 qu11_t1 qu13_t1 q u15_t1 qu17_t1 qu19_t1)
corr TotalEven TotalOdd (obs=100) TotalE~ n TotalOdd TotalEven TotalOdd
1.0000 0.9586
1.0000
C. Huber (StataCorp)
July 27, 2012
40 / 127
Psychometrics With Stata The Pilot Study Reliability
Split-Half Reliability Because we have correlated half of our test with the other half, it is common to use the Spearman-Brown Prophesy Formula to assess split-half reliability: Rsb =
2rsh (1 + rsh )
local sbpf = 2*r(rho) / (1+r(rho)) disp "The Spearman-Brown Prophesy Reliability Estimate = " as result \%5.4f ‘sbpf’ The Spearman-Brown Prophesy Reliability Estimate = 0.9788
C. Huber (StataCorp)
July 27, 2012
41 / 127
Psychometrics With Stata The Pilot Study Reliability
Split-Half Reliability
Unfortunately, there is nothing sacred about odd and even numbered questions. If the questions were numbered differently, the estimate of the Spearman-Brown Prophesy Formula would change. It would be nice to get the same estimate regardless of the way the questions are numbered.
C. Huber (StataCorp)
July 27, 2012
42 / 127
Psychometrics With Stata The Pilot Study Reliability
Cronbach’s Alpha Cronbach’s Alpha is a function of the average covariance (or correlation) among all possible combinations of the variables. alpha qu1_t1-qu20_t1 Test scale = mean(unstandardized items) Average interitem covariance: Number of items in the scale: Scale reliability coefficient:
C. Huber (StataCorp)
.3402467 20 0.9476
July 27, 2012
43 / 127
Psychometrics With Stata The Pilot Study Validity
The Pilot Study
Descriptive Statistics Item Response Characteristics Reliability Validity Dimensionality and Exploratory Factor Analysis
C. Huber (StataCorp)
July 27, 2012
44 / 127
Psychometrics With Stata The Pilot Study Validity
Validity
While there are different kinds of validity, essentially we would like to be able to say that our instrument measures what we think we are measuring. One way to assess the validity of our instrument is to examine the correlation between our index and other known indices. For example, we might compare the results of the Stata Depression Index with the ratings of trained psychiatric professionals.
C. Huber (StataCorp)
July 27, 2012
45 / 127
Psychometrics With Stata The Pilot Study Validity
Validity
To assess the validity of the Stata Depression Index, we wanted to compare our results to the rating of a psychiatrist. However, since psychiatrists are much like economists (no explanation necessary), we decided to hire two psychiatrists and compare their inter-rater reliability before comparing their ratings to our instrument.
C. Huber (StataCorp)
July 27, 2012
46 / 127
Psychometrics With Stata The Pilot Study Validity
Inter-Rater Reliability Dr. Hannibal Lector and Dr. Frasier Crane were hired to interview each employee at StataCorp and rate them in terms of none, mild, moderate or severe depression.
C. Huber (StataCorp)
July 27, 2012
47 / 127
Psychometrics With Stata The Pilot Study Validity
Cohen’s Kappa Statistic We can tabulate the diagnoses of Dr Lector and Dr Crane and the first thing we notice is that their diagnoses tend to fall on the main diagonal of the table. . tab DrLector DrCrane Dr Lector’s Diagnosis
None
Severe
Total
None Mild Moderate Severe
2 20 0 0
5 45 8 0
0 0 14 3
0 0 0 2
7 65 22 5
Total
22
58
17
2
99
Dr Crane’s Diagnosis Mild Moderate
The second thing we notice is that our sample size dropped from n=100 to n=99.
C. Huber (StataCorp)
July 27, 2012
48 / 127
Psychometrics With Stata The Pilot Study Validity
Cohen’s Kappa Statistic It appears that one of Dr. Lector’s ratings is missing. This matter is still under investigation. . tab DrLector DrCrane, missing Dr Lector’s Diagnosis
None
Severe
Total
None Mild Moderate Severe .
2 20 0 0 1
5 45 8 0 0
0 0 14 3 0
0 0 0 2 0
7 65 22 5 1
Total
23
58
17
2
100
Dr Crane’s Diagnosis Mild Moderate
C. Huber (StataCorp)
July 27, 2012
49 / 127
Psychometrics With Stata The Pilot Study Validity
Cohen’s Kappa Statistic Because two raters can agree with each simply due to chance, we compute Cohen’s Kappa statistic to assess the chance-corrected measure of inter-rater agreement: . kap DrLector DrCrane Agreement
Expected Agreement
Kappa
Std. Err.
63.64%
43.95%
0.3512
0.0659
Z
Prob>Z
5.33
0.0000
A Kappa of 0.3512 is generally considered poor agreement among raters. We are disappointed but not surprised.
C. Huber (StataCorp)
July 27, 2012
50 / 127
Psychometrics With Stata The Pilot Study Validity
Cohen’s Kappa Statistic However, we notice that very few ratings fall on the off-diagonals of the table. So we down-weight those cells in the table and compute a weighted kappa statistic: . kapwgt MyWeight 1 \ .8 1 \ 0 0 1 \ 0 0 .8 1
//
(define matrix)
. kapwgt MyWeight 1.0000 0.8000 1.0000 0.0000 0.0000 1.0000 0.0000 0.0000 0.8000 1.0000 . kap DrLector DrCrane, wgt(MyWeight) Ratings weighted by: 1.0000 0.8000 0.8000 1.0000 0.0000 0.0000 0.0000 0.0000
0.0000 0.0000 1.0000 0.8000
0.0000 0.0000 0.8000 1.0000
Agreement
Expected Agreement
Kappa
Std. Err.
86.26%
59.99%
0.6566
0.0842
C. Huber (StataCorp)
Z
Prob>Z
7.80
0.0000
July 27, 2012
51 / 127
Psychometrics With Stata The Pilot Study Validity
Combine ratings into a ”Diagnosis” variable We elected to combine the ratings of Dr Lector and Dr Crane by creating new variable called ”diagnosis”: . tab DrLector DrCrane Dr Lector’s Diagnosis
None
Severe
Total
None Mild Moderate Severe
2 20 0 0
5 45 8 0
0 0 14 3
0 0 0 2
7 65 22 5
Total
22
58
17
2
99
Dr Crane’s Diagnosis Mild Moderate
. gen diagnosis = 0 . replace diagnosis = 1 if DrLector>=3 | DrCrane>=3 (28 real changes made)
C. Huber (StataCorp)
July 27, 2012
52 / 127
Psychometrics With Stata The Pilot Study Validity
Association Between Our Index and Diagnosis Next we wanted to examine the association between the Stata Depression Index and the diagnosis based on Drs. Lector and Crane. . tab qu1_t1 diagnosis, all exact
...feel sad
Diagnosis based on Drs Lector and Crane NotDepres Depressed
StronglyDisagree Disagree Neutral Agree StronglyAgree
2 22 37 11 0
Total
72
Pearson chi2(4) likelihood-ratio chi2(4) Cramer’s V gamma Kendall’s tau-b Fisher’s exact
= = = = = =
33.5361 38.8171 0.5791 0.8705 0.5104
Total
0 0 9 14 5
2 22 46 25 5
28
100 Pr = 0.000 Pr = 0.000
ASE = 0.057 ASE = 0.060 0.000
C. Huber (StataCorp)
July 27, 2012
53 / 127
Psychometrics With Stata The Pilot Study Validity
Point-Biserial Correlation
When one variable is continuous and the other is binary, a popular measure of association frequently used in psychometrics is the point-biserial correlation coefficient. This is easily calculated in one of two ways: Student’s t-test Linear Regression
C. Huber (StataCorp)
July 27, 2012
54 / 127
Psychometrics With Stata The Pilot Study Validity
Point-Biserial Correlation Using Student’s t-test . ttest qu1_t1, by(diagnosis) Two-sample t test with equal variances Group
Obs
Mean
NotDepre Depresse
72 28
2.791667 3.857143
combined
100
diff
Std. Err.
Std. Dev.
[95% Conf. Interval]
.0860758 .1332766
.7303771 .7052336
2.620036 3.583682
3.09
.0865675
.8656754
-1.065476
.1611445
diff = mean(NotDepre) - mean(Depresse) Ho: diff = 0 Ha: diff < 0 Pr(T < t) = 0.0000
2.963297 4.130604
2.918231
3.261769
-1.385262
-.7456902
t = degrees of freedom =
Ha: diff != 0 Pr(|T| > |t|) = 0.0000
-6.6119 98
Ha: diff > 0 Pr(T > t) = 1.0000
. local rsquared = (r(t)^2) / ((r(t)^2)+r(df_t)) . disp as text "The Point-Biserial Correlation based on the t-test = " as result %5.4f sqrt(‘rsquared’)
The Point-Biserial Correlation based on the t-test = 0.5554
C. Huber (StataCorp)
July 27, 2012
55 / 127
Psychometrics With Stata The Pilot Study Validity
Point-Biserial Correlation Using Linear Regression . regress qu1_t1 diagnosis Source Model Residual Total
SS
df
22.8864286 51.3035714 74.19
qu1_t1
Coef.
diagnosis _cons
1.065476 2.791667
MS
1 98
22.8864286 .523505831
99
.749393939
Std. Err. .1611445 .0852697
t 6.61 32.74
Number of obs F( 1, 98) Prob > F R-squared Adj R-squared Root MSE
= = = = = =
100 43.72 0.0000 0.3085 0.3014 .72354
P>|t|
[95% Conf. Interval]
0.000 0.000
.7456902 2.622452
1.385262 2.960882
. local pointbs = sqrt(e(r2)) . disp as text "The Point-Biserial Correlation coefficient = " as result %5.4f ‘pointbs’
The Point-Biserial Correlation coefficient = 0.5554
C. Huber (StataCorp)
July 27, 2012
56 / 127
Psychometrics With Stata The Pilot Study Validity
Tetrachoric Correlation When two dichotomous variables are conceptualized as having an underlying bivariate normal distribution, the association between them can be estimated using the tetrachoric correlation coefficient.
C. Huber (StataCorp)
July 27, 2012
57 / 127
Psychometrics With Stata The Pilot Study Validity
First, Dichotomize the Questions
C. Huber (StataCorp)
July 27, 2012
58 / 127
Psychometrics With Stata The Pilot Study Validity
Tetrachoric Correlation Using -tetrachoric. tab qu1_t1_bin diagnosis Question 1, Time 1 Coded as Binary
Diagnosis based on Drs Lector and Crane NotDepres Depressed
Total
NotDepressed Depressed
61 11
9 19
70 30
Total
72
28
100
. tetrachoric qu1_t1_bin diagnosis Number of obs = Tetrachoric rho = Std error =
100 0.7415 0.0971
Test of Ho: qu1_t1_bin and diagnosis are independent 2-sided exact P = 0.0000
C. Huber (StataCorp)
July 27, 2012
59 / 127
Psychometrics With Stata The Pilot Study Validity
Tetrachoric Correlation Using -biprobit. biprobit qu1_t1_bin diagnosis Bivariate probit regression Log likelihood =
Number of obs Wald chi2(0) Prob > chi2
-107.6575 Coef.
Std. Err.
100 . .
P>|z|
[95% Conf. Interval]
-3.98
0.000
-.782723
-.266078
.1333832
-4.37
0.000
-.8442677
-.3214153
.2157823
4.42
0.000
.5309467
1.376798
.4861044
.8802322
qu1_t1_bin _cons
-.5244005
.1317996
diagnosis _cons
-.5828415
/athrho
.9538723
rho
.7415311
.0971304
Likelihood-ratio test of rho=0:
z
= = =
chi2(1) =
C. Huber (StataCorp)
25.4485
July 27, 2012
Prob > chi2 = 0.0000
60 / 127
Psychometrics With Stata The Pilot Study Validity
Correlation Between Each Item and Diagnosis Question Question Question Question Question Question Question Question Question Question Question Question Question Question Question Question Question Question Question Question Question
1 2 3 4 5 6 7 8 9 10 11 12 13 14 15 16 17 18 19 20
Pearson
Biserial
Tetrachoric
0.5554 0.5894 0.5635 0.6043 0.5912 0.5563 0.5971 0.4905 0.5552 0.4904 0.4448 0.4993 0.5262 0.5287 0.5161 0.4871 0.4860 0.4834 0.4710 0.5497
0.5554 0.5894 0.5635 0.6043 0.5912 0.5563 0.5971 0.4905 0.5552 0.4904 0.4448 0.4993 0.5262 0.5287 0.5161 0.4871 0.4860 0.4834 0.4710 0.5497
0.7415 0.8568 0.8286 0.8936 0.8009 0.7684 0.8260 0.7415 0.8260 0.7029 0.6910 0.7310 0.7611 1.0000 0.7451 0.5935 0.6809 0.7128 0.5133 1.0000
C. Huber (StataCorp)
July 27, 2012
61 / 127
Psychometrics With Stata The Pilot Study Dimensionality and Exploratory Factor Analysis
The Pilot Study
Descriptive Statistics Item Response Characteristics Reliability Validity Dimensionality and Exploratory Factor Analysis
C. Huber (StataCorp)
July 27, 2012
62 / 127
Psychometrics With Stata The Pilot Study Dimensionality and Exploratory Factor Analysis
Dimensionality and Exploratory Factor Analysis
The Cronbach’s Alpha estimated earlier suggests a high degree of correlation among the questions It might be useful to look for patterns among these correlations There might be groups of questions that measure some underlying latent attribute We could treat the questions as ordinal or as continuous variables
C. Huber (StataCorp)
July 27, 2012
63 / 127
Psychometrics With Stata The Pilot Study Dimensionality and Exploratory Factor Analysis
Since all correlation coefficients measure the degree of linear relationship between variables, it might be wise to visually inspect scatterplots of the variables before calculating various correlation matrices...
C. Huber (StataCorp)
July 27, 2012
64 / 127
Psychometrics With Stata The Pilot Study Dimensionality and Exploratory Factor Analysis
My statistical software makes me... 0
5
0
5 5
...feel sad 0
5
...feel pessimistic about the future 0
5
...feel like a failure 0
5
...feel dissatisfied 0
5
...feel guilty or unworthy 0 0
5
0
C. Huber (StataCorp)
5
July 27, 2012
0
5
65 / 127
Psychometrics With Stata The Pilot Study Dimensionality and Exploratory Factor Analysis
My statistical software makes me... 0
5
0
5
0
5
0
5
0
5 5
...feel sad 0
5
...feel pessimistic about the future 0
5
...feel like a failure 0
5
...feel dissatisfied 0
5
...feel guilty or unworthy 0
5
...feel that I am being punished 0
5
...feel disappointed in myself 0
5
...feel am very critical of myself 0
5
...feel like harming myself 0
5
...feel like crying more than usual 0 0
5
0
5
0
C. Huber (StataCorp)
5
0
July 27, 2012
5
0
5
66 / 127
Psychometrics With Stata The Pilot Study Dimensionality and Exploratory Factor Analysis
My statistical software makes me... 0
5
0
5
0
5
0
5
0
5
0
5
0
5
0
5
0
5
0
5 5
...feel sad 0
5
...feel pessimistic about the future 0
5
...feel like a failure 0
5
...feel dissatisfied 0
5
...feel guilty or unworthy 0
5
...feel that I am being punished 0
5
...feel disappointed in myself 0
5
...feel am very critical of myself 0
5
...feel like harming myself 0
5
...feel like crying more than usual 0
5
...become annoyed or irritated easily 0
5
...have lost interest in other people 0
5
...have trouble making decisions 0
5
...feel unattractive 0
5
...feel like not working 0
5
...have trouble sleeping 0
5
...feel tired or fatigued 0
5
...makes my appetite lower than usual 0
5
...concerned about my health 0
5
...experience decreased libido 0 0
5
0
5
0
5
0
5
0
5
C. Huber (StataCorp)
0
5
0
5
July 27, 2012
0
5
0
5
0
5
67 / 127
Psychometrics With Stata The Pilot Study Dimensionality and Exploratory Factor Analysis
Spearman Rank Correlation Matrix . quietly spearman qu1_t1-qu20_t1 . matrix list r(Rho), format(%4.2f) nonames noheader 1.00 0.75 0.74 0.76 0.75 0.76 0.73 0.73 0.78 0.75 0.25 0.19 0.21 0.29 0.21 0.26 0.19 0.23 0.12 0.19
1.00 0.78 0.75 0.76 0.78 0.71 0.74 0.73 0.74 0.20 0.09 0.18 0.17 0.12 0.19 0.19 0.15 0.06 0.14
1.00 0.78 0.71 0.79 0.76 0.78 0.77 0.75 0.29 0.28 0.27 0.30 0.25 0.27 0.34 0.25 0.19 0.21
1.00 0.76 0.81 0.72 0.76 0.76 0.74 0.34 0.33 0.38 0.39 0.34 0.30 0.32 0.34 0.25 0.30
1.00 0.77 0.66 0.69 0.75 0.77 0.30 0.30 0.30 0.32 0.25 0.38 0.30 0.32 0.24 0.25
1.00 0.78 0.77 0.79 0.80 0.23 0.15 0.20 0.28 0.20 0.26 0.20 0.14 0.22 0.23
1.00 0.71 0.74 0.71 0.26 0.28 0.25 0.29 0.28 0.32 0.28 0.25 0.25 0.24
1.00 0.77 0.76 0.20 0.22 0.24 0.28 0.20 0.25 0.24 0.21 0.15 0.24
1.00 0.78 0.28 0.30 0.30 0.33 0.28 0.29 0.25 0.26 0.20 0.33
C. Huber (StataCorp)
1.00 0.18 0.12 0.14 0.22 0.15 0.20 0.15 0.14 0.08 0.14
1.00 0.71 0.77 0.72 0.72 0.68 0.68 0.69 0.64 0.66
1.00 0.72 0.69 0.77 0.69 0.66 0.71 0.64 0.65
1.00 0.74 0.75 0.66 0.71 0.70 0.70 0.73
July 27, 2012
1.00 0.76 0.62 0.71 0.66 0.62 0.74
1.00 0.75 0.69 0.74 0.73 0.73
1.00 0.63 0.68 0.66 0.67
1.00 0.69 0.64 0.63
1.00 0.67 0.66
1.00 0.69
68 / 127
1.00
Psychometrics With Stata The Pilot Study Dimensionality and Exploratory Factor Analysis
Kendall’s Tau-a Rank Correlation Matrix . quietly ktau qu1_t1-qu20_t1, stats(taua) . matrix list r(Tau_a), format(%4.2f) nonames noheader 0.68 0.47 0.47 0.49 0.48 0.48 0.45 0.45 0.49 0.48 0.15 0.11 0.12 0.17 0.12 0.15 0.11 0.13 0.07 0.11
0.69 0.49 0.48 0.48 0.50 0.44 0.46 0.45 0.46 0.11 0.05 0.10 0.10 0.07 0.11 0.11 0.08 0.03 0.08
0.69 0.50 0.45 0.51 0.48 0.48 0.48 0.47 0.17 0.16 0.16 0.17 0.15 0.16 0.20 0.14 0.11 0.12
0.69 0.49 0.52 0.44 0.48 0.47 0.46 0.20 0.19 0.22 0.23 0.20 0.17 0.18 0.19 0.15 0.18
0.69 0.49 0.41 0.43 0.47 0.49 0.17 0.17 0.17 0.19 0.15 0.22 0.17 0.17 0.14 0.15
0.70 0.49 0.48 0.49 0.51 0.13 0.08 0.11 0.17 0.12 0.15 0.11 0.08 0.13 0.14
0.65 0.43 0.45 0.43 0.14 0.16 0.14 0.17 0.16 0.19 0.16 0.13 0.14 0.14
0.65 0.46 0.47 0.12 0.13 0.13 0.17 0.11 0.14 0.13 0.12 0.08 0.14
0.65 0.48 0.16 0.17 0.16 0.19 0.16 0.17 0.14 0.14 0.12 0.19
C. Huber (StataCorp)
0.67 0.10 0.07 0.08 0.12 0.09 0.11 0.08 0.07 0.05 0.08
0.62 0.41 0.46 0.43 0.43 0.40 0.38 0.38 0.37 0.39
0.62 0.42 0.42 0.46 0.41 0.37 0.40 0.37 0.39
0.63 0.45 0.45 0.39 0.41 0.39 0.42 0.45
July 27, 2012
0.67 0.46 0.37 0.42 0.37 0.38 0.46
0.65 0.45 0.41 0.42 0.44 0.45
0.64 0.36 0.38 0.40 0.41
0.60 0.37 0.37 0.37
0.56 0.38 0.37
0.66 0.42
69 / 127
0.69
Psychometrics With Stata The Pilot Study Dimensionality and Exploratory Factor Analysis
Kendall’s Tau-b Rank Correlation Matrix . quietly ktau qu1_t1-qu20_t1, stats(taub) . matrix list r(Tau_b), format(%4.2f) nonames noheader 1.00 0.69 0.68 0.71 0.70 0.70 0.67 0.67 0.73 0.70 0.22 0.17 0.18 0.25 0.18 0.23 0.16 0.21 0.11 0.16
1.00 0.71 0.69 0.70 0.72 0.66 0.68 0.67 0.67 0.17 0.08 0.15 0.14 0.11 0.17 0.17 0.13 0.05 0.12
1.00 0.73 0.65 0.73 0.71 0.72 0.71 0.69 0.25 0.24 0.24 0.26 0.22 0.24 0.30 0.22 0.16 0.18
1.00 0.70 0.75 0.66 0.71 0.71 0.68 0.30 0.29 0.34 0.34 0.30 0.26 0.28 0.30 0.22 0.26
1.00 0.70 0.60 0.64 0.70 0.71 0.26 0.26 0.26 0.27 0.22 0.33 0.26 0.28 0.20 0.22
1.00 0.73 0.72 0.73 0.74 0.20 0.13 0.17 0.24 0.17 0.23 0.18 0.12 0.20 0.20
1.00 0.66 0.68 0.65 0.23 0.25 0.22 0.26 0.24 0.29 0.25 0.22 0.22 0.21
1.00 0.71 0.71 0.18 0.20 0.21 0.25 0.18 0.22 0.21 0.19 0.13 0.21
1.00 0.73 0.24 0.26 0.26 0.29 0.25 0.26 0.22 0.23 0.18 0.28
C. Huber (StataCorp)
1.00 0.16 0.11 0.13 0.19 0.13 0.17 0.13 0.12 0.07 0.12
1.00 0.67 0.73 0.67 0.67 0.64 0.63 0.65 0.59 0.60
1.00 0.68 0.65 0.73 0.65 0.61 0.67 0.58 0.60
1.00 0.70 0.71 0.62 0.66 0.66 0.65 0.68
July 27, 2012
1.00 0.71 0.57 0.67 0.61 0.57 0.68
1.00 0.70 0.65 0.70 0.68 0.68
1.00 0.58 0.64 0.62 0.62
1.00 0.64 0.59 0.58
1.00 0.62 0.60
1.00 0.63
70 / 127
1.00
Psychometrics With Stata The Pilot Study Dimensionality and Exploratory Factor Analysis
Simple Covariance Matrix . quietly corr qu1_t1-qu20_t1, cov means . matrix list r(C), format(%4.2f) nonames noheader 0.75 0.60 0.58 0.59 0.63 0.59 0.51 0.54 0.54 0.58 0.16 0.13 0.14 0.22 0.14 0.18 0.14 0.15 0.11 0.16
0.86 0.62 0.62 0.68 0.65 0.54 0.60 0.55 0.59 0.15 0.08 0.14 0.16 0.12 0.16 0.18 0.13 0.08 0.15
0.78 0.61 0.60 0.61 0.54 0.57 0.54 0.59 0.19 0.18 0.18 0.22 0.18 0.19 0.22 0.15 0.14 0.16
0.79 0.65 0.62 0.51 0.59 0.56 0.58 0.24 0.22 0.26 0.28 0.24 0.23 0.22 0.22 0.20 0.23
0.89 0.62 0.52 0.58 0.59 0.65 0.23 0.23 0.22 0.28 0.23 0.29 0.24 0.24 0.21 0.23
0.80 0.56 0.58 0.55 0.61 0.16 0.08 0.14 0.21 0.12 0.18 0.14 0.09 0.16 0.18
0.65 0.51 0.48 0.51 0.17 0.17 0.17 0.22 0.18 0.22 0.19 0.15 0.17 0.20
0.75 0.53 0.58 0.16 0.16 0.15 0.22 0.15 0.20 0.18 0.15 0.14 0.19
0.69 0.56 0.18 0.19 0.18 0.23 0.19 0.19 0.17 0.15 0.14 0.24
C. Huber (StataCorp)
0.78 0.11 0.07 0.09 0.16 0.12 0.13 0.10 0.09 0.07 0.09
0.65 0.45 0.49 0.51 0.49 0.46 0.43 0.42 0.47 0.47
0.59 0.45 0.49 0.50 0.46 0.41 0.42 0.45 0.46
0.62 0.53 0.50 0.45 0.44 0.43 0.49 0.52
July 27, 2012
0.74 0.55 0.47 0.50 0.43 0.49 0.57
0.68 0.52 0.47 0.48 0.53 0.56
0.65 0.41 0.43 0.50 0.50
0.60 0.41 0.44 0.46
0.54 0.44 0.45
0.73 0.54
71 / 127
0.79
Psychometrics With Stata The Pilot Study Dimensionality and Exploratory Factor Analysis
Pearson Correlation Matrix . quietly corr qu1_t1-qu20_t1 . matrix list r(C), format(%4.2f) nonames noheader 1.00 0.75 0.76 0.76 0.78 0.76 0.73 0.72 0.76 0.76 0.22 0.19 0.20 0.29 0.20 0.25 0.20 0.24 0.15 0.20
1.00 0.75 0.75 0.78 0.78 0.73 0.75 0.72 0.73 0.20 0.12 0.19 0.20 0.15 0.21 0.26 0.20 0.11 0.18
1.00 0.78 0.72 0.77 0.76 0.75 0.74 0.76 0.27 0.26 0.25 0.29 0.25 0.26 0.32 0.23 0.19 0.21
1.00 0.78 0.78 0.71 0.77 0.75 0.73 0.33 0.33 0.37 0.36 0.33 0.32 0.32 0.34 0.27 0.29
1.00 0.74 0.69 0.71 0.75 0.78 0.30 0.31 0.29 0.35 0.29 0.38 0.33 0.34 0.26 0.27
1.00 0.77 0.76 0.74 0.78 0.23 0.11 0.19 0.28 0.17 0.24 0.20 0.14 0.21 0.23
1.00 0.73 0.72 0.72 0.25 0.27 0.26 0.32 0.27 0.33 0.30 0.26 0.25 0.27
1.00 0.74 0.76 0.24 0.24 0.23 0.29 0.22 0.28 0.26 0.23 0.19 0.25
1.00 0.76 0.27 0.29 0.28 0.33 0.27 0.28 0.26 0.24 0.19 0.32
C. Huber (StataCorp)
1.00 0.16 0.11 0.13 0.21 0.16 0.19 0.14 0.13 0.09 0.12
1.00 0.74 0.78 0.74 0.74 0.71 0.69 0.70 0.68 0.66
1.00 0.75 0.74 0.79 0.74 0.69 0.74 0.69 0.68
1.00 0.78 0.77 0.70 0.72 0.73 0.73 0.74
July 27, 2012
1.00 0.77 0.68 0.74 0.68 0.67 0.75
1.00 0.78 0.73 0.78 0.75 0.76
1.00 0.66 0.72 0.73 0.69
1.00 0.71 0.66 0.67
1.00 0.70 0.69
1.00 0.72
72 / 127
1.00
Psychometrics With Stata The Pilot Study Dimensionality and Exploratory Factor Analysis
Test of Univariate Normality For Each Question . sktest qu1_t1-qu20_t1 Skewness/Kurtosis tests for Normality Variable
Obs
Pr(Skewness)
Pr(Kurtosis)
adj chi2(2)
qu1_t1 qu2_t1 qu3_t1 qu4_t1 qu5_t1 qu6_t1 qu7_t1 qu8_t1 qu9_t1 qu10_t1 qu11_t1 qu12_t1 qu13_t1 qu14_t1 qu15_t1 qu16_t1 qu17_t1 qu18_t1 qu19_t1 qu20_t1
100 100 100 100 100 100 100 100 100 100 100 100 100 100 100 100 100 100 100 100
0.6399 0.6902 0.6441 0.5535 0.7737 0.6302 0.4207 0.1897 0.1973 0.4698 0.9611 0.4726 0.3664 0.3362 0.6689 0.1174 0.0599 0.0688 0.1073 0.0691
0.8266 0.8652 0.6682 0.9643 0.7742 0.4610 0.9779 0.2654 0.7911 0.5995 0.1937 0.4254 0.4896 0.3805 0.3861 0.5234 0.1748 0.0573 0.7823 0.3650
0.27 0.19 0.40 0.36 0.16 0.79 0.66 3.04 1.77 0.81 1.73 1.18 1.32 1.74 0.95 2.94 5.27 6.47 2.74 4.24
C. Huber (StataCorp)
joint Prob>chi2
July 27, 2012
0.8751 0.9104 0.8179 0.8366 0.9208 0.6738 0.7189 0.2186 0.4117 0.6659 0.4205 0.5554 0.5162 0.4199 0.6210 0.2303 0.0717 0.0393 0.2539 0.1199
73 / 127
Psychometrics With Stata The Pilot Study Dimensionality and Exploratory Factor Analysis
Tests of Multivariate Normality and Sphericity . mvtest normality qu1_t1-qu20_t1, all Test for multivariate normality Mardia mSkewness = Mardia mKurtosis = Henze-Zirkler = Doornik-Hansen
92.7382 437.7267 1.006083
chi2(1540) chi2(1) chi2(1) chi2(40)
= 1596.522 = 0.147 = 121.119 = 33.101
Prob>chi2 Prob>chi2 Prob>chi2 Prob>chi2
= = = =
0.1543 0.7016 0.0000 0.7719
. mvtest covariances qu1_t1-qu20_t1, spherical Test that covariance matrix is spherical Adjusted LR chi2(209) = Prob > chi2 =
2035.12 0.0000
C. Huber (StataCorp)
July 27, 2012
74 / 127
Psychometrics With Stata The Pilot Study Dimensionality and Exploratory Factor Analysis
Pearson Correlation Matrix And Cronbach’s Alpha . quietly corr qu1_t1-qu20_t1 . matrix QuesCorr = r(C) . matrix list QuesCorr, format(%4.2f) nonames noheader 1.00 0.75 0.76 0.76 0.78 0.76 0.73 0.72 0.76 0.76 0.22 0.19 0.20 0.29 0.20 0.25 0.20 0.24 0.15 0.20
1.00 0.75 0.75 0.78 0.78 0.73 0.75 0.72 0.73 0.20 0.12 0.19 0.20 0.15 0.21 0.26 0.20 0.11 0.18
1.00 0.78 0.72 0.77 0.76 0.75 0.74 0.76 0.27 0.26 0.25 0.29 0.25 0.26 0.32 0.23 0.19 0.21
1.00 0.78 0.78 0.71 0.77 0.75 0.73 0.33 0.33 0.37 0.36 0.33 0.32 0.32 0.34 0.27 0.29
1.00 0.74 0.69 0.71 0.75 0.78 0.30 0.31 0.29 0.35 0.29 0.38 0.33 0.34 0.26 0.27
1.00 0.77 0.76 0.74 0.78 0.23 0.11 0.19 0.28 0.17 0.24 0.20 0.14 0.21 0.23
1.00 0.73 0.72 0.72 0.25 0.27 0.26 0.32 0.27 0.33 0.30 0.26 0.25 0.27
1.00 0.74 0.76 0.24 0.24 0.23 0.29 0.22 0.28 0.26 0.23 0.19 0.25
1.00 0.76 0.27 0.29 0.28 0.33 0.27 0.28 0.26 0.24 0.19 0.32
1.00 0.16 0.11 0.13 0.21 0.16 0.19 0.14 0.13 0.09 0.12
1.00 0.74 0.78 0.74 0.74 0.71 0.69 0.70 0.68 0.66
1.00 0.75 0.74 0.79 0.74 0.69 0.74 0.69 0.68
1.00 0.78 0.77 0.70 0.72 0.73 0.73 0.74
1.00 0.77 0.68 0.74 0.68 0.67 0.75
1.00 0.78 0.73 0.78 0.75 0.76
1.00 0.66 0.72 0.73 0.69
1.00 0.71 0.66 0.67
1.00 0.70 0.69
1.00 0.72
. // CHECK CHRONBACH’S ALPHA FOR THE ENTIRE GROUP OF QUESTIONS . alpha qu1_t1-qu20_t1, std Test scale = mean(standardized items) Average interitem correlation: Number of items in the scale: Scale reliability coefficient:
0.4759 20 0.9478
C. Huber (StataCorp)
July 27, 2012
75 / 127
1.00
Psychometrics With Stata The Pilot Study Dimensionality and Exploratory Factor Analysis
Remove Correlations chi2 = 0.6937 Factor loadings (pattern matrix) and unique variances Variable
Factor1
Factor2
qu1_t1 qu2_t1 qu3_t1 qu4_t1 qu5_t1 qu6_t1 qu7_t1 qu8_t1 qu9_t1 qu10_t1 qu11_t1 qu12_t1 qu13_t1 qu14_t1 qu15_t1 qu16_t1 qu17_t1 qu18_t1 qu19_t1 qu20_t1
0.7342 0.7076 0.7595 0.8090 0.7922 0.7326 0.7513 0.7413 0.7620 0.6924 0.6453 0.6362 0.6590 0.6904 0.6647 0.6634 0.6399 0.6380 0.5913 0.6280
-0.4668 -0.5015 -0.4273 -0.3510 -0.3631 -0.5008 -0.3762 -0.4310 -0.3944 -0.5459 0.5352 0.5844 0.5794 0.5122 0.6131 0.5106 0.5071 0.5576 0.5757 0.5412
Uniqueness 0.2430 0.2478 0.2405 0.2223 0.2405 0.2124 0.2940 0.2647 0.2638 0.2225 0.2972 0.2536 0.2300 0.2611 0.1823 0.2992 0.3334 0.2820 0.3189 0.3127
C. Huber (StataCorp)
July 27, 2012
85 / 127
Psychometrics With Stata The Pilot Study Dimensionality and Exploratory Factor Analysis
Factor Loadings (No Rotation)
qu15_t1 qu13_t1 qu19_t1 qu12_t1 qu18_t1 qu20_t1 qu11_t1 qu16_t1qu14_t1 qu17_t1
Factor 2 0
.5
Factor loadings
−.5
qu4_t1 qu5_t1 qu8_t1 qu1_t1 qu7_t1 qu9_t1 qu2_t1 qu6_t1 qu3_t1 qu10_t1 .6
.65
C. Huber (StataCorp)
.7 Factor 1
July 27, 2012
.75
.8
86 / 127
Psychometrics With Stata The Pilot Study Dimensionality and Exploratory Factor Analysis
Factor Loadings (VariMax Rotation)
1
Factor loadings
Factor 2 .4 .6
.8
qu15_t1 qu13_t1 qu12_t1 qu18_t1 qu14_t1 qu11_t1 qu19_t1 qu20_t1 qu16_t1 qu17_t1
0
.2
qu4_t1 qu5_t1 qu7_t1 qu9_t1 qu3_t1 qu8_t1 qu6_t1 qu1_t1 qu2_t1 qu10_t1 0
.2
.4 Factor 1
.6
.8
Rotation: orthogonal varimax Method: maximum likelihood
C. Huber (StataCorp)
July 27, 2012
87 / 127
Psychometrics With Stata The Pilot Study Dimensionality and Exploratory Factor Analysis
Factor Loadings (ProMax Rotation)
1
Factor loadings
Factor 2 .5
qu15_t1 qu13_t1 qu12_t1 qu17_t1 qu18_t1 qu19_t1 qu11_t1 qu14_t1 qu20_t1 qu16_t1
0
qu4_t1 qu5_t1 qu7_t1 qu9_t1 qu3_t1 qu1_t1 qu8_t1 qu6_t1 qu2_t1 qu10_t1 0
.2
.4 Factor 1
.6
.8
1
Rotation: oblique promax(3) Method: maximum likelihood
C. Huber (StataCorp)
July 27, 2012
88 / 127
Psychometrics With Stata The Pilot Study Dimensionality and Exploratory Factor Analysis
Predicted Latent Variables Based On Factor Loadings . predict Factor1 Factor2, regression Scoring coefficients (method = regression; based on promax(3) rotated factors) Variable
Factor1
Factor2
qu1_t1 qu2_t1 qu3_t1 qu4_t1 qu5_t1 qu6_t1 qu7_t1 qu8_t1 qu9_t1 qu10_t1 qu11_t1 qu12_t1 qu13_t1 qu14_t1 qu15_t1 qu16_t1 qu17_t1 qu18_t1 qu19_t1 qu20_t1
0.11303 0.11213 0.11234 0.11802 0.10858 0.13304 0.08701 0.10091 0.09957 0.12832 0.00234 -0.00280 -0.00047 0.00861 -0.00452 0.00569 0.00385 -0.00009 -0.00460 0.00057
-0.00313 -0.00955 0.00398 0.01949 0.01504 -0.00884 0.00826 0.00189 0.00777 -0.01825 0.09845 0.12079 0.13446 0.11252 0.17602 0.09628 0.08478 0.10568 0.09250 0.09312
. corr Factor1 Factor2 (obs=100)
Factor1 Factor2
Factor1
Factor2
1.0000 0.3279
1.0000
C. Huber (StataCorp)
July 27, 2012
89 / 127
Psychometrics With Stata The Pilot Study Dimensionality and Exploratory Factor Analysis
C. Huber (StataCorp)
July 27, 2012
90 / 127
Psychometrics With Stata The Pilot Study Dimensionality and Exploratory Factor Analysis
The Pilot Study
Descriptive Statistics Item Response Characteristics Reliability Validity Dimensionality and Exploratory Factor Analysis
C. Huber (StataCorp)
July 27, 2012
91 / 127
Psychometrics With Stata The Full Study Confirmatory Factor Analysis Using SEM
The Full Study
The Stata Depression Index was then administered to 1000 Stata users Analysis of the data included Confirmatory Factor Analysis Classical Univariate and Multivariate Models Structural Equation Models
C. Huber (StataCorp)
July 27, 2012
92 / 127
Psychometrics With Stata The Full Study Confirmatory Factor Analysis Using SEM
Description of the Stata User Data . describe Contains data from BDI2_Data.dta obs: 1,000 vars: 27 size: 28,000 variable name id age sex race qu1 qu2 qu3 qu4 qu5 qu6 qu7 qu8 qu9 qu10 qu11 qu12 qu13 qu14 qu15 qu16 qu17 qu18 qu19 qu20
11 Jul 2012 08:54
storage type
display format
value label
variable label
int byte byte byte byte byte byte byte byte byte byte byte byte byte byte byte byte byte byte byte byte byte byte byte
%9.0g %9.0g %9.0g %9.0g %16.0g %16.0g %16.0g %16.0g %16.0g %16.0g %16.0g %16.0g %16.0g %16.0g %16.0g %16.0g %16.0g %16.0g %16.0g %16.0g %16.0g %16.0g %16.0g %16.0g
sex race qu1_t1 qu2_t1 qu3_t1 qu4_t1 qu5_t1 qu6_t1 qu7_t1 qu8_t1 qu9_t1 qu10_t1 qu11_t1 qu12_t1 qu13_t1 qu14_t1 qu15_t1 qu16_t1 qu17_t1 qu18_t1 qu19_t1 qu20_t1
Identification Number Age (years) Sex Race ...feel sad ...feel pessimistic about the future ...feel like a failure ...feel dissatisfied ...feel guilty or unworthy ...feel that I am being punished ...feel disappointed in myself ...feel am very critical of myself ...feel like harming myself ...feel like crying more than usual ...become annoyed or irritated easily ...have lost interest in other people ...have trouble making decisions ...feel unattractive ...feel like not working ...have trouble sleeping ...feel tired or fatigued ...makes my appetite lower than usual ...concerned about my health ...experience decreased libido
C. Huber (StataCorp)
July 27, 2012
93 / 127
Psychometrics With Stata The Full Study Confirmatory Factor Analysis Using SEM
Summary of the Stata User Data . summ Variable
Obs
Mean
Std. Dev.
Min
Max
id age sex race
1000 1000 1000 1000
500.5 36.542 .288 2.38
288.8194 9.48009 .4530577 .7085916
1 22 0 1
1000 60 1 3
qu1 qu2 qu3 qu4 qu5
1000 1000 1000 1000 1000
2.986 2.637 2.978 2.955 2.944
.859385 .8461365 .856884 .8292543 .8506395
1 1 1 1 1
5 5 5 5 5
qu6 qu7 qu8 qu9 qu10
1000 1000 1000 1000 1000
2.955 2.96 2.955 2.964 2.954
.8693277 .8503665 .8553986 .8481883 .85476
1 1 1 1 1
5 5 5 5 5
qu11 qu12 qu13 qu14 qu15
1000 1000 1000 1000 1000
2.999 2.984 2.985 2.421 2.793
.8060078 .7977345 .8008848 .8200192 .8466805
1 1 1 1 1
5 5 5 5 5
qu16 qu17 qu18 qu19 qu20
1000 1000 1000 1000 1000
3 2.988 2.969 3.002 1.982
.7953821 .7965491 .8116019 .8041409 .8308829
1 1 1 1 1
5 5 5 5 4
C. Huber (StataCorp)
July 27, 2012
94 / 127
Psychometrics With Stata The Full Study Confirmatory Factor Analysis Using SEM
Confirmatory Factor Analysis ε1
ε2
ε3
ε4
ε5
ε6
ε7
ε8
ε9
ε10
qu1
qu2
qu3
qu4
qu5
qu6
qu7
qu8
qu9
qu10
F1
F2
qu11
qu12
qu13
qu14
qu15
qu16
qu17
qu18
qu19
qu20
ε11
ε12
ε13
ε14
ε15
ε16
ε17
ε18
ε19
ε20
C. Huber (StataCorp)
July 27, 2012
95 / 127
Psychometrics With Stata The Full Study Confirmatory Factor Analysis Using SEM
Confirmatory Factor Analysis ε1
ε2
ε3
ε4
ε5
ε6
ε7
ε8
ε9
ε10
qu1
qu2
qu3
qu4
qu5
qu6
qu7
qu8
qu9
qu10
F1
F2
qu11
qu12
qu13
qu14
qu15
qu16
qu17
qu18
qu19
qu20
ε11
ε12
ε13
ε14
ε15
ε16
ε17
ε18
ε19
ε20
C. Huber (StataCorp)
July 27, 2012
96 / 127
Psychometrics With Stata The Full Study Confirmatory Factor Analysis Using SEM
Likelihood Ratio Test For the Constrained vs Unconstrained Covariance Between Latent Factors // STRUCTURAL EQUATION MODEL WITH UNCONSTRAINTED COVARIANCE BETWEEN LATENT FACTORS sem (F1 -> qu1-qu10) /// (F2 -> qu11-qu20), stand est store full // STRUCTURAL EQUATION MODEL WITH COVARIANCE BETWEEN LATENT FACTORS CONSTRAINED TO ZERO sem (F1 -> qu1-qu10) /// (F2 -> qu11-qu20), /// cov(F1*F2@0) stand est store reduced lrtest full reduced . lrtest full reduced Likelihood-ratio test (Assumption: reduced nested in full)
C. Huber (StataCorp)
LR chi2(1) = Prob > chi2 =
July 27, 2012
153.33 0.0000
97 / 127
Psychometrics With Stata The Full Study Confirmatory Factor Analysis Using SEM
Score Test For the Constrained vs Unconstrained Covariance Between Latent Factors // STRUCTURAL EQUATION MODEL WITH COVARIANCE BETWEEN FACTORS CONSTRAINED TO ZERO sem (F1 -> qu1-qu10) /// (F2 -> qu11-qu20), /// cov(Affective*Physical@0) stand . estat scoretests Score tests for linear constraints (3)
[cov(F1,F2)]_cons = 0
( 3)
chi2
df
P>chi2
142.127
1
0.00
C. Huber (StataCorp)
July 27, 2012
98 / 127
Psychometrics With Stata The Full Study Confirmatory Factor Analysis Using SEM
Create Predicted Variables from the Latent Variables sem (F1 -> qu1-qu10) /// (F2 -> qu11-qu20), stand // CREATE PREDICTED VARIABLES FOR THE LATENT VARIABLES predict F1 F2, latent(Affective Physical) label var F1 "Factor 1 (Affective)" label var F2 "Factor 2 (Physical)"
C. Huber (StataCorp)
July 27, 2012
99 / 127
Psychometrics With Stata The Full Study Classical Multivariate Analysis of Sex
Student’s t-test for Latent Variable F1 by Sex Factor 1 by Sex 2.5 2 1.5 1
Factor 1
.5 0 −.5 −1 −1.5 −2 −2.5
Female
Male
. ttest F1, by(sex) Two-sample t test with equal variances Group
Obs
Mean
Std. Err.
Std. Dev.
Female Male
712 288
.0018819 -.0046524
.0271581 .04334
.7246673 .7355044
-.0514377 -.089957
.0552014 .0806522
combined
1000
-1.44e-10
.0230037
.727442
-.0451412
.0451412
.0065343
.0508248
-.0932016
.1062701
diff
diff = mean(Female) - mean(Male) Ho: diff = 0 Ha: diff < 0 Pr(T < t) = 0.5511
[95% Conf. Interval]
t = degrees of freedom =
Ha: diff != 0 Pr(|T| > |t|) = 0.8977
C. Huber (StataCorp)
0.1286 998
Ha: diff > 0 Pr(T > t) = 0.4489
July 27, 2012
100 / 127
Psychometrics With Stata The Full Study Classical Multivariate Analysis of Sex
Student’s t-test for Latent Variable F2 by Sex Factor 2 by Sex 2.5 2 1.5 1
Factor 2
.5 0 −.5 −1 −1.5 −2 −2.5
Female
Male
. ttest F2, by(sex) Two-sample t test with equal variances Group
Obs
Mean
Std. Err.
Std. Dev.
Female Male
712 288
-.0187195 .0462789
.0247589 .0407991
.6606498 .6923839
-.0673288 -.0340246
.0298897 .1265823
combined
1000
-6.30e-10
.0211949
.6702416
-.0415916
.0415916
-.0649984
.0467835
diff
diff = mean(Female) - mean(Male) Ho: diff = 0 Ha: diff < 0 Pr(T < t) = 0.0825
[95% Conf. Interval]
-.1568038 t = degrees of freedom =
Ha: diff != 0 Pr(|T| > |t|) = 0.1650
C. Huber (StataCorp)
.026807 -1.3893 998
Ha: diff > 0 Pr(T > t) = 0.9175
July 27, 2012
101 / 127
Psychometrics With Stata The Full Study Classical Multivariate Analysis of Sex
Hotelling’s T-Squared for Latent Variables F1 and F2 by Sex Factors 1 and 2 by Sex Factor 1 (Affective)
Factor 2 (Physical)
2.5
Factor 1 and Factor 2
2 1.5 1 .5 0 −.5 −1 −1.5 −2 −2.5
Female
Male
. hotelling F1 F2, by(sex) -> sex = Female Variable F1 F2 -> sex = Male Variable
Obs
Mean
712 712
.0018819 -.0187195
Obs
Mean
Std. Dev. .7246673 .6606498
Min
Max
-1.891131 -1.78537
2.031987 2.00687
Min
Max
Std. Dev.
F1 288 -.0046524 .7355044 -1.790884 2.014114 F2 288 .0462789 .6923839 -1.7694 2.002456 2-group Hotelling’s T-squared = 2.5043409 F test statistic: ((1000-2-1)/(1000-2)(2)) x 2.5043409 = 1.2509158 H0: Vectors of means are equal for the two groups F(2,997) = 1.2509 Prob > F(2,997) = 0.2867
C. Huber (StataCorp)
July 27, 2012
102 / 127
Psychometrics With Stata The Full Study Structural Equation Model for Sex
Structural Equation Model Including Sex ε2
ε3
ε4
ε5
ε6
ε7
ε8
ε9
ε10
ε11
qu1
qu2
qu3
qu4
qu5
qu6
qu7
qu8
qu9
qu10
F1
ε1 ε12 sex F2
qu11
qu12
qu13
qu14
qu15
qu16
qu17
qu18
qu19
qu20
ε13
ε14
ε15
ε16
ε17
ε18
ε19
ε20
ε21
ε22
C. Huber (StataCorp)
July 27, 2012
103 / 127
Psychometrics With Stata The Full Study Classical Multivariate Analysis of Race
Oneway ANOVA for Latent Variable F1 by Race Factor 1 by Race 2.5 2 1.5 1
Factor 1
.5 0 −.5 −1 −1.5 −2 −2.5
Hispanic
Black
White
. anova F1 race Number of obs = 1000 Root MSE = .727742
R-squared = 0.0012 Adj R-squared = -0.0008
Source
Partial SS
df
MS
Model
.622465698
2
.311232849
0.59
0.5558
race
.622465698
2
.311232849
0.59
0.5558
Residual
528.020207
997
.529609034
Total
528.642673
999
.529171845
C. Huber (StataCorp)
F
Prob > F
July 27, 2012
104 / 127
Psychometrics With Stata The Full Study Classical Multivariate Analysis of Race
Oneway ANOVA for Latent Variable F2 by Race Factor 2 by Race 2.5 2 1.5 1
Factor 2
.5 0 −.5 −1 −1.5 −2 −2.5
Hispanic
Black
White
. anova F2 race Number of obs = 1000 Root MSE = .670744
R-squared = 0.0005 Adj R-squared = -0.0015
Source
Partial SS
df
MS
F
Model
.2265257
2
.11326285
0.25
0.7775
race
.2265257
2
.11326285
0.25
0.7775
Residual
448.548027
997
.449897721
Total
448.774553
999
.449223777
C. Huber (StataCorp)
Prob > F
July 27, 2012
105 / 127
Psychometrics With Stata The Full Study Classical Multivariate Analysis of Race
Multivariate ANOVA for Latent Variables F1 and F2 by Race Factors 1 and 2 by Race Factor 1 (Affective)
Factor 2 (Physical)
2.5
Factor 1 and Factor 2
2 1.5 1 .5 0 −.5 −1 −1.5 −2 −2.5
Hispanic
Black
White
. manova F1 F2 = race Number of obs = 1000 W = Wilks’ lambda L = Lawley-Hotelling trace P = Pillai’s trace R = Roy’s largest root Source race
Residual Total
Statistic W P L R
0.9986 0.0014 0.0014 0.0012
df
F(df1,
2
4.0 4.0 4.0 2.0
df2) = 1992.0 1994.0 1990.0 997.0
F
Prob>F
0.36 0.36 0.35 0.60
0.8406 0.8404 0.8408 0.5501
e a a u
997 999 e = exact, a = approximate, u = upper bound on F
C. Huber (StataCorp)
July 27, 2012
106 / 127
Psychometrics With Stata The Full Study Structural Equation Model for Race
Structural Equation Model Including Race ε2
ε3
ε4
ε5
ε6
ε7
ε8
ε9
ε10
ε11
qu1
qu2
qu3
qu4
qu5
qu6
qu7
qu8
qu9
qu10
F1 Black ε1 ε12 Hispanic F2
qu11
qu12
qu13
qu14
qu15
qu16
qu17
qu18
qu19
qu20
ε13
ε14
ε15
ε16
ε17
ε18
ε19
ε20
ε21
ε22
C. Huber (StataCorp)
July 27, 2012
107 / 127
Psychometrics With Stata The Full Study Contrasts and Pairwise Comparisons for Race
Reference Level Contrasts for Race // r. differences from a reference (base) level; the default . contrast r.race Contrasts of marginal linear predictions Margins
F1
F1
: asbalanced df
F
P>F
race (2 vs 1) (3 vs 1) Joint
1 1 2
0.67 1.18 0.59
0.4133 0.2786 0.5558
Residual
997
race (2 vs 1) (3 vs 1)
Contrast
Std. Err.
-.0605743 -.0767675
.0740141 .0708124
[95% Conf. Interval]
-.2058157 -.215726
.0846671 .062191
// THIS IS EQUIVALENT TO: contrast {race -1 1 0} /// {race -1 0 1}, equation(F1)
C. Huber (StataCorp)
July 27, 2012
108 / 127
Psychometrics With Stata The Full Study Contrasts and Pairwise Comparisons for Race
Adjacent Categories Contrasts for Race // a. differences from the next level (adjacent contrasts) . contrast a.race Contrasts of marginal linear predictions Margins
F1
F1
: asbalanced df
F
P>F
race (1 vs 2) (2 vs 3) Joint
1 1 2
0.67 0.10 0.59
0.4133 0.7475 0.5558
Residual
997
race (1 vs 2) (2 vs 3)
Contrast
Std. Err.
.0605743 .0161932
.0740141 .0502837
[95% Conf. Interval]
-.0846671 -.0824807
.2058157 .1148672
// THIS IS EQUIVALENT TO: contrast {race 1 -1 0} /// {race 0 1 -1}, equation(F1)
C. Huber (StataCorp)
July 27, 2012
109 / 127
Psychometrics With Stata The Full Study Contrasts and Pairwise Comparisons for Race
Grand Means Contrasts for Race // g. differences from the balanced grand mean . contrast g.race Contrasts of marginal linear predictions Margins
: asbalanced df
F
P>F
race (1 vs mean) (2 vs mean) (3 vs mean) Joint
1 1 1 2
1.02 0.18 0.90 0.59
0.3123 0.6723 0.3432 0.5558
Residual
997
F1
Contrast
Std. Err.
.0457806 -.0147937 -.0309869
.0452849 .0349582 .0326728
[95% Conf. Interval]
F1
race (1 vs mean) (2 vs mean) (3 vs mean)
-.0430841 -.0833938 -.0951022
.1346453 .0538064 .0331284
// THIS IS EQUIVALENT TO: contrast {race -0.6666 0.3333 0.3333} /// {race 0.3333 -0.6666 0.3333} /// {race 0.3333 0.3333 -0.6666}, equation(F1)
C. Huber (StataCorp)
July 27, 2012
110 / 127
Psychometrics With Stata The Full Study Contrasts and Pairwise Comparisons for Race
Pairwise Comparisons for Race Using The Tukey Adjustment . pwcompare race, equation(F1) effects mcompare(tukey) Pairwise comparisons of marginal linear predictions Margins : asbalanced Number of Comparisons F1
F1
race
race 2 vs 1 3 vs 1 3 vs 2
3
Contrast
Std. Err.
-.0605743 -.0767675 -.0161932
.0740141 .0708124 .0502837
t
Tukey P>|t|
-0.82 -1.08 -0.32
0.692 0.524 0.944
Tukey [95% Conf. Interval]
-.2343012 -.2429793 -.1342197
.1131526 .0894443 .1018332
Note: The tukey method requires balanced data for proper level coverage. A factor was found to be unbalanced.
C. Huber (StataCorp)
July 27, 2012
111 / 127
Psychometrics With Stata The Full Study Contrasts and Pairwise Comparisons for Race
Pairwise Comparisons for Race Using The Bonferroni Adjustment . pwcompare race, equation(F1) effects mcompare(bonf) Pairwise comparisons of marginal linear predictions Margins : asbalanced Number of Comparisons F1
F1
race
race 2 vs 1 3 vs 1 3 vs 2
3
Contrast
Std. Err.
-.0605743 -.0767675 -.0161932
.0740141 .0708124 .0502837
Bonferroni t P>|t|
-0.82 -1.08 -0.32
1.000 0.836 1.000
C. Huber (StataCorp)
Bonferroni [95% Conf. Interval]
-.2380622 -.2465776 -.1367748
.1169136 .0930426 .1043884
July 27, 2012
112 / 127
Psychometrics With Stata The Full Study Contrasts and Pairwise Comparisons for Race
Built-In Contrasts (as-balanced and as-observed Reference Level Contrasts Adjacent Levels Contrasts Differences From The Grand Mean Orthogonal Polynomials Helmert and Reverse-Helmert
Pairwise Comparison Adjustments Bonferroni Tukey Scheffe Duncan Dunnett Student-Newman-Keuls
C. Huber (StataCorp)
July 27, 2012
113 / 127
Psychometrics With Stata The Full Study Classical Multivariate Analysis for Age
Linear Regression for Latent Variable F1 by Age Factor 1 by Age Factor 1 (Affective)
Predicted F1
2.5 2 1.5
Factor 1
1 .5 0 −.5 −1 −1.5 −2 −2.5
20
30
40 Age (years)
50
60
. regress F1 age Source
SS
Model Residual
1.27353577 527.369137
Total
528.642673
F1
Coef.
age _cons
-.0037663 .1376267
df
MS
1 998
1.27353577 .528425989
999
.529171845
Std. Err. .002426 .091584
t -1.55 1.50
Number of obs F( 1, 998) Prob > F R-squared Adj R-squared Root MSE P>|t| 0.121 0.133
C. Huber (StataCorp)
= = = = = =
1000 2.41 0.1209 0.0024 0.0014 .72693
[95% Conf. Interval] -.008527 -.0420926
.0009945 .317346
July 27, 2012
114 / 127
Psychometrics With Stata The Full Study Classical Multivariate Analysis for Age
Linear Regression for Latent Variable F2 by Age Factors 1 and 2 by Age Factor 2 (Physical)
Predicted F2
2.5
Factor 1 and Factor 2
2 1.5 1 .5 0 −.5 −1 −1.5 −2 −2.5
20
30
40 Age (years)
50
60
. regress F2 age Source
SS
df
MS
Model Residual
2.62133472 446.153218
1 998
2.62133472 .447047313
Total
448.774553
999
.449223777
F2
Coef.
age _cons
-.0054034 .1974505
Std. Err. .0022314 .0842373
t -2.42 2.34
Number of obs F( 1, 998) Prob > F R-squared Adj R-squared Root MSE P>|t| 0.016 0.019
C. Huber (StataCorp)
= = = = = =
1000 5.86 0.0156 0.0058 0.0048 .66862
[95% Conf. Interval] -.0097822 .0321481
-.0010246 .362753
July 27, 2012
115 / 127
Psychometrics With Stata The Full Study Classical Multivariate Analysis for Age
Multivariate Regression for Latent Variables F1 and F2 by Age Factors 1 and 2 by Age Factor 1 (Affective) Predicted F1
Factor 2 (Physical) Predicted F2
2.5
Factor 1 and Factor 2
2 1.5 1 .5 0 −.5 −1 −1.5 −2 −2.5
20
30
40 Age (years)
50
60
. mvreg F1 F2 = age Equation F1 F2
Obs 1000 1000
Parms 2 2
Coef. F1
F2
RMSE .7269291 .668616
Std. Err.
"R-sq" 0.0024 0.0058 t
F 2.410055 5.863663
P>|t|
P 0.1209 0.0156
[95% Conf. Interval]
age _cons
-.0037663 .1376267
.002426 .091584
-1.55 1.50
0.121 0.133
-.008527 -.0420926
.0009945 .317346
age _cons
-.0054034 .1974505
.0022314 .0842373
-2.42 2.34
0.016 0.019
-.0097822 .0321481
-.0010246 .362753
C. Huber (StataCorp)
July 27, 2012
116 / 127
Psychometrics With Stata The Full Study Structural Equation Model for Age
Structural Equation Model Including Age ε2
ε3
ε4
ε5
ε6
ε7
ε8
ε9
ε10
ε11
qu1
qu2
qu3
qu4
qu5
qu6
qu7
qu8
qu9
qu10
F1 age ε1 ε12
F2
qu11
qu12
qu13
qu14
qu15
qu16
qu17
qu18
qu19
qu20
ε13
ε14
ε15
ε16
ε17
ε18
ε19
ε20
ε21
ε22
C. Huber (StataCorp)
July 27, 2012
117 / 127
Psychometrics With Stata The Full Study Margins and Margins Plot
Multivariate Regression Model Including Sex, Race and Age . mvreg F1 F2 = age i.sex##i.race Equation F1 F2
Obs 1000 1000
Parms 7 7
Coef. F1
F2
RMSE .72724 .6687077
Std. Err.
"R-sq" 0.0066 0.0106 t
F 1.092484 1.764698
P>|t|
P 0.3648 0.1032
[95% Conf. Interval]
age 1.sex
-.0036923 .1130077
.002429 .1333148
-1.52 0.85
0.129 0.397
-.0084588 -.1486033
.0010743 .3746188
race 2 3
-.040209 -.0114758
.0897508 .0863719
-0.45 -0.13
0.654 0.894
-.216332 -.1809682
.1359139 .1580165
sex#race 1 2 1 3
-.0427163 -.2035214
.1593227 .1509514
-0.27 -1.35
0.789 0.178
-.3553641 -.4997418
.2699314 .0926989
_cons
.156677
.1166336
1.34
0.179
-.0721996
.3855537
age 1.sex
-.0055679 .2013137
.0022335 .1225849
-2.49 1.64
0.013 0.101
-.0099509 -.0392415
-.001185 .4418689
race 2 3
.062532 .0100582
.0825271 .0794202
0.76 0.13
0.449 0.899
-.0994155 -.1457925
.2244796 .1659089
sex#race 1 2 1 3
-.208859 -.1206021
.1464995 .138802
-1.43 -0.87
0.154 0.385
-.4963432 -.392981
.0786251 .1517767
_cons
.1558802
.1072463
1.45
0.146
-.0545752
.3663356
C. Huber (StataCorp)
July 27, 2012
118 / 127
Psychometrics With Stata The Full Study Margins and Margins Plot
Linear Predictions of F1 at Ages 20,30,40,50 and 60 . margins , at(age=(20(10)60)) predict(equation(F1)) vsquish Predictive margins Number of obs Expression 1._at 2._at 3._at 4._at 5._at
: : : : : :
Margin _at 1 2 3 4 5
=
1000
Linear prediction, predict(equation(F1)) age = 20 age = 30 age = 40 age = 50 age = 60
.0610775 .0241548 -.0127679 -.0496906 -.0866133
Delta-method Std. Err. .0462963 .0279533 .0244832 .0399684 .0614453
z 1.32 0.86 -0.52 -1.24 -1.41
P>|z| 0.187 0.388 0.602 0.214 0.159
C. Huber (StataCorp)
[95% Conf. Interval] -.0296615 -.0306326 -.0607541 -.1280273 -.2070439
.1518166 .0789423 .0352184 .0286461 .0338174
July 27, 2012
119 / 127
Psychometrics With Stata The Full Study Margins and Margins Plot
Margins Plot of Latent Variable F1 at Ages 20,30,40,50 and 60 margins , at(age=(20(10)60)) predict(equation(F1)) vsquish marginsplot, scheme(s1color)
−.2
−.1
Linear Prediction 0
.1
.2
Predictive Margins with 95% CIs
20
30
C. Huber (StataCorp)
40 Age (years)
July 27, 2012
50
60
120 / 127
Psychometrics With Stata The Full Study Margins and Margins Plot
Margins Plot of Latent Variable F1 at By Sex at Ages 20-60 margins , over(sex) at(age=(20(10)60)) predict(equation(F1)) marginsplot, scheme(s1color)
Predictive Margins with 95% CIs Male
−.2
Linear Prediction −.1 0 .1
.2
Female
20
30
C. Huber (StataCorp)
40 Age (years)
July 27, 2012
50
60
121 / 127
Psychometrics With Stata The Full Study Margins and Margins Plot
Margins Plot of F1 at By Sex and Race at Ages 20-60 margins , over(race sex) at(age=(20(10)60)) predict(equation(F1)) marginsplot, scheme(s1color)
Predictive Margins with 95% CIs Hispanic, Male
Black, Female
Black, Male
White, Female
White, Male
−.4
Linear Prediction −.2 0 .2
.4
Hispanic, Female
20
30
C. Huber (StataCorp)
40 Age (years)
July 27, 2012
50
60
122 / 127
Psychometrics With Stata The Full Study Structural Equation Model
ε2
ε3
ε4
ε5
ε6
ε7
ε8
ε9
ε10
ε11
qu1
qu2
qu3
qu4
qu5
qu6
qu7
qu8
qu9
qu10
F1 Black
age ε1 ε12 sex
Hispanic F2
qu11
qu12
qu13
qu14
qu15
qu16
qu17
qu18
qu19
qu20
ε13
ε14
ε15
ε16
ε17
ε18
ε19
ε20
ε21
ε22
C. Huber (StataCorp)
July 27, 2012
123 / 127
Psychometrics With Stata The Full Study Structural Equation Model
ε2
ε3
ε4
ε5
ε6
ε7
ε8
ε9
ε10
ε11
qu1
qu2
qu3
qu4
qu5
qu6
qu7
qu8
qu9
qu10
Affective Black
age ε1 ε12 sex
Hispanic Physical
qu11
qu12
qu13
qu14
qu15
qu16
qu17
qu18
qu19
qu20
ε13
ε14
ε15
ε16
ε17
ε18
ε19
ε20
ε21
ε22
C. Huber (StataCorp)
July 27, 2012
124 / 127
Psychometrics With Stata The Full Study Structural Equation Model
.19
ε2
qu1
3.1
.21
ε3
qu2
2.8
.19
ε4
qu3
qu4
3.1 .96
1
.19
ε5
.18
ε6
qu5
3.1
.99
qu6
3.1
.96
.19
ε7
1
qu7
3.1
1
1
Affective
.35
.18
ε8
qu8
3.1
.99
.99
.55
ε12
.46
3.1
qu10
3.1
37
age ε1
qu9
.19
ε11
.99
.23 7.9e−02 .2 3.0e−02
.19
ε10
3.1
−3.8e−03
1.6e−02
Black
.19
ε9
90
−7.7e−03 −5.7e−03
.13
Hispanic
.29
sex
3.2e−02
.12
7.2e−02
Physical 1
qu11
ε13
3.2
.18
qu12
ε14
3.2
.16
qu13
ε15
1
3.2
.18
1
qu14
ε16
1.1
.99
2.6
.21
qu15
ε17
C. Huber (StataCorp)
3
.2
.98
.97
qu16
ε18
3.2
.2
.99
1
qu17
ε19
July 27, 2012
3.2
.18
.21
.95
qu18
ε20
3.1
.16
qu19
ε21
3.2
.19
qu20
ε22
2.1
.27
125 / 127
Psychometrics With Stata The Full Study Conclusions and References
Conclusions
For privacy reasons, we cannot reveal all the details of our analysis We are happy to report that Stata users are doing just fine Stata is very well equipped for both Classical and Modern psychometric analyses There were too many slides in this presentation!!!
C. Huber (StataCorp)
July 27, 2012
126 / 127
Psychometrics With Stata The Full Study Conclusions and References
References Bollen, KA (1989) Structural Equations with Latent Variables. New York, NY: Wiley Cohen, J, Cohen, P, West, SG and Aiken, LS (2003) Applied Multiple Regression/Correlation Analysis for the Behavioral Sciences, 3rd Ed. New York, NY: Routledge de Ayala, RJ (2009) The Theory and Practice of Item Response Theory. New York, NY: The Guilford Press Furr RM and Bacharach VR (2008) Psychometrics: An Introduction. Thousand Oaks, CA: Sage Hair, JF, Black, WC, Babin, BJ and Anderson, RE (2009) Multivariate Data Analysis, 7th Ed. New York, NY: Prentice Hall Kline, RB (2011) Principles and Practice of Structural Equation Modeling, 3rd Ed. New York, NY: The Guilford Press Raykov T and Marcoulides GA (2011) Introduction to Psychometric Theory. New York, NY: Routledge
C. Huber (StataCorp)
July 27, 2012
127 / 127


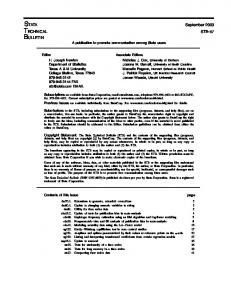


![Linear Regression using Stata - Princeton University [PDF]](https://m.moam.info/img/260x300/linear-regression-using-stata-princeton-university_64799574098a9e92458b457e.jpg)