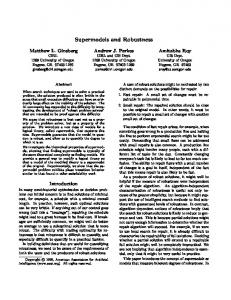
Controls. Phase IV. Figure L Relationship of the four QFD charts. ToothBrite Inc., a major toothpaste manufacturer, and your market share has suddenly dropped, ...
Quality Engineering, 11(4), 593-611 (1999)
QFD: VALIDATING ROBUSTNESS Kinnar K. Ghiya Intel Corporation 5000 W. Chandler Blvd., CH7-306 Chandler, Arizona 85226
A. Terry Bahill Systems and Industrial Engineering Department University of Arizona Tucson, Arizona 85721-0020
William L, Chapman Raytheon Systems Company Tucson, Arizona 85734
Key Words
cycle. "QFD therefore represents a change from manufacturing-process quality control to product development quality control" (1). In most implementations, QFD uses many matrixlike charts to discover interrelationships among customer demands, product characteristics, and manufacturing processes, as shown in Figure 1. For example, the first QFD chart compares the customer's demands to quality characteristics. The second chart then investigates the relationship between these quality characteristics and characteristics of the product. The third chart subsequently examines the relationships between these product characteristics and manufacturing processes. Finally, these manufacturing processes are compared to the quality controls that will be monitored during manufacturing.
Quality function deployment (QFD); Concurrent engineering; Sensitivity analysis; Total quality management (TQM). Introduction Quality function deployment (QFD) started in Japan in the late 1960s and is now used by half of Japan's major companies. It was introduced in American automobile manufacturing companies in the early 1980s and is being used by numerous American corporations (1,2). QFD is a handy tool for interdisciplinary teams. A typical QFD team will have members from marketing, sales, manufacturing, design, quality control, purchasing, and so on. "QFD enhances communication levels within the core team" (3). Quality function deployment strives to get the customer's view of quality introduced in the early phases of the design cycle and considered throughout the product's entire life
ToothBrite Inc.: A Heuristic Case Study In order to analyze QFD as a tool, we need an example to study; therefore, we will now present ToothBrite (4). Assume that you are the Chief Executive Officer of 593
Copyright © 1999 by Marcel Dekker, Inc.
www.dekker.com
GHIYA, BAHILL, AND CHAPMAN
594 Quality Characteristics
Product Characteristics
Customer Demands Phase I
Manufacturing Processes
Quality Characteristics Phase II
Quality Controls
Product Characteristics Phase III
Manufacturing Processes Phase IV Figure L
Relationship of the four QFD charts.
ToothBrite Inc., a major toothpaste manufacturer, and your market share has suddenly dropped, You suspect that this is a result of your competitor's new innovation. Crest® has developed a new toothpaste container called the Neat Squeeze dispenser and has endowed it with a substantial advertising budget, (To understand this example better, you might cut open a Crest® Neat Squeeze dispenser or a Colgate® Neat and Easy Stand Up dispenser and see how it is produced and what is inside.) To recapture your market share, you decide to redesign your product; therefore, you decide to use QFD as your analysis tool. We had our marketing department interview all people we thought could provide inputs for the system design. In the QFD literature, the aspects deemed important by the customer are called customer demands. Our marketing department derived the following customer demands: Neatness Tidy tip: The tip stays neat and clean.
Retains shape: the container retains its original shape. Stays put: The container will not roll off the counter. Hygienic: Toothpaste cannot touch the brush and then be drawn back into the container. Squeezable: People want to squeeze the container, not pump. Easy open: The cap opens and closes easily. No waste: Almost all the toothpaste comes out. Small footprint: Container takes little counter space. Reasonable cost: It should cost about the same as present containers. Attractive container: The sales department says that it must look good. After listing the demands, the customer assigns a weight indicating the relative importance of each demand. Usually, the weights are between 1 and 10, with 10 being most important. Figure 2a shows the customer demands on the left side and the associated weights in the right column.
1 Tidy Tip | Retains Shape Stays Put
I
I
iNo Waste
1
1
(Attractive Container
Ii
GO 03 •X
? gf|
o'
i l«t l
§. 1 315
U)
_
U)
SO so
SO so
Dashpot & Air Chamber
NO
SO sO
SO SO
Elastic Walls
13 59 3 211
vO
I
so
10 96
SO
8 100
VO
4 120 6 108 8 100 7 104
^
U)
11 92 ~
Sa
C0
^S1
i
^
-
so -
~ -
^
UJ
so
SO
~ ~ SO - so
~
^ u>
5 117
so
12 70
~
VO
U)
6 94
U)
OJ
Paste Viscosity Requirement
10 36
u>
Fixed Amount Dispensed
8 76
u>
New Cap Design
7 82
Flat Top & Bottom
5 110
U)
Retains Shape Squeezable Top & Bottom Stays Put Inexpensive Materials
4 126
SO
«
1 184
~
U)
(Squeezable Simple Manufacturing Processes Easy Open o Waste Graphic Designer mall Footprint Tamper Proof Package Reasonable Cost Importance (1 to 10) Alttractive Container
2 144
sO
NO
U) U)
OJ
-
U)
sO
U)
o SO
Plastic Walls
O-i
^
Lh
ON
^
00
UJ
U)
-
J^
ON •£> 0
| Tidy Tip
? o3 O
o*
1 Is* -*fc
9 72
Rigid Walls & Pump
so
1
»'
-
-
SO
Amount of Mess
vO
U>
Amount of Fullback
NO
-
U) \
3 137
00
I ?r
T)
Suction Device
2 252
I
ja
(fD*
CTQ
I
Ii
Amount of Pressure
-
Amount of Effort
NO
«
so
oo
\
-
-i £4-
•-• § 3 S 5" 5"
fB
1I - a • ^o^
CD
I
^< 5« CD ^
O CL
\
£ BS •5' ^ 8
I3 ^ n 55 p i «> ^ § " &
§
»5* &> £2.
S' «-* P" 2 » ^ ±r E
3^
CTQ CD g. Q* OO CD
CL S O ^*
S- BT sr a S O. I. g S" "cr ^ g ^< "*
i->
£ w (TO
D.
OO
•B. | to ^ jlJ
L^l cl
EL 3* r- ^T
8 >§
aa
s g & ^s»
§
£> B1 g1 ? s> Sw
o
o
P
a g. w,
W
>Tj ^
gj E?
$ V!
CTQ &^ )S ^ i-3 P
CD
p
CD M- ^ pr g.
O 'P S
^^
B S
B g - 8 . s3 - 8CD. 37" CL S
^
I » p
^! &.
5" to t
* 8±
S!
o ^ CL uo CL ^j CfQ CD
CD
?
- Weights
o n
00
o
< S s 00 rr S3* o w" 1. 11 §• £L n>
a
3£
2. £L w D S **?o
2a g §' & 3
tj
i!j
fS'
w ,R'
Sh
1
t
i1
O
a
!"!> l ^ 5CJ
Q-
fl
•n" £. sr
H oo
K>
O
S ' •^
r" "< w
D 51 w 1O
$ Ui
^ o
3 O
O ffi Jv^,
n
ii,r> >-h
Y*1^
n
|"T*j
r> R R
I 1^
H
§.
8-
O
o o
U)
so
OJ
Melt Temperature
3 O
o o
so
so
so
Extrude Temperature
U)
0
0 O
o
3 0 0 o SO so oo
sO
Extrude Speed
00
0
o
0
o
m
3
0 O 0 u>
SO
H— i
O
sw
Door Closing Effort
_
Pull Force (Inside)
sO
co
so
o o
5
SO
0
o
«* o
1» « i 1 0
o*
O
U) 00 ON
sn
K) U)
g g
0
Ul
Jf f
SO
Cure Temperature
o Punch Diameter 0
Punch Sharpness
Ul
Weights
1
sr sr H fe. H, H y n B 00 H 3
*3 i {g
1o 1
"8 n CL 1
O PH Tj>
"S
so
o o
SO
so
O
-
Static Hold Open Force
N)
so
SO
O
o o
O
Water Leak Test
«
SO
-
K>
00
Importance
g
a
tf
f
H
CL
-a
Tl O 3 O
1
0
SO
so
SO
Quality Control Chart .
Ul
SO
O
o
0
0
sO
O
0
O
Preventative Maintenance
Ul
sO
O
0
sO
0
O
O
0
0
Mistake Proofing
Ul
SO
0
0
SO
SO
so
sO
so
so
Education & Training
SO
0
0
ISJ
to
•5
3 *!
3
0
00
NJ 5 U) OO 0
sO
00
sO
»
115 2 s>
8 o' s ^ Qir* rn 3 o
o
-j
—
-J
M
11
Dynamic Hold Open Force —
o
Tj >-i O (J «
^1"''
H"H
S n
i. m ^ S?a CJQ
^
*H.
ro
U)
Outside Diameter
OJ
Inside Diameter
w
Shape
so
sO
Material Specification
0
SO
sO
Material Density
0
o
sO
so
Vent Hole Diameter
•-J
u>
Ul
00
Weights
UJ
« «
0
o\i U) UJ
K)
K) 0
Weights
1 U)
-
to
00
•-J
GO GO
QFD: VALIDATING ROBUSTNESS Table L
605 Results of Changing the Correlation Values for the Modified ToothBrite Example
Results of changing correlation values for the first modified ToothBrite chart Replace Original Replace Chart:! Replace Replace 931 with 731 931 with 531 931 with 930 931 with 421 931 HOWS 80 Dashpot & Air Chamber 79 79 80 79 100 100 100 Elastic Walls 100 100 20 Rigid Walls and Pump 22 15 18 23 Plastic Walls 66 65 63 65 65 33 38 Paste Viscosity Req. 30 26 38 35 Fixed Amount Dispensed 31 40 38 30 33 40 29 20 New Cap Design 42 38 39 40 Flat Top or Bottom 38 39 34 38 44 Squeezable Top & Bottom 28 45 32 Inexpensive Materials 31 34 29 34 Simple Manuf, Processes 33 34 36 29 37 41 47 34 Graphic Designer 37 45 24 Tamper Proof Package 22 28 20 28 0.00 2.57 Root Mean Square Change 6.50 3.69 6.54 Results of changing the correlation values for the second modified ToothBrite chart Replace Original Replace Replace Replace Chart: 2 931 with 731 931 with 531 931 with 930 931 with 421 931 HOWS 12 13 Double Lead Threads 14 7 13 36 46 Size of the Hole in the Tip 30 29 42 50 60 (Tube) Material Thickness 44 42 54 100 100 (Tube) Material Type 100 100 100 33 32 33 32 Size of the Dashpot 34 53 51 Viscosity of the Dashpot 47 54 49 5 7 1 Weight of the Container 4 7 28 32 Size of the Container 25 22 31 23 26 Printing on Label 29 19 28 51 54 Shape of the Container 49 43 52 Root Mean Square Change 0.00 3.16 8.20 3.19 5.84 Results of changing the correlation values for the third modified ToothBrite chart Replace Original Replace Replace Chart: 3 Replace 931 with 731 931 with 531 931 with 930 931 with 421 931 HOWS Create Mold 70 74 67 60 74 100 100 100 Blow Material 100 100 26 36 20 16 33 Remove Container 24 17 31 19 33 Insert and Bond Liner 16 21 13 13 Inserting Toothpaste 16 5 4 7 0 9 Screwing on Top 60 68 56 56 67 Ultrasonic Weld Bottom 43 50 39 Pasting or Printing Label 37 47 3.74 0.00 10.24 Root Mean Square Change 3.34 8.52 Results of changing the correlation values for the fourth modified ToothBrite chart Replace Replace Replace Replace Original Chart: 4 931 with 731 931 with 531 931 with 930 931 with 421 931 HOWS 100 66 83 85 77 Mold Dimensions 96 100 100 100 Temperature 100 57 33 50 33 42 Pressure (Matt. Control) 42 57 33 50 33 Time 24 31 17 Linear Attachment Inspect 19 19 20 13 13 ToothPaste Flowrate 13 16 5 6 Cap Attachment Torque 4 0 4 46 18 33 20 Intensity 29 18 25 39 18 28 Duration 64 72 58 56 61 Pressure (Welding Control) 48 37 39 39 43 Labeling Pressure 68 13 62 35 Cleanliness & Hygiene Ctrl 47 19.10 11.62 0.00 6.99 Root Mean Square Change 7.29
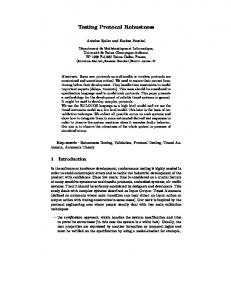
606
GHIYA, BAHILL, AND CHAPMAN 20.00 -r
-Q-931 with 531
18.00 16.00
-»- 931 with 731
-0-931 with 421
o 14.00 £ 12.00 §
CT CO
with 930
10.00 -8.00 6.00 4.00
2.00 0.00 Chart: 1 Figure 9.
Chart:2
Charfc3
Chart:4
Root mean square change due to global changes in correlation values of the modified ToothBrite charts.
heterogeneous groups (consisting of various engineering and management disciplines), where the group members can have different styles of thought process.
Change in Weights of Customer Demands Some QFD professional facilitators state that determining the importance of the customer demands is the most Table 2.
time-consuming activity in constructing the first chart. Also, what one customer sees as an important requirement may not be so important for another customer. So, there is a probability of conflict generation while determining the importance of the customer demands (Whats). In this situation, it will be useful to discover what effect this can have in the final outcome. Typically, these importance values are assigned on a scale of 1 to 10, 10 being the most important.
RMS Change in Scores Due to Changing the Correlation Values for the Other Examples
CHART 1 CHART 2 CHART 3 CHART 4
Original 9-3-1 0 0 0 0
Replace with Replace with Replace with Replace with 7-3-1 9-3-0 5-3-1 4-2-1 3.1 7.8 2.6 5.7 1.5 0.8 3.8 2.9 3.6 6.8 3.1 3.6 3.4 3.6 10.4 83
ASI Door System Example CHART 1 CHART 2 CHARTS CHART 4
Original 9-3-1 0 0 0 0
Replace with Replace with Replace with Replace with 4-2-1 7-3-1 5-3-1 9-3-0 6.2 6.4 7.8 1.9 3.7 9.6 2.5 6.7 4.4 2.9 8.3 7 0 1.5 1.2 0.9
Original 9-3-1 0 0 0
Replace with Replace with Replace with Replace with 5-3-1 7-3-1 4-2-1 9-3-0 1.4 3.6 3.3 1.8 11.2 4,4 3 9 3,3 8.9 8.1 4,4
Pencil Example
Video Game Example CHART 1 CHART 2 CHART 3
QFD: VALIDATING ROBUSTNESS
607
Table 3. Change in Ranks Due to Change in Correlation Values HOWS of Chart 4
Modified ToothBrite Example - Change in Ranks at Chart 4
Original Rank at Chart 4 Rank after 7-3-1 experiment Rank after 5-3-1 experiment Rank after 9-3-0 experiment Rank after 4-2-1 experiment HOWS of Chart 4
o.
Pencil Example - Change in Ranks at Chart 4
o S
•s •s Original Rank at Chart 4 Rank after 7-3-1 experiment Rank after 5-3-1 experiment Rank after 9-3-0 experiment Rank after 4-2-1 experiment
if
4 4 6 3 4
E
fn S
1
a
ra
3 3 3 3 3