Hindawi Wireless Communications and Mobile Computing Volume 2018, Article ID 9736360, 16 pages https://doi.org/10.1155/2018/9736360
Research Article QoE-Aware Scheduling Algorithm for Adaptive HTTP Video Delivery in Wireless Networks Frederico Rodrigues, Ivo Sousa , Maria Paula Queluz, and António Rodrigues Instituto de Telecomunicac¸o˜es, Instituto Superior T´ecnico, University of Lisbon, Portugal Correspondence should be addressed to Ivo Sousa;
[email protected] Received 13 April 2018; Revised 20 July 2018; Accepted 13 August 2018; Published 2 September 2018 Academic Editor: Mauro Femminella Copyright © 2018 Frederico Rodrigues et al. This is an open access article distributed under the Creative Commons Attribution License, which permits unrestricted use, distribution, and reproduction in any medium, provided the original work is properly cited. In the last years, the video content consumed by mobile users has increased exponentially. Since mobile network capacity cannot be increased as fast as required, it is crucial to develop intelligent schedulers that allocate radio resources very efficiently and are able to provide a high Quality of Experience (QoE) to most of the users. This paper proposes a new and effective scheduling solution—the Maximum Buffer Filling (MBF) algorithm—which aims to increase the number of satisfied users in video streaming services provided by wireless networks. The MBF algorithm uses the current buffer level at the client side and the radio channel conditions, which are reported to the network by the client, as well as the bitrate of the requested video segment. The proposed scheduling strategy can also fulfill different satisfaction criteria, since it can be tuned to maximize the numbers of users with high QoE levels or to minimize the number of users with low QoE levels. A simulation framework was developed, considering a Long Term Evolution (LTE) scenario, in order to assess the performance of the proposed scheduling scheme and to compare it with other well-known scheduling solutions. The results show the superior performance achieved by the proposed technique, in terms of the number of satisfied and unsatisfied users.
1. Introduction Nowadays, video streaming is the most popular service on the Internet and it is foreseen that three-fourths of the worldwide mobile data traffic in 2020 will be video [1]. At the same time, people are influenced by the Quality of Experience (QoE) they have when using a service: for instance, if this service does not provide them the QoE they are expecting, they might stop paying for it and search for a new service provider. Thus, it is of great interest for the operators to provide a service that satisfies a high number of users. However, a wireless network environment is characterized by a time-varying behavior of the received signal strength and/or interference level and, as a consequence, of the available throughput. This may severely impact the experienced quality in video streaming applications, even with the adoption of a buffer at the receiver side; in fact, an insufficient throughput may cause the need for rebuffering, a streaming state activated when the playback buffer becomes empty and that leads to a playout stall, which is usually very annoying for the users [2, 3]. Other undesired effects may also be potentiated by the variability
of the radio channel (e.g., long initial playout delays), all of which degrade the QoE. Furthermore, the continuous growth of consumed mobile multimedia content may lead to network congestion. Accordingly, the design of intelligent and efficient scheduling algorithms becomes crucial, in order to maintain a high QoE level to all users. This paper addresses QoE-oriented techniques to be adopted by wireless schedulers, in order to maximize the number of satisfied users. The main contribution is the proposal of a QoE-aware scheduling algorithm for adaptive HyperText Transfer Protocol (HTTP) video delivery in wireless networks, such as Long Term Evolution (LTE) and Worldwide Interoperability for Microwave Access (WiMAX) networks. The proposed strategy makes use of the clients’ buffer level, which is reported by the mobile clients that implement the Dynamic Adaptive Streaming over HTTP (DASH) specifications [4, 5], and also takes into account the predicted buffer filling of each client (i.e., how much the buffer level would increase if resources are allocated to the respective user), which is estimated from the requested video segments and radio channel conditions. Moreover, the
2 proposed scheduling scheme provides an adjustable tradeoff between efficiency and fairness, i.e., it allocates more resources to users experiencing higher throughputs but tries to ensure, at the same time and to an extent based on the service provider preferences, that the remaining users do not experience rebuffering events. The performance of the proposed scheduling algorithm is assessed through simulation and using, as assessment metrics, the percentage of satisfied and unsatisfied users for different cell loads of an LTE network. However, it is worth mentioning that the new scheduling strategy can be used by other radio access networks, provided that the resource allocation architecture is similar to the LTE one (e.g., the WiMAX network). Some of the most well-known scheduling solutions are also considered, thus enabling not only to assess their performance in terms of the number of users that can be served with a certain QoE, but also to reveal the benefits of the proposed technique. The rest of the paper is organized as follows. Section 2 reviews the related work. In Section 3, the details of the proposed QoE-aware scheduling algorithm are presented. Section 4 describes the features of the developed simulation framework. In Section 5, the assessment results are provided. Finally, Section 6 concludes the paper. To facilitate the readability, the Notations shown at the end of the paper summarize the notations used herein.
2. Related Work This section addresses the related work by providing (i) an overview of the most relevant concepts associated with the DASH standard; (ii) the definition of QoE and its contextualization in video streaming scenarios; (iii) the fundamentals of LTE resource allocation; and (iv) a review on the related literature concerning scheduling algorithms. 2.1. DASH Overview. In order to cope with variable Internet receiving conditions (e.g., those caused by radio channel quality variations), the Motion Picture Experts Group (MPEG) developed the DASH standard [4], which allows the transmission bitrate to be adapted by the client, according to the current network conditions or mobile device characteristics. As part of their collaboration with MPEG, the 3rd Generation Partnership Project (3GPP) has adopted DASH, with specific codecs and operating modes, for use over wireless networks, resulting in the 3GP-DASH standard [5]. At the DASH server side, the same media content has several representations, each one with a different bitrate (and a different subjective quality), and each representation is divided into segments, which can be independently decoded by the client. The characteristics of each segment—such as server location (URL), the associated bitrate, or video resolution—and the temporal and structural relationships between segments are defined in a manifest file denoted as Media Presentation Description (MPD), which is sent at the start of the transmission. The DASH client estimates the channel throughput, selects an appropriate encoded representation, and starts downloading the content by fetching the respective segments
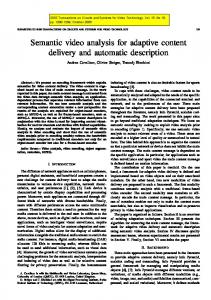
Wireless Communications and Mobile Computing Segments 250 kbps 500 kbps 1 Mbps
Figure 1: Example of DASH segment requests during a video streaming session.
using the HTTP protocol; during the streaming session, the client can seamlessly switch between the different media representations, in order to cope with throughput fluctuations or according to mobile device characteristics; an example of DASH segment requests during a video streaming session is illustrated in Figure 1. It is worth mentioning that the DASH standard only defines how the media content is represented and how the respective metadata is handled. Hence, the delivery of the metadata file and media encoding formats containing the segments are not specified, nor the client’s action for fetching, adapting, and playing the content [6]. The DASH specifications also include the possibility of the server to inquire some client’s metrics, which are useful for QoE monitoring (cf. Section 2.2). More specifically, an MPD may contain the list of DASH metrics to be measured and reported by the client, the time interval, and the granularity for the measurements, as well as the scheme according to which the metric reporting is desired. 2.2. Understanding QoE. QoE has been defined as “the degree of delight or annoyance of a person experiencing an application, service, or system. It results from the fulfillment of his or her expectations with respect to the utility and/or enjoyment of the application, service or system in the light of the person’s personality and current state” [7]. Therefore, two different persons will probably perceive a video streaming experience in different ways, which is mainly due to the following influence factors: (i) Human factors: user characteristics that affect QoE (e.g., gender, age, mood, and visual and auditory acuity); (ii) System factors: factors related to the transmission system (e.g., codec, packet loss rate, delay, and screen resolution); (iii) Context factors: external factors that affect QoE (e.g., time of the day, day of the week, and service type). Clearly, QoE can be very subjective; accordingly, the most reliable and accurate method for assessing it is to perform subjective tests, where the perceived QoE is usually expressed in a Mean Opinion Score (MOS) scale ranging from 1 (“Bad”) to 5 (“Excellent”) [8] (cf. Table 1). However, obtaining MOS scores with subjective tests is very expensive and timeconsuming; furthermore, it is impractical in certain types of services, such as live streaming. For this reason, objective measurement techniques have been developed, in order to obtain a valid QoE prediction regarding video streaming, while avoiding the need to perform subjective tests; related
Wireless Communications and Mobile Computing
Perceived quality Excellent Good Fair Poor Bad
surveys can be found in [9–12]. Most of the proposed objective assessment methods for adaptive video streaming (e.g., [13–15]) make use of part (or all) of the following quantitative metrics, which are obtained from information provided by the client (the metrics marked with an asterisk denote DASH standardized metrics [4, 5]): (i) Representation switch events∗: a list of representation switches that took place during the measurement interval; (ii) Average throughput∗: the average throughput that is observed by the client during the measurement interval; (iii) Initial playout delay∗: the period between the starting time of loading a video and playing it; (iv) Buffer level∗: a list of buffer occupancy levels carried out during the measurement interval; (v) Play list∗: a list of playback periods in the measurement interval, where each playback period is the time interval between a user action (new playout request, resume playout from pause, or user-requested quality change) and the end of playback or a failure that stops playback; (vi) Mean rebuffering duration: the average time that the playback was paused during a rebuffering event; (vii) Rebuffering frequency: the frequency of the rebuffering events; (viii) Mean video quality: the average video quality served to a user during playout; (ix) Video quality changes amplitude: the extent of each video quality change, specifying whether it is a change from a higher to a lower quality or vice versa; (x) Video quality changes frequency: the frequency of the video quality changes during playout. These quantitative metrics are usually incorporated into parametric models that establish a mapping between the objective quality metrics and a subjective score; the parameters of these models are tuned based on the results of subjective tests, e.g., using ordinary least squares or maximum likelihood estimation methods. 2.3. Background on LTE Resource Allocation. As previously mentioned, in order to assess the proposed QoE-aware scheduling technique, an LTE network was considered, so its resource allocation architecture is briefly described in this section.
Bandwidth [MHz] 1.4 3 5 10 15 20
Frequency
MOS 5 4 3 2 1
Table 2: Number of RBs in the frequency domain for each bandwidth.
Sub-channel (180 kHz)
Table 1: Perceived quality score within MOS subjective tests.
3
RBs 6 15 25 50 75 100 1 TTI - Transmission Time Interval (2 time slots of 0.5 ms = 1 ms)
Resource Block
Time LTE frame (10 TTI = 10 ms)
Figure 2: LTE radio resources grid.
Within the LTE downlink physical layer, radio resources are allocated into the time/frequency domain. As shown in Figure 2, the total time is split into 10 ms frames, each one composed of 10 consecutive 1 ms subframes denoted as Transmission Time Intervals (TTI). Furthermore, each TTI comprises 2 time slots, with a length of 0.5 ms, and each time slot corresponds to 7 Orthogonal Frequency-Division Multiplexing (OFDM) symbols (normal cyclic prefix) or 6 symbols (extended cyclic prefix) [16]. In the frequency domain, the total bandwidth is divided into subchannels of 180 kHz, each one comprising 12×15 kHz subcarriers (or, less often, 24×7.5 kHz subcarriers) [16]. A time/frequency radio resource spanning over one time slot and over one subchannel is denoted as Resource Block (RB). Therefore, each RB accounts for 12×7 OFDM symbols in the vast majority of cases. The bandwidths defined by the standard determine how many RBs are available in each situation regarding the frequency domain [16] (cf. Table 2). Although RBs are defined over one subchannel and over one time slot, the basic scheduling unit in LTE corresponds to the intersection of one subchannel with one subframe/TTI (i.e., two consecutive time slots); this means that the scheduling unit comprises two consecutive (in the time domain) RBs and that the scheduler makes resource allocation decisions every 1 ms [17]. For instance, the 20 MHz bandwidth has 200 RB available per subframe; however, there are only 100 addressable locations of 2 RBs each. Accordingly, for each User Equipment (UE), a minimum of two consecutive RBs (one RB pair, denoted from now on as RBP) can be allocated per TTI, and a maximum of 100 UEs can be served per TTI.
4
Wireless Communications and Mobile Computing Table 3: Efficiencies for each CQI.
CQI index 1 2 3 4 5 6 7 8 9 10 11 12 13 14 15
Modulation
Efficiency [bits/symbol]
QPSK QPSK QPSK QPSK QPSK QPSK 16QAM 16QAM 16QAM 64QAM 64QAM 64QAM 64QAM 64QAM 64QAM
0.1523 0.2344 0.3770 0.6016 0.8770 1.1758 1.4766 1.9141 2.4063 2.7305 3.3223 3.9023 4.5234 5.1152 5.5547
It is also important to mention that, in a LTE network, all UEs report periodically a parameter to the base station—the Channel Quality Indicator (CQI)—which keeps the latter informed about the channel conditions of each UE. The efficiency associated with each CQI value is presented in Table 3 for reporting CQI based on QPSK, 16QAM, and 64QAM modulations [16]. In the frequency domain, the granularity of a CQI report ranges from wideband to per RB reporting, whereas its periodicity varies between 1 ms and 160 ms [16]. Finally, in resource allocation architectures like or similar to the LTE one, the resource allocation is usually performed by comparing metrics on a scheduling unit basis (in the LTE case, the scheduling unit corresponds to a RBP): in each scheduling period (or TTI), there are 𝐾 scheduling units to be allocated; in the 𝑛𝑡ℎ scheduling period, the scheduling unit 𝑘 ∈ {1, . . . , 𝐾} is assigned to the 𝑗𝑡ℎ user if the respective metric 𝑚𝑛,𝑘[𝑗] is the biggest one among all users, i.e., 𝑗 = arg max {𝑚𝑛,𝑘 [𝑖]} . 𝑖
(1)
These metrics can be regarded as the priority of each user on a particular scheduling unit; according to the intended system performance, the computation of these metrics takes into account one or more factors, e.g., radio channel conditions, resource allocation history, or buffer state. 2.4. Related Work on Scheduling Algorithms. Wireless resources scheduling aims at establishing a trade-off between satisfying the customers’ expectations and handling the limited network capacity. Accordingly, scheduling algorithms not only allocate physical radio resources among users, but also assign the users’ serving order, in order to fulfill some service requirements, e.g., fairness. A large number of scheduling strategies have been proposed in the last years, but most of them do not take the
QoE into account, in contrast to the solution proposed in this paper. Nevertheless, some of these strategies—as the RoundRobin (RR) [18], the Blind Equal Throughput (BET) [18], and the Proportional Fair (PF) [18] strategies—deserve to be mentioned because they are widely used as benchmarks in the literature. The RR approach is one of the simplest scheduling schemes, which allocates an equal share of resources to each user in a Round-Robin manner. Hence, RR is fair in terms of channel occupancy time and can be a good option either if the radio channel conditions are not known, or if these conditions are similar and do not vary much in time for all users; otherwise, some users may suffer from starvation. The BET scheduling algorithm can be regarded as the fairest in terms of throughput, as it prioritizes the user that has experienced the lowest average throughput. Thus, BET is able to provide similar QoE to all users, namely, if these are using the same service and in the same conditions (e.g., if the same rate adaptation algorithm is adopted by all of them). On the other hand, a small number of users with very bad channel conditions can greatly reduce the overall QoE (i.e., the average QoE of all connected users) if BET is enforced, as the respective scheduler will allocate a lot of resources to these users, thus not exploiting the higher throughput experienced by the remaining users. A scheduler that implements the PF strategy tries to avoid the BET’s problem previously mentioned, namely by providing a compromise between fairness and spectral efficiency. In this case, the goal is to maximize the total network throughput by allocating more resources to users experiencing better channel conditions (hence, they can achieve higher throughputs), while ensuring, at the same time, that users with poor conditions will always be served after some time. More elaborated strategies, such as the Modified Largest Weighted Delay First (M-LWDF) scheme [19] and the Exponential/PF (EXP/PF) approach [20], aim at providing a balanced trade-off among fairness, spectral efficiency, and service requirements, such as delay. For more details on these and other scheduling techniques that do not take the QoE into account, please refer to [18]. With the advent of the QoE concept, many authors have proposed scheduling schemes that make use of relevant QoE metrics that are reported from the users’ device, in order to improve the subjective quality perception of the streaming service. The works presented in [21, 22] consider the buffered playout time of YouTube videos and propose the generation of signaling events by the clients (which are reported to the scheduler) when the buffered video playout time falls below or goes beyond predefined thresholds. The first situation indicates that the video flow is in a critical state; hence, it is prioritized by the scheduler, whereas the second threshold is used to tag the flow as normal, leading to a normal scheduling. This approach, which runs on top of traditional scheduling schemes, is not proactive in terms of QoE, i.e., it does not try to optimize the overall QoE but rather prioritizes video flows when QoE deterioration might be about to occur due to a nearly empty buffer. Differently, the scheduling scheme proposed herein aims to proactively improve the overall QoE namely, by always making decisions based on relevant QoE metrics (such as the buffer level at the client side and the respective bitrate of the requested
Wireless Communications and Mobile Computing video segment) of not only some, but all users. This global approach is also followed by other authors; for instance, in [23], the rebuffering events are adopted as QoE inputs by the proposed scheduler, namely, by taking into account not only current playback interruptions, but also past service quality degradation. Subsequently, the users experiencing the lowest cumulative QoE are scheduled with the highest priority, thus seeking an equitable QoE. Some optimization problems and respective solutions have also been devised with respect to QoE-oriented scheduling techniques, such as the ones presented in [24, 25]. The solutions therein make use of the reported buffer level and either try to prevent the violation of a certain rebuffering constraint [24] or aim at maximizing the minimum buffered video playout time among all clients [25]. Most of the previous scheduling strategies do not exploit the higher throughputs that can be achieved by some users, namely those that are experiencing better channel conditions—by better serving these users, the overall QoE could be improved as long as users with poor channel conditions would still keep an acceptable QoE. For this reason, the scheduling technique devised in this work also attempts to take advantage of the better channel conditions experienced by some users, besides taking into account some QoE relevant metrics sent by the clients, with the final goal of maximizing both the amount of satisfied users connected to a base station (i.e., users that have, at least, a certain QoE level) and the overall QoE. Some authors presented scheduling strategies with similar purposes [26, 27], but corresponding to enhancements made to a PF scheduler (whereas the solution proposed in this paper is not based on the PF approach); in other words, these strategies act like a PF scheduler until some user’s reported buffer level is below a certain threshold, thus forcing (albeit with a soft transition) the prioritization of this user. In addition, the Proportional Fair with Barrier for Frames (PFBF) algorithm introduced in [26] allocates resources taking into account not only the buffer level, but also the rebuffering time percentage (i.e., the percentage of the entire streaming time that is spent on rebuffering), with the intention of including fairness in terms of this last QoE metric. In [27], the users are prioritized not only according to the absolute amount of information on the player’s buffer, but also considering the variation rate of the buffer level, in order to constrain the rebuffering probability without compromising the video quality. The solutions proposed in [28–30] follow a different approach than the scheduling strategy introduced herein, namely by considering the use of a proxy that performs joint optimization of resource allocation and of the client streaming rate adaptation within DASH systems. In particular, the radio channel conditions, the multiple bitrate encodings available on the server, and the buffer status of the clients are taken into account by the proxy with two purposes: first, to prioritize a stream when the scheduler detects that the corresponding radio channel is not in good conditions; secondly, to address the possibility of modifying a client’s request to a representation with a lower bitrate, in order to avoid a higher QoE deterioration due to an imminent stall. Although this proxy-based approach is able to decrease significantly the occurrence of rebuffering events
5 and to improve the decoded video quality of all users, a client, after requesting a given DASH segment, may not be willing to accept other DASH segment(s) as an alternative—in fact, even though the DASH standard incorporates the Server and Network Assisted DASH (SAND) functionality, in which clients can inform the server that they are ready to accept other representations described in the MPD than the one they initially requested, a 3GP-DASH client shall not include alternative segments unless it is ready to receive them and be able to play them [5]. The scheduling techniques addressed so far consider the case where each base station represents an independent scheduler. Nevertheless, some authors have proposed solutions that adopt a centralized network controller, which is able to enhance QoE of users that can connect to more than one base station. More specifically, the authors of [31] designed a QoE-aware scheduling system along with call admission and handoff procedures, which provide a seamless multimedia streaming; this is accomplished by ensuring that previously connected users keep a satisfactory level of buffered video playout time among neighboring base stations (through scheduling and handoff operations), as well as these users’ buffer levels are used to determine the admission of new users to the network. In [32], a system is proposed to support a large number of video streaming sessions in a dense wireless network; in this case, the buffer level is taken into account in order to not only maintain a desired video quality, but also to fairly allocate the available remaining capacity, thus providing a high utilization of the network and eventually allowing users to receive a video with a higher quality. In spite of the fact that these centralized approaches enable us to greatly improve the overall QoE in the network, they accomplish this goal by exploiting some specificities of the multicell scenario; e.g., if several different base stations are able to serve a specific user simultaneously, a handoff can be triggered from time to time so as to select the base station that enhances this user’s QoE. Therefore, a single base station scenario (which is the one addressed by the solution proposed in this paper) can somewhat be regarded as more challenging, since it may lead to a situation where the base station has to deal with a large number of users that were admitted and that must be served only by this base station.
3. Proposed QoE-Aware Scheduling Algorithm The system model considered in this work is depicted in Figure 3. It consists in several DASH video streaming sessions, established between mobile terminals and a DASH based video server, over a wireless network (such as the LTE network), considering a single base station scenario; the segments requested by the DASH clients are delivered by the server to a scheduler, which then has to perform resource allocation based on a scheduling algorithm, in order to satisfy the users’ expectations. Besides knowing some information about the video segment that is being streamed to each user, namely, the respective bitrate, the scheduler has also knowledge about the radio channel conditions that each user is experiencing (e.g., through the CQIs reported to the base station in the LTE case) and about the current buffer level
6
Wireless Communications and Mobile Computing
DASH server
Wireless network (e.g., LTE)
DASH clients
Scheduler
Channel conditions info.
DASH video streams
Buffer levels
HTTP DASH segment requests
𝑠𝑡
(2 𝑚𝑀𝐵𝐹 𝑛,𝑘 [𝑖]
Figure 3: System model.
at the client side (recall that this is a QoE metric that clients implementing the DASH specification can report to the network). It is worth mentioning that, since wireless resources scheduling is one of the baseband processing functionalities of a base station, the scheduler’s location depends on the network architecture, i.e., the scheduler can be colocated, in one unit, with the radio functionalities, such as the case of traditional base stations, or it can be within a centralized Baseband Unit (BBU) pool, such as the case of Cloud Radio Access Networks (C-RAN) [33]. As mentioned in Section 1, a rebuffering event is usually very annoying for the users and its prevention should be the first priority for the scheduler; if a stall happens, then the rebuffering period must be short. Accordingly, a first solution for the proposed scheduler, denoted from now on as Maximum Buffer Filling (MBF), could be to simply allocate RBs to the users with the lowest buffer levels, i.e., this first approach is analogous to the BET one, but now, instead of the throughput, the buffer level is adopted as scheduling input. The respective resource allocation metric would then be given by 𝑠𝑡
(1 𝑚𝑀𝐵𝐹 𝑛,𝑘 [𝑖]
𝑎𝑝𝑝𝑟𝑜𝑎𝑐ℎ)
=
1 , 𝑈𝑛 [𝑖]
efficient to allocate resource to the users whose channel conditions and requested bitrates allow a higher amount of video playout time to be stored in their buffers, thus helping the prevention of playout stalls. In order to take advantage of the reported channel conditions and of the known users’ requested video bitrates, the QoE-aware scheduler should not only consider the current buffer level of the users (denominator of (2)), but it should also estimate how much the buffer level would increase if the scheduling unit is allocated to the respective user, yielding the metric
(2)
where 𝑈𝑛 [𝑖] stands for the amount of video playout time stored in the 𝑖𝑡ℎ user’s buffer at the beginning of the 𝑛𝑡ℎ scheduling period. However, metric (2) does not consider the current channel conditions experienced by the user, which is a waste of useful information. For instance, it would be inefficient to allocate resources to a user that is momentarily experiencing poor channel conditions, just because this user has the lowest buffer level among all connected users: several seconds of video may still be stored in the respective buffer, allowing the user to play the video smoothly during that time, even if the user is not served. Therefore, why not take advantage of the reported radio channel conditions and serve, for example, the user with the second lowest buffer but that can achieve a higher throughput? On the other hand, sending many bits to the user that is experiencing a higher throughput may not mean that the video playout time will increase greatly in the respective buffer; e.g., if this user is requesting a very good video quality segment, then the respective buffer level may increase very slowly. Accordingly, it would be more
𝑎𝑝𝑝𝑟𝑜𝑎𝑐ℎ)
=
Δ𝑈𝑛,𝑘 [𝑖] , 𝑈𝑛 [𝑖]
(3)
where Δ𝑈𝑛,𝑘 [𝑖] corresponds to the predicted buffer level variation of the 𝑖𝑡ℎ user if the (𝑛, 𝑘)𝑡ℎ scheduling unit is allocated to this user; the value of Δ𝑈𝑛,𝑘 [𝑖] can be estimated by Δ𝑈𝑛,𝑘 [𝑖] =
̂ 𝑅 𝑛,𝑘 [𝑖] × 𝑇𝑆𝑈 , 𝑉𝑛 [𝑖]
(4)
where 𝑉𝑛 [𝑖] denotes the bitrate of the video that is being downloaded by the 𝑖𝑡ℎ user during the 𝑛𝑡ℎ scheduling period, ̂ 𝑅 𝑛,𝑘 [𝑖] represents the estimated achievable throughput for the (𝑛, 𝑘)𝑡ℎ scheduling unit given the channel conditions of the 𝑖𝑡ℎ user, and 𝑇𝑆𝑈 stands for the scheduling period length. Considering the LTE network, for which a scheduling unit comprises two consecutive RBs (hence, 𝑇𝑆𝑈 = 1 ms, cf. Section 2.3), the achievable throughput per scheduling unit can be estimated as ̂ 𝑅 𝑛,𝑘 [𝑖] =
2 × Ω × 𝐸𝑛,𝑘 (𝐶𝑄𝐼 [𝑖]) × 𝐺 × (1 − 𝜁) , 𝑇𝑆𝑈
(5)
where Ω corresponds to the number of OFDM symbols that each RB encompasses, 𝐸𝑛,𝑘 (𝐶𝑄𝐼[𝑖]) denotes the 𝑘𝑡ℎ RBP efficiency with respect to the 𝑛𝑡ℎ scheduling period, which depends on the respective last CQI reported by the 𝑖𝑡ℎ user (according to the CQI frequency granularity and periodicity), 𝐶𝑄𝐼[𝑖], 𝐺 stands for the gain obtained by using the Multiple Input Multiple Output (MIMO) technique, and 𝜁 represents the percentage of overhead bits. Usually, the time interval between each report of the client’s buffer level is higher than the scheduling period length; in this case, the buffer level can be estimated by the scheduler in the meantime (i.e., while the updated real buffer level is not reported) by 𝐾 } { ∗ 𝑈𝑛+1 [𝑖] = max {𝑈𝑛 [𝑖] + ∑ (Δ𝑈𝑛,𝑗 [𝑖]) − 𝑇𝑆𝑈; 0} , 𝑗=1 } {
(6)
∗ [𝑖] represents an estimate of how much the buffer where Δ𝑈𝑛,𝑗
filling of the 𝑖𝑡ℎ user will increase with respect to the 𝑗𝑡ℎ allocated scheduling unit in the 𝑛𝑡ℎ scheduling period, i.e.,
Wireless Communications and Mobile Computing
7 Scheduling unit to be allocated
yes
Any user with buffer level lower than ?
no
Serve the user that maximizes the normalized buffer filling
Serve the user with the lowest buffer level
Figure 4: MBF scheduling algorithm flowchart.
{Δ𝑈𝑛,𝑗 [𝑖] , ∗ Δ𝑈𝑛,𝑗 [𝑖] = { 0, {
if scheduling unit 𝑗 of scheduling period 𝑛 was allocated to user 𝑖 otherwise.
By considering the term Δ𝑈𝑛,𝑘 [𝑖] in (3), namely, the predicted amount of video playout time that will be possible to transmit to the each user, the network efficiency is improved due to a higher probability of serving the users experiencing higher throughputs. On the other hand, the use of the term 𝑉𝑛 [𝑖] in (4) also increases the fairness among the users in terms of video quality served: the lower the quality that is being served to the 𝑖𝑡ℎ user, the higher the probability of being served. Within the approach of (3), the term 𝑈𝑛 [𝑖] acts like a normalization factor regarding the amount of video playout time that is possible to transmit, hence not only providing fairness in terms of buffer occupancy, but also trying to avoid rebuffering events. Nevertheless, metric (3) may lead to some users suffering from starvation (which originates playout stalls), mainly when they are experiencing a very low throughput for a considerable amount of time. For this reason, the final version of the proposed QoE-aware scheduling algorithm incorporates an emergency condition in the resource allocation metric: 1 { , { { 𝑈 { 𝑛 [𝑖] { { 𝑚𝑀𝐵𝐹 𝑛,𝑘 [𝑖] = { { { { Δ𝑈 { { 𝑛,𝑘 [𝑖] , { 𝑈𝑛 [𝑖]
if ∃𝑗 : 𝑈𝑛 [𝑗] < 𝛼 (8) otherwise.
The parameter 𝛼 defines the emergency state threshold, i.e., if one or more users have a buffer level lower than 𝛼, then the scheduler serves the user which has the lowest buffer level, thus trying to avoid a rebuffering event. On the other hand, if all buffer levels are above the 𝛼 threshold, then the served user is the one which has the chance of having the respective buffer filled with the highest amount of video playout time, normalized by the current buffer level. The previously described procedure is summarized in the
(7)
flowchart depicted in Figure 4. In addition, and provided that the buffer level thresholds typically implemented by DASH players are known by the service provider (namely, those which are related to the initial buffering and rebuffering events), the parameter 𝛼 may also be used to ensure that, after some time, a client will always (re)start playing the video: this fair behavior takes place when 𝛼 is greater than these buffer level thresholds, since in that case all users that are only loading the video will be prioritized by the MBF approach; on the contrary, if 𝛼 is lower than these buffer level thresholds, then some users (especially those that are experiencing poor channel conditions) might never fill their buffers up to the predefined point where the video is allowed to (re)start playing, i.e., some users might be sacrificed. Nevertheless, note that a lower 𝛼 value also enables that the nonsacrificed users not only have lower initial playout delays, but also they have higher possibilities of experiencing a stallfree experience; thus these users achieve a better QoE; on the other hand, although higher 𝛼 values ensure the previously mentioned (re)start playing of the video after some time for all users, it also may lead to a situation where a great amount of time is required for all users to fill the respective buffers, which means that this may deteriorate the QoE of all users, namely if these start experiencing frequent switching between stalls and playing the video just for a few seconds. In a nutshell, the proposed MBF scheduling strategy is a noncomplex technique, easy to implement and suitable for the case where each base station represents an independent scheduler. It only requires information about the radio channel conditions, buffer status, and requested video segments. The MBF approach not only exploits the higher throughputs experienced by some users, thus aiming to improve the overall QoE of the network, but also has the goal of preventing playout stalls, in order to avoid sacrificing the users that are experiencing poor channel conditions. Accordingly, the
8
Wireless Communications and Mobile Computing i=1
START Read simulation settings (total simulation time, Tmax , number of users , NU , number of RBPs per TTI, K); initialize simulation time: t=0;n=0
t > Tmax ? yes
no
i > NU ?
Simulation of scheduler yes
n=n+1; k=1
no Simulation of device of user i
Update the buffer level
no Initial buffering or rebuffering event ?
no
Smooth playout: request new segment ?
yes QoE assessment for each user
yes k>K?
yes Perform rate adaptation & request new segment & report buffer level
Request 5 s of video with the lowest quality level & report buffer level
no
Compute the scheduling algorithm metric for all connected users Allocate 1 RBP to a user according to (1) k=k+1
Output results to a file END
Report CQI ?
yes
Report CQI
no Move to next TTI: t = t + TSU
i=i+1
Figure 5: Simulator flowchart.
MBF algorithm establishes a trade-off between efficiency (regarding the increase of the overall QoE) and fairness (regarding the prevention of rebuffering events), which is not fixed and can be adjusted by simply varying the value of the emergency state threshold (parameter 𝛼), thus allowing to meet different service provider preferences.
4. Simulation Setup In order to assess the scheduling algorithm proposed in this work, a simulator was developed from scratch, using the Java programming language [34]; this program simulates a scenario comprising an LTE base station and several mobile users, which are accessing to a video server according to the DASH specifications (as illustrated in Figure 3). The program was designed in a modular form, in order to allow the incorporation of different scheduling techniques, rate adaptation algorithms (at the client side), and QoE assessment models. The general workflow of the simulator, which is depicted in Figure 5, is as follows: first, the simulation settings are read (such as the total simulation time, 𝑇𝑚𝑎𝑥 , the number of connected users, 𝑁𝑈, and the number of RBPs available for allocation in each TTI, 𝐾); afterwards, in each iteration corresponding to a TTI, the behavior of each user’s device is simulated; the client buffer level is updated, new video segments might be requested (according to the rate adaptation algorithm), as well as the buffer level and the CQI might be reported to the base station; subsequently (after simulating all users’ devices), the behavior of the scheduler is simulated, i.e., the scheduling algorithm computes the respective metrics for all users and allocates the RBPs accordingly; next, the
simulation moves to the next TTI and the previous process is repeated till the simulation reaches the predefined time interval 𝑇𝑚𝑎𝑥 , after which the QoE of each user regarding the entire streaming session is assessed and the respective results are saved to a file. 4.1. User CQI and Throughput. The radio channel conditions are simulated through periodic wideband CQI reports sent by the users to the network side every 5 ms [35]. These CQIs were obtained through an independent simulation, using the SimuLTE [36] and the OMNeT++ [37] tools: an LTE urban macrocell scenario was considered, comprising a single base station and 200 mobile users moving around with a random trajectory; all the CQIs reported by the users to the base station, during a time interval of 3 minutes (the optimal length of a YouTube video [38]), were saved. The resulting CQI database was then used by the newly developed simulator; each simulated user adopts randomly (but without repetitions) one of the 200 radio channels conditions previously saved. The throughput yielded by each allocated RBP is computed using (5); the most common case of 12 × 7 OFDM symbols per RB was used in the developed simulator, as well as the RB efficiency values presented in Table 3; moreover, a 1 × 1 MIMO configuration was considered, which yields a MIMO gain equal to one, and the percentage of overhead bits was set equal to 25% in the simulations [39]. It is also assumed an LTE configuration comprising a bandwidth of 20 MHz, resulting in 100 RBPs available for allocation in each TTI (cf. Table 2). A summary of the aforementioned LTE parameters adopted in the simulations is given in Table 4.
Wireless Communications and Mobile Computing
9
Table 4: LTE simulation parameters. Parameter System bandwidth RBPs per TTI OFDM symbols per RB MIMO configuration Overhead bits percentage CQI periodicity Channel model
Value 20 MHz 100 12 × 7 1×1 25% 5 ms Urban macrocell
4.2. Rate Adaptation Algorithm. In order to perform rate adaptation at the client side, the QoE enhanced Adaptation Algorithm over DASH (QAAD) [40] was incorporated in the simulator; this algorithm is responsible for the video bitrate selection based on the available channel throughput estimated by the client. 4.2.1. Channel throughput Estimation at the Client Side. The available channel throughput at time 𝑡, denoted by 𝑅𝑒𝑠𝑡 (𝑡), is estimated every 𝜃 seconds. Since the channel quality varies a long time, the estimated channel throughput is smoothed with a moving average: 𝑅𝑒𝑠𝑡 (𝑡) = 𝜔 × 𝑅𝑒𝑠𝑡 (𝑡 − 𝜃) + (1 − 𝜔) × 𝑅𝑠𝑎𝑚𝑝𝑙𝑒,
(9)
where 𝜔 stands for the weight factor for the sampled channel throughput 𝑅𝑠𝑎𝑚𝑝𝑙𝑒 (0 < 𝜔 < 1); this 𝑅𝑠𝑎𝑚𝑝𝑙𝑒 corresponds to the available channel throughput sampled in every 𝜃 seconds, which is computed as 𝑅𝑠𝑎𝑚𝑝𝑙𝑒 =
𝐵 , 𝜃
(10)
where 𝐵 denotes the amount of bits downloaded during 𝜃 seconds. For simulation purposes, the parameters 𝜔 and 𝜃 were set to 0.875 and 0.3 s, respectively, as suggested in [40]. 4.2.2. Bitrate Selection. The quality of the next requested video segment, 𝑙𝑛𝑒𝑥𝑡 , is selected by the client based on the estimated channel throughput, 𝑅𝑒𝑠𝑡 , and current buffer occupancy, 𝑈; the respective algorithm pseudocode is given in Algorithm 1. Initially, the algorithm tests if the current highest video segment quality that does not exceed the estimated channel throughput, 𝑙𝑏𝑒𝑠𝑡 , is equal to the previously selected segment quality, 𝑙𝑝𝑟𝑒V ; if this is true, then the quality of the requested segment is kept unchanged. On the other hand, if 𝑙𝑏𝑒𝑠𝑡 > 𝑙𝑝𝑟𝑒V , then the quality of the next video segment is increased (by one quality level) iff the current buffer occupancy is larger than a certain marginal buffer length, 𝜇; otherwise, the quality of the requested segment does not change. Finally, if 𝑙𝑏𝑒𝑠𝑡 < 𝑙𝑝𝑟𝑒V , then the quality of the next video segment may or may not decrease. In order to minimize the impact on the QoE, the algorithm tries to keep the next video quality comparable to the previous one. Consequently, the algorithm first determines the elapsed time, 𝑡𝑙,𝜎 , to consume all the segments in the playback buffer and computes the expected number of segments, 𝑛𝑙 , to be downloaded during this
(1) if 𝑙𝑏𝑒𝑠𝑡 = 𝑙𝑝𝑟𝑒V then (2) 𝑙𝑛𝑒𝑥𝑡 ← 𝑙𝑝𝑟𝑒V (3) else (4) if 𝑙𝑏𝑒𝑠𝑡 > 𝑙𝑝𝑟𝑒V then (5) if 𝑈 > 𝜇 then (6) 𝑙𝑛𝑒𝑥𝑡 ← 𝑙𝑝𝑟𝑒V + 1 (7) else (8) 𝑙𝑛𝑒𝑥𝑡 ← 𝑙𝑝𝑟𝑒V (9) end if (10) else (11) if 𝑙𝑏𝑒𝑠𝑡 < 𝑙𝑝𝑟𝑒V then (12) 𝑗 ← 0 (13) do (14) (15) (16) (17) (18) (19) (20) (21)
𝑈−𝜎 𝑅𝑒𝑠𝑡 /𝑏(𝑙𝑝𝑟𝑒V − 𝑗) 𝑡𝑙,𝜎 × 𝑅𝑒𝑠𝑡 𝑛𝑙𝑝𝑟𝑒V −𝑗 ← 𝜏 × 𝑏(𝑙𝑝𝑟𝑒V − 𝑗) 𝑗 ← 𝑗 + 1 while 𝑛𝑙𝑝𝑟𝑒V −𝑗 < 1 & 𝑗 < 𝑙𝑝𝑟𝑒V 𝑙𝑛𝑒𝑥𝑡 ← 𝑙𝑝𝑟𝑒V − (𝑗 − 1) end if end if end if 𝑡𝑙𝑝𝑟𝑒V −𝑗,𝜎 ←
Algorithm 1: QAAD: bitrate selection.
time; the parameters 𝜎, 𝜏, and 𝑏(𝑙) represent the predefined minimal buffer length, the segment duration, and the bitrate of the quality level 𝑙, respectively; the deduction of 𝑡𝑙,𝜎 and 𝑛𝑙 can be found in [40]. Afterwards, the algorithm searches for the maximum quality level (equal to or lower than 𝑙𝑝𝑟𝑒V ) that meets the condition 𝑛𝑙𝑝𝑟𝑒V−𝑗 ≥ 1; if this feasible quality level is not achievable, then the lowest quality level is selected. It is worth mentioning that the pseudocode presented in [40] would always lead to a decrease of at least one quality level if 𝑙𝑏𝑒𝑠𝑡 < 𝑙𝑝𝑟𝑒V . However, this was not in agreement with the behavior of the fluctuations tests presented in [40] (and with additional tests performed during our QAAD implementation). Therefore, the lines (17) and (18) of Algorithm 1 were modified (the version presented herein already reflects this adjustment), so as to obtain the intended QAAD behavior. Moreover, for simulation purposes, the parameters 𝜇 and 𝜎 were set to 10 s and 3 s, respectively, as suggested in [40]. 4.3. Additional Video Application Considerations. It was assumed that the video to be downloaded by the users has 15 different representations/quality levels in the server, with the characteristics presented in Table 5 (these assumptions were based on a publicly available DASH dataset [41]). The initial playout delay and rebuffering periods were set equal to the time that a client needs to download 5 s of the lowest video quality. In the remaining situations, the video segment requests are made according to the QAAD algorithm (cf. Section 4.2). In addition, the buffer level is reported by the clients to the network in each segment request.
10
Wireless Communications and Mobile Computing Table 5: DASH video characteristics.
Parameter Number of representations Bitrates of the representations Frame rate Segment size
Value 15 {0.2, 0.25, 0.3, 0.4, 0.5, 0.7, 0.9, 1.2, 1.5, 2.0, 2.5, 3.0, 4.0, 5.0, 6.0} Mbps 30 fps 1s
4.4. Other Implemented Scheduling Algorithms. In order to assess the relative performance of the proposed MBF scheduling algorithm, some of the scheduling techniques reviewed in Section 2.4 were also implemented in the developed simulator; the respective resource allocation metrics, which were adopted for simulations purposes, will now be detailed.
𝑚𝑅𝑅 𝑛,𝑘 [𝑖] = 𝐾 × (𝑛 − 𝑛⬦ [𝑖]) + (𝑘 − 𝑘⬦ [𝑖]) ,
(11)
where 𝑛⬦ [𝑖] and 𝑘⬦ [𝑖] correspond to the indices of the last scheduling unit allocated to the 𝑖𝑡ℎ user, i.e., this user was last served with scheduling unit 𝑘⬦ [𝑖] of scheduling period 𝑛⬦ [𝑖]. (ii) Blind Equal Throughput (BET): 𝑚𝐵𝐸𝑇 𝑛,𝑘 [𝑖] =
1 𝑅𝑛 [𝑖]
,
(12)
where 𝑅𝑛 [𝑖] represents the past average throughput (prior to the 𝑛𝑡ℎ scheduling period) of the 𝑖𝑡ℎ user. (iii) Proportional Fair (PF): ̂ 𝑅 𝑛,𝑘 [𝑖] 𝑅𝑛 [𝑖]
.
(13)
(iv) Proportional Fair with Barrier for Frames (PFBF): 𝑚𝑃𝐹𝐵𝐹 𝑛,𝑘 [𝑖] =(
4.5. QoE Model. In order to know how well the users are satisfied with the respective video streaming service, a QoE model based on the one adopted in [15] was incorporated in the developed simulator. This model, which yields outputs in the same range of MOS, takes into account the video quality and the rebuffering (or stall) events: 𝑄𝑜𝐸 [𝑖] = max {5.67
𝑞̂ [𝑖] 𝑞 [𝑖] − 6.65 + 0.17 − 4.95 𝑞total 𝑞total
(16)
× 𝜙 [𝑖] ; 0} ,
(i) Round-Robin (RR):
𝑚𝑃𝐹 𝑛,𝑘 [𝑖] =
the variable 𝑝𝑟𝑒𝑏𝑢𝑓 [𝑖] corresponds to the percentage of the total streaming time spent by the 𝑖𝑡ℎ user in rebuffering, whereas 𝜆 and 𝜉 represent other tunable parameters of this scheduling strategy. For simulation purposes, and as suggested in [26], 𝑓min was set equal to 10 frames, while 𝜆 = 𝜉 = 1.
̂ ̂ 𝜆×𝑅 𝑅 𝑛,𝑘 [𝑖] 𝜉(𝑓min −𝑓𝑛 [𝑖]) 𝑛,𝑘 [𝑖] 𝑒 + ) 𝑊 [𝑖] , 𝐹𝑛 [𝑖] 𝑅𝑛 [𝑖]
𝑁𝑈 × 𝑝𝑟𝑒𝑏𝑢𝑓[𝑖] { { {1 + 𝑁 , 𝑈 𝑊 [𝑖] = { ∑ 𝑝 𝑟𝑒𝑏𝑢𝑓[𝑖] 𝑗=1 { { {1,
(14)
𝑁𝑈
if ∑ 𝑝𝑟𝑒𝑏𝑢𝑓[𝑖] > 0 𝑗=1
(15)
otherwise,
where 𝐹𝑛 [𝑖] denotes the size of the video frame that is being downloaded by the 𝑖𝑡ℎ user with respect to the 𝑛𝑡ℎ scheduling period, 𝑓𝑛 [𝑖] represents the number of video frames in the buffer of this user at the beginning of the 𝑛𝑡ℎ scheduling period, and 𝑓min , which is tunable, stands for the minimum number of frames that each client should have in the buffer;
where 𝑞[𝑖] and 𝑞̂[𝑖] stand for the average and standard deviation, respectively, of the video quality level served to the 𝑖𝑡ℎ user, 𝑞total corresponds to the total number of different video quality levels available in the server, and 𝜙[𝑖] represents a function that measures the impact of video freezes on the QoE of the 𝑖𝑡ℎ user, which is given by 𝜙 [𝑖] =
ln (𝛽 [𝑖]) 7 1 × max { + 1; 0} + 8 6 8 min {𝜓 [𝑖] ; 15} , × 15
(17)
where 𝛽[𝑖] denotes the frequency of the rebuffering events experienced by the 𝑖𝑡ℎ user and 𝜓[𝑖] represents the mean duration of these rebuffering events. Nevertheless, this model does not consider the initial playout delay, which may also impair the QoE. In the developed simulator, the initial playout delay is added to the duration of rebuffering events, thereby affecting the mean duration of these events. As previously mentioned, this model yields outputs in the same range of MOS, which means that these outputs can be directly mapped onto the qualitative scale presented in Table 1, i.e., a user is assumed to have an excellent streaming video experience if the respective QoE is between 4 and 5, a bad experience if the QoE is between 0 and 1, etc.
5. Results The results presented in this section were obtained through Monte Carlo simulations, with a confidence interval of 95% [42]. Each simulation corresponds to 3 minutes of resources scheduling. During this period, all the simulated users are connected to the base station and continuously receive and play the video delivered by the server. The number of users is kept constant during each simulation. A user is considered to be satisfied if the respective QoE value is equal to, or greater than, a predefined threshold 𝑌, whereas the user is classified as unsatisfied if the respective
100 90 80 70 60 50 40 30 20 10 0 20
11
NS(QoE < 2) [%]
S(QoE ≥ 3) [%]
Wireless Communications and Mobile Computing
30
40
50 60 70 Connected users
80
90
100
=11 s =12.5 s =15 s =∞
=0 =2.5 s =5 s =7.5 s =10 s
5 4.5 4 3.5 3 2.5 2 1.5 1 0.5 0 20
30 =0 =2.5 s =5 s =7.5 s =10 s
40
50 60 70 Connected users
80
90
100
=11 s =12.5 s =15 s =∞
Figure 6: Percentage of users with 𝑄𝑜𝐸 ≥ 3 as a function of the number of connected users—comparison of different 𝛼 values within the MBF algorithm.
Figure 7: Percentage of users with 𝑄𝑜𝐸 < 2 as a function of the number of connected users—comparison of different 𝛼 values within the MBF algorithm.
QoE is below a predefined threshold 𝑍 (with 𝑍 ≤ 𝑌). For a given number of simulated users, the percentage of satisfied and unsatisfied users is denoted as 𝑆 and 𝑁𝑆, respectively; accordingly
Therefore, the procedure of adjusting the 𝛼 value can be regarded as setting a trade-off between having a higher number of connect users that are satisfied (lower 𝛼 values) or having a lower number of users that are unsatisfied with the streaming session (higher 𝛼 values). Accordingly, this enables us to meet different service provider preferences, such as the two modes suggested below:
𝑆 (𝑄𝑜𝐸 ≥ 𝑌) =
Number of users with QoE ≥ 𝑌 Number of connected users
(18)
× 100, 𝑁𝑆 (𝑄𝑜𝐸 < 𝑍) =
Number of users with QoE < 𝑍 Number of connected users
(19)
× 100. 5.1. MBF’s 𝛼 Parameter. As previously mentioned, the parameter 𝛼 of the proposed MBF algorithm (cf. (8)) represents the emergency state threshold, allowing us to tune the behavior of this scheduling strategy between rebuffering events fairness and QoE efficiency. In order to evaluate the impact of 𝛼 on the performance of the MBF approach, Figures 6 and 7 depict, respectively, 𝑆(𝑄𝑜𝐸 ≥ 3) and 𝑁𝑆(𝑄𝑜𝐸 < 2) as a function of the number of connected users and for different values of 𝛼 (ranging from zero to infinity). According to Figure 6, it can be observed that, for 𝑆 < 95%, the lower the value of 𝛼, the higher the number of satisfied users that can be connected to the base station. On the other hand, and taking into account Figure 7, higher 𝛼 values lead to a lower number of unsatisfied users. This behavior can be explained as follows: when the MBF algorithm enters in its emergency state, it will serve the users just based on their buffers, without considering their throughputs and requested segment video qualities; hence, by fulfilling the requirement to serve the user with the lowest buffer until its level is larger than 𝛼, the remaining users will experience lower throughputs and will request lower video qualities according to the rate adaptation algorithm.
(i) MBF–Mode 1: this approach aims, as first priority, to maximize the number of satisfied users (𝑄𝑜𝐸 ≥ 𝑌) and, secondly, at minimizing the number of unsatisfied users (𝑄𝑜𝐸 < 𝑍). Thus, 𝛼 = 5 s can be regarded as an appropriate value for this mode, because it leads to a slightly less number of satisfied users than 𝛼 = 0 and 𝛼 = 2.5 s (cf. Figure 6), but it is better at maintaining a low number of unsatisfied users (cf. Figure 7). (ii) MBF–Mode 2: this mode seeks, as first priority, to minimize the number of unsatisfied users and, secondly, to maximize the number of satisfied users. For this mode, an 𝛼 of 11 s is proposed, as it leads to a low number of unsatisfied users (cf. Figure 7) but still maintains a high number of satisfied users (cf. Figure 6). 5.2. Satisfied Users. The performance of different scheduling strategies, namely, RR, BET, PF, and PFBF, is now compared to the performance of both MBF modes previously suggested, taking into account the percentage of satisfied users. 5.2.1. Satisfied Users: 𝑄𝑜𝐸 ≥ 3. Figure 8 shows the percentage of users with 𝑄𝑜𝐸 ≥ 3 as a function of the number of connected users and for the different scheduling solutions. As can be observed, the best performance for a low cell load is obtained by adopting the BET approach. However, as the number of connected users increases, the BET strategy leads to the worst performance; more specifically, when the amount
12
Wireless Communications and Mobile Computing
S(QoE ≥ 4) [%]
S(QoE ≥ 3) [%]
Critical cell load 100 90 80 70 60 50 40 30 20 10 0 20
30
40
50 60 70 Connected users
RR BET PF
80
90
100
PFBF MBF - Mode 1 MBF - Mode 2
Max. users for S(QoE ≥ 3) = 90%
Figure 8: Percentage of users with 𝑄𝑜𝐸 ≥ 3 as a function of the number of connected users—comparison of different scheduling algorithms.
80 75 70 65 60 55 50 45 40 35 30 25 20
100 90 80 70 60 50 40 30 20 10 0 20
Critical cell load
30
RR BET PF
40
50 60 70 Connected users
80
90
100
PFBF MBF - Mode 1 MBF - Mode 2
Figure 10: Percentage of users with 𝑄𝑜E ≥ 4 as a function of the number of connected users—comparison of different scheduling algorithms.
in some situations by the PF and RR strategies (besides the MBF–Mode 1 scheme), namely, when the number of connected users is very high (cf. Figure 8). This is an expected behavior, as the proposed MBF scheduling scheme operating in Mode 2 is not optimized for achieving the highest possible number of satisfied users. Nevertheless, it still attains the second best performance (after MBF–Mode 1) when considering the 𝑆 ≥ 90% benchmark (cf. Figure 9).
RR BET PF
PFBF MBF - Mode 1 MBF - Mode 2
Figure 9: Maximum number of admissible users such that 90% of them have 𝑄𝑜𝐸 ≥ 3.
of available resources starts being scarce to serve all users as desired, the number of satisfied users starts drooping earlier when BET is enforced; henceforth, the scenario where the performance of the BET algorithm is lower than that of the remaining scheduling schemes will be denoted as the critical cell load situation. On the other hand, the proposed MBF–Mode 1 strategy yields the best performance in this critical cell load situation. In particular, assuming that a service provider aims at having at least 90% of satisfied users (i.e., 𝑆 ≥ 90%), the number of users that can be connected in this situation is maximized by using the MBF–Mode 1 scheme (cf. Figure 9), which depicts the maximum number of users that can be connected while assuring that 90% of them have 𝑄𝑜𝐸 ≥ 3. With respect to the MBF–Mode 2 approach operating in the critical cell load scenario, its performance is surpassed
5.2.2. Satisfied Users: 𝑄𝑜𝐸 ≥ 4. Figure 10 presents the percentage of users with 𝑄𝑜𝐸 ≥ 4—which can be considered highly satisfied users—as a function of the number of connected users and for the different scheduling solutions. As can be seen, the results are similar to the ones obtained for 𝑄𝑜𝐸 ≥ 3: the BET algorithm has the best performance when the number of connected users is low but yields the worst results when the number of connected users exceeds 40; the proposed MBF strategy, on the other hand, is able to provide one of the best performances in the critical cell load scenario. In particular, if a network operator wants to provide a very high QoE to the respective users, then the proposed MBF scheme operating in Mode 1 is a good choice, as it maximizes the number of users that can be connected while assuring that at least 90% of them have 𝑄𝑜𝐸 ≥ 4 (cf. Figure 11). Nevertheless, there is a slight qualitative difference of the results shown in Figure 10 with respect to the previous analysis for 𝑄𝑜𝐸 ≥ 3 (cf. Figure 8), namely, when the number of connected users is very high regarding the critical cell load situation: the performance of both MBF modes is now surpassed by the PF and RR scheduling techniques. This behavior is explained by the fact that an MBF-based scheduler tries to exploit the higher throughputs experienced by some users, in order to provide them higher QoE, but without sacrificing the remaining users. For the PF and RR strategies, even though in some situations more users can be served with 𝑄𝑜𝐸 ≥ 4 than the ones served by the MBF scheme, this comes at the cost of increasing the number of unsatisfied
Wireless Communications and Mobile Computing
13
Max. users for S(QoE ≥ 4) = 90%
50 45 40 35 30 25 20 RR BET PF
PFBF MBF - Mode 1 MBF - Mode 2
Figure 11: Maximum number of admissible users such that 90% of them have 𝑄𝑜𝐸 ≥ 4.
7
NS(QoE < 2) [%]
6 5 4 3 2 1 0 20
30
RR BET PF
40
50 60 70 Connected users
80
90
100
PFBF MBF - Mode 1 MBF - Mode 2
Figure 12: Percentage of users with 𝑄𝑜𝐸 < 2 as a function of the number of connected users—comparison of different scheduling algorithms.
users (i.e., with very low QoE values), as will be seen next; hence, the MBF algorithm adopts a fairer approach towards serving more users with an acceptable QoE. 5.3. Unsatisfied Users. A service provider must try also to minimize the number of users experiencing very low QoE values, as they may decide to drop out, which would eventually decrease the profits obtained by the service provider. In this context, Figure 12 depicts the percentage of users with 𝑄𝑜𝐸 < 2 as a function of the number of connected users and for the different scheduling solutions. As expected, the MBF–Mode 2 yields better results than the MBF–Mode 1, because the former was specifically adjusted to minimize the number of users experiencing a very low QoE. Furthermore, the performance of both MBF modes is only surpassed by the performance of the BET technique. Nevertheless, it is important to recall that the MBF strategy yielded better results than
the BET scheme when considering the number of satisfied users in the critical cell load situation (cf. Section 5.2). The results presented in Figure 12, in conjunction with the ones of Figures 8 and 10, also allow us to show the balance achieved by the PFBF strategy: although it leads to a number of satisfied users that is lower than in the RR and PF approaches, a lower number of unsatisfied users is also present. This enables us to point out the major advantage of the proposed MBF algorithm regarding this trade-off between fairness and QoE efficiency: the MBF strategy always yields a better performance than the PFBF approach, not only by lowering the number of unsatisfied users, but also by increasing the number of satisfied users; regarding this last assessment metric, the performance of the proposed MBF technique even exceeds, in most of the simulated cases, the one attained by the RR and PF schemes (cf. Section 5.2).
6. Conclusions This paper focused on the role played by scheduling algorithms in the resulting users’ QoE for video streaming services. In particular, a new scheduling technique was proposed, the MBF scheme, which allocates the resources based on the clients’ buffer levels and predicted filling. This scheduling strategy not only has the goal of preventing playout stalls but also exploits the higher throughputs experienced by some users, thus aiming to improve the overall QoE efficiency without sacrificing some users. Furthermore, the proposed technique incorporates a tuning parameter, which enables a service provider to easily adjust the trade-off between minimizing the number of users experiencing a very low QoE (fairness) and maximizing the overall QoE of the network (efficiency). The proposed algorithm was assessed by simulating a scenario comprising an LTE base station and several mobile users, which are accessing to a video server according to the 3GP-DASH specifications. Two operating modes were considered for the proposed MBF strategy: while the MBF–Mode 1 seeks to maximize the number of users with good or excellent QoE, the MBF–Mode 2 puts more emphasis on minimizing the number of users with poor or bad QoE. The performances of both MBF modes were compared to the performances yielded by other scheduling techniques, namely, RR, BET, PF, and PFBF, with respect to the number of satisfied and unsatisfied users, i.e., users with high and low QoE levels, respectively. The results showed that both MBF modes attained a superior performance than the other scheduling algorithms in terms of the number of users with a good or excellent QoE. In particular, the MBF-based scheduler is capable of providing always a higher number of admissible users such that 90% of them are satisfied (i.e., with high QoE levels). Additionally, and regardless of the considered operating modes, the proposed MBF strategy also leads to a percentage of users with poor or bad QoE that is lower than in the RR, PF, and PFBF algorithms. Accordingly, it was demonstrated that the proposed MBF scheduling algorithm is able to accomplish its mission of serving more users with high QoE, without compromising the QoE of the remaining users.
14
Notations 𝐾:
Number of scheduling units per scheduling period 𝑇𝑆𝑈: Scheduling period length Resource allocation metric of the 𝑖𝑡ℎ user 𝑚𝑛,𝑘[𝑖]: with respect to the 𝑘𝑡ℎ scheduling unit of the 𝑛𝑡ℎ scheduling period 𝑈𝑛 [𝑖]: Amount of video playout time stored in the 𝑖𝑡ℎ user’s buffer at the beginning of the 𝑛𝑡ℎ scheduling period Predicted buffer level variation of the 𝑖𝑡ℎ Δ𝑈𝑛,𝑘 [𝑖]: user if the (𝑛, 𝑘)𝑡ℎ scheduling unit is allocated to this user ̂ [𝑖]: Estimated achievable throughput for the 𝑅 𝑛,𝑘 (𝑛, 𝑘)𝑡ℎ scheduling unit given the channel conditions of the 𝑖𝑡ℎ user 𝑉𝑛 [𝑖]: Bitrate of the video that is being downloaded by the 𝑖𝑡ℎ user during the 𝑛𝑡ℎ scheduling period 𝐸𝑛,𝑘 (𝐶𝑄𝐼[𝑖]): Efficiency of the 𝑘𝑡ℎ RBP with respect to the 𝑛𝑡ℎ scheduling period when considering 𝐶𝑄𝐼[𝑖] 𝐶𝑄𝐼[𝑖]: Last CQI reported by the 𝑖𝑡ℎ user Ω: Number of OFDM symbols that each RB encompasses 𝐺: Gain obtained by using the MIMO technique 𝜁: Percentage of overhead bits ∗ Δ𝑈𝑛,𝑗 [𝑖]: Estimate of how much the buffer filling of the 𝑖𝑡ℎ user will increase with respect to the 𝑗𝑡ℎ allocated scheduling unit in the 𝑛𝑡ℎ scheduling period 𝛼: Emergency state threshold of the MBF scheduling algorithm 𝑇𝑚𝑎𝑥 : Total simulation time 𝑁𝑈: Number of connected users 𝑅𝑒𝑠𝑡 : Estimated channel throughput by the rate adaptation algorithm 𝑅𝑠𝑎𝑚𝑝𝑙𝑒 : Sampled channel throughput by the rate adaptation algorithm 𝜃: Period concerning 𝑅𝑒𝑠𝑡 estimation and 𝑅𝑠𝑎𝑚𝑝𝑙𝑒 sampling 𝐵: Amount of bits downloaded during 𝜃 𝑏(𝑙) : Bitrate of the quality level 𝑙 𝑙𝑛𝑒𝑥𝑡 : Next requested video segment 𝑙𝑝𝑟𝑒V : Previously selected segment 𝑙𝑏𝑒𝑠𝑡 : Video segment which has the highest bitrate that does not exceed 𝑅𝑒𝑠𝑡 𝜇: Marginal buffer length (rate adaptation algorithm) 𝑡𝑙,𝜎 : Elapsed time to consume all the segments in the playback buffer 𝑛𝑙 : Expected number of segments to be downloaded during 𝑡𝑙,𝜎 𝜎: Predefined minimal buffer length (rate adaptation algorithm) 𝜏: Segment duration
Wireless Communications and Mobile Computing 𝜔:
Weight factor for 𝑅𝑠𝑎𝑚𝑝𝑙𝑒 (rate adaptation algorithm) 𝑛⬦ [𝑖]: Scheduling period index of the last scheduling unit allocated to the 𝑖𝑡ℎ user 𝑘⬦ [𝑖]): Index (within 𝑛⬦ [𝑖]) of the last scheduling unit allocated to the 𝑖𝑡ℎ user 𝑅𝑛 [𝑖]: Past average throughput (prior to the 𝑛𝑡ℎ scheduling period) of the 𝑖𝑡ℎ user 𝐹𝑛 [𝑖]: Size of the video frame that is being downloaded by the 𝑖𝑡ℎ user with respect to the 𝑛𝑡ℎ scheduling period 𝑓𝑛 [𝑖]: Number of video frames in the buffer of the 𝑖𝑡ℎ user at the beginning of the 𝑛𝑡ℎ scheduling period 𝑓min : Minimum number of frames that each client should have in the buffer (PFBF scheduling algorithm) 𝑝𝑟𝑒𝑏𝑢𝑓 [𝑖]: Percentage of the total streaming time spent by the 𝑖𝑡ℎ user in rebuffering 𝜆: Tunable parameter of the PFBF scheduling algorithm 𝜉: Tunable parameter of the PFBF scheduling algorithm 𝑄𝑜𝐸[𝑖] : QoE value (within the MOS scale) with respect to the 𝑖𝑡ℎ user (output of the QoE model) 𝑞[𝑖]: Average video quality level served to the 𝑖𝑡ℎ user 𝑞̂[𝑖]: Standard deviation of the video quality level served to the 𝑖𝑡ℎ user 𝑞total : Total number of different video quality levels available in the server 𝜙[𝑖]: Function that measures the impact of video freezes on the QoE of the 𝑖𝑡ℎ user (QoE model) 𝛽[𝑖] : Frequency of the rebuffering events experienced by the 𝑖𝑡ℎ user 𝜓[𝑖] : Mean duration of the rebuffering events experienced by the 𝑖𝑡ℎ user 𝑆(𝑄𝑜𝐸 ≥ 𝑌): Percentage of satisfied users (with QoE values greater or equal than 𝑌) 𝑁𝑆(𝑄𝑜𝐸 < 𝑍): Percentage of unsatisfied users (with QoE values less than 𝑍).
Data Availability The simulator data used to support the findings of this study have been deposited in the GitHub repository (https://github .com/ivo-sousa/scheduling LTE).
Conflicts of Interest The authors declare that there are no conflicts of interest regarding the publication of this paper.
Wireless Communications and Mobile Computing
15
Acknowledgments This work was funded by Instituto de Telecomunicac¸ o˜ es and Fundac¸a˜o para a Ciˆencia e a Tecnologia (FCT) under Project UID/EEA/50008/2013 and by Project MESMOQoE (no. 023110–16/SI/2016) supported by Norte Portugal Regional Operational Programme (NORTE 2020), under the PORTUGAL 2020 Partnership Agreement, through the European Regional Development Fund (ERDF).
References [1] CISCO, “Cisco Visual Networking Index: Global Mobile Data Traffic Forecast Update, 2015-2020 White Paper,” CISCO White Papers, February 2016. [2] T. D. Pessemier, K. D. Moor, W. Joseph, L. D. Marez, and L. Martens, “Quantifying the influence of rebuffering interruptions on the user’s quality of experience during mobile video watching,” IEEE Transactions on Broadcasting, vol. 59, no. 1, pp. 47–61, 2013. [3] D. Ghadiyaram, A. C. Bovik, H. Yeganeh, R. Kordasiewicz, and M. Gallant, “Study of the effects of stalling events on the quality of experience of mobile streaming videos,” in Proceedings of the 2014 IEEE Global Conference on Signal and Information Processing, GlobalSIP ’14, pp. 989–993, 2014. [4] ISO, “Information technology – Dynamic adaptive streaming over HTTP (DASH) – Part 1: Media presentation description and segment formats,” ISO/IEC 23009-1:2014, May 2014. [5] 3GPP, “Transparent end-to-end Packet-switched Streaming Service (PSS); Progressive Download and Dynamic Adaptive Streaming over HTTP (3GP-DASH),” 3GPP TS 26.247 (v. 15.2.0), March 2018. [6] I. Sodagar, “The MPEG-dash standard for multimedia streaming over the internet,” IEEE MultiMedia, vol. 18, no. 4, pp. 62–67, 2011. [7] K. Brunnstr¨om, S. A. Beker, K. D. Moor et al., “Qualinet White Paper on Definitions of Quality of Experience,” Output from the 5th Qualinet meeting (v. 1.2), March 2013. [8] ITU, “Mean opinion score (MOS) terminology,” ITU-T Recommendation P.800.1, February 2016. [9] W. Lin and C. Jay Kuo, “Perceptual visual quality metrics: a survey,” Journal of Visual Communication and Image Representation, vol. 22, no. 4, pp. 297–312, 2011. [10] S. Chikkerur, V. Sundaram, M. Reisslein, and L. J. Karam, “Objective video quality assessment methods: a classification, review, and performance comparison,” IEEE Transactions on Broadcasting, vol. 57, no. 2, pp. 165–182, 2011. [11] Y. Chen, K. Wu, and Q. Zhang, “From QoS to QoE: A tutorial on video quality assessment,” IEEE Communications Surveys & Tutorials, vol. 17, no. 2, pp. 1126–1165, 2015. [12] P. Juluri, V. Tamarapalli, and D. Medhi, “Measurement of quality of experience of video-on-demand services: A survey,” IEEE Communications Surveys & Tutorials, vol. 18, no. 1, pp. 401–418, 2016. [13] R. K. P. Mok, E. W. W. Chan, and R. K. C. Chang, “Measuring the quality of experience of HTTP video streaming,” in Proceedings of the 12th IFIP/IEEE International Symposium on Integrated Network Management, IM ’11, pp. 485–492, 2011. [14] J. D. Vriendt, D. D. Vleeschauwer, and D. Robinson, “Model for estimating QoE of video delivered using HTTP adaptive streaming,” in Proceedings of the 2013 IFIP/IEEE International
[15]
[16]
[17]
[18]
[19]
[20]
[21]
[22]
[23]
[24]
[25]
[26]
[27]
[28]
[29]
Symposium on Integrated Network Management, IM ’13, pp. 1288–1293, 2013. M. Claeys, S. Latr´e, J. Famaey, T. Wu, W. Van Leekwijck, and F. De Turck, “Design and optimisation of a (FA)Q-learning-based HTTP adaptive streaming client,” Connection Science, vol. 26, no. 1, pp. 25–43, 2014. 3GPP, “Evolved Universal Terrestrial Radio Access (E-UTRA) and Evolved Universal Terrestrial Radio Access Network (EUTRAN); Physical layer procedures,” 3GPP TS 36.213 (v. 15.0.0), December 2017. E. Dahlman, S. Parkvall, and J. Sk¨old, 4G: LTE/LTE-Advanced for Mobile Broadband, Academic Press, Oxford, UK, 2nd edition, 2014. F. Capozzi, G. Piro, L. A. Grieco, G. Boggia, and P. Camarda, “Downlink packet scheduling in LTE cellular networks: key design issues and a survey,” IEEE Communications Surveys & Tutorials, vol. 15, no. 2, pp. 678–700, 2013. M. Andrews, K. Kumaran, K. Ramanan, A. Stolyar, P. Whiting, and R. Vijayakumar, “Providing quality of service over a shared wireless link,” IEEE Communications Magazine, vol. 39, no. 2, pp. 150–153, 2001. J.-H. Rhee, J. M. Holtzman, and D.-K. Kim, “Scheduling of real/non-real time services: adaptive EXP/PF algorithm,” in Proceedings of the 57th IEEE Semiannual Vehicular Technology Conference (VTC 2003-Spring), vol. 1, pp. 462–466, 2003. F. Wamser, D. Staehle, J. Prokopec, A. Maeder, and P. TranGia, “Utilizing buffered YouTube playtime for QoE-oriented scheduling in OFDMA networks,” in Proceedings of the 24th International Teletraffic Congress (ITC 24), 2012. F. Pervez and M. S. Raheel, “Application-state aware scheduling for video delivery over LTE network,” in Proceedings of the 9th International Conference on Telecommunication Systems Services and Applications, TSSA ’15, November 2015. Y. Liu, D. Zhu, W. Ma, and L. Qian, “A QoE-oriented scheduling scheme for HTTP streaming service in LTE system,” in Proceedings of the 20th IEEE Symposium on Computers and Communication (ISCC ’15), pp. 889–894, 2015. V. Joseph and G. de Veciana, “NOVA: QoE-driven optimization of DASH-based video delivery in networks,” in Proceedings of the 33rd IEEE International Conference on Computer Communications (INFOCOM ’14), pp. 82–90, 2014. A. Seetharam, P. Dutta, V. Arya, J. Kurose, M. Chetlur, and S. Kalyanaraman, “On managing quality of experience of multiple video streams in wireless networks,” IEEE Transactions on Mobile Computing, vol. 14, no. 3, pp. 619–631, 2015. S. Singh, O. Oyman, A. Papathanassiou, D. Chatterjee, and J. G. Andrews, “Video capacity and QoE enhancements over LTE,” in Proceedings of the 2012 IEEE International Conference on Communications, ICC ’12, pp. 7071–7076, 2012. V. Ramamurthi and O. Oyman, “Video-QoE aware radio resource allocation for HTTP adaptive streaming,” in Proceedings of the 2014 IEEE International Conference on Communications, ICC ’14, pp. 1076–1081, 2014. W. Pu, Z. Zou, and C. W. Chen, “Video adaptation proxy for wireless dynamic adaptive streaming over HTTP,” in Proceedings of the 19th International Packet Video Workshop, (PV ’12), pp. 65–70, 2012. A. El Essaili, D. Schroeder, E. Steinbach, D. Staehle, and M. Shehada, “QoE-based traffic and resource management for adaptive HTTP video delivery in LTE,” IEEE Transactions on Circuits and Systems for Video Technology, vol. 25, no. 6, pp. 988– 1001, 2015.
16 [30] M. Zhao, X. Gong, J. Liang, W. Wang, X. Que, and S. Cheng, “QoE-driven cross-layer optimization for wireless dynamic adaptive streaming of scalable videos over HTTP,” IEEE Transactions on Circuits and Systems for Video Technology, vol. 25, no. 3, pp. 451–465, 2015. [31] W. Kim, K. Park, and H. Song, “QoE-based interworking call admission, handoff, and packet scheduling system for multimedia streaming services over LTE network,” in Proceedings of the 24th International Conference on Computer Communications and Networks, ICCCN ’15, 2015. [32] K. Miller, D. Bethanabhotla, G. Caire, and A. Wolisz, “A Control-Theoretic Approach to Adaptive Video Streaming in Dense Wireless Networks,” IEEE Transactions on Multimedia, vol. 17, no. 8, pp. 1309–1322, 2015. [33] A. Checko, H. L. Christiansen, Y. Yan et al., “Cloud RAN for Mobile Networks - A Technology Overview,” IEEE Communications Surveys & Tutorials, vol. 17, no. 1, pp. 405–426, 2015. [34] F. Rodrigues, I. Sousa, M. P. Queluz, and A. Rodrigues, A Simulator of Scheduling Algorithms in LTE, 2018, https://github.com/ ivo-sousa/scheduling LTE. [35] J. O. Fajardo, I. Taboada, and F. Liberal, “Analysis of CQI traces from LTE MIMO deployments and impact on classical schedulers,” in Proceedings of the 13rd International Conference on Wired/Wireless Internet Communications (WWIC ’15), pp. 60–73, 2015. [36] A. Virdis, G. Stea, and G. Nardini, “SimuLTE - A modular system-level simulator for LTE/LTE-A networks based on OMNeT++,” in Proceedings of the 4th International Conference on Simulation and Modeling Methodologies, Technologies and Applications, (SIMULTECH ’14), pp. 59–70, 2014. [37] A. Varga and R. Hornig, “An overview of the OMNeT++ simulation environment,” in Proceedings of the 1st International ICST Conference on Simulation Tools and Techniques for Communications, Networks and Systems (SIMUTools ’08), pp. 1–10, 2008. [38] L. Ruppert, B. Køster, A. M. Siegert et al., “YouTube as a source of health information: Analysis of sun protection and skin cancer prevention related issues,” Dermatology Online Journal, vol. 23, no. 1, 2017. [39] P. K. Rekhi, M. Luthra, S. Malik, and R. Atri, “Throughput Calculation for LTE TDD and FDD Systems,” White Paper, December 2012. [40] D. Suh, I. Jang, and S. Pack, “QoE-enhanced adaptation algorithm over DASH for multimedia streaming,” in Proceedings of the International Conference on Information Networking, ICOIN ’14, pp. 497–501, 2014. [41] S. Lederer, C. M¨uller, and C. Timmerer, “Dynamic adaptive streaming over HTTP dataset,” in Proceedings of the 3rd ACM Multimedia Systems Conference, (MMSys’12), pp. 89–94, 2012. [42] D. J. C. Mackay, “Introduction to Monte Carlo Methods,” in Learning in Graphical Models, pp. 175–204, 1998.
Wireless Communications and Mobile Computing
International Journal of
Advances in
Rotating Machinery
Engineering Journal of
Hindawi www.hindawi.com
Volume 2018
The Scientific World Journal Hindawi Publishing Corporation http://www.hindawi.com www.hindawi.com
Volume 2018 2013
Multimedia
Journal of
Sensors Hindawi www.hindawi.com
Volume 2018
Hindawi www.hindawi.com
Volume 2018
Hindawi www.hindawi.com
Volume 2018
Journal of
Control Science and Engineering
Advances in
Civil Engineering Hindawi www.hindawi.com
Hindawi www.hindawi.com
Volume 2018
Volume 2018
Submit your manuscripts at www.hindawi.com Journal of
Journal of
Electrical and Computer Engineering
Robotics Hindawi www.hindawi.com
Hindawi www.hindawi.com
Volume 2018
Volume 2018
VLSI Design Advances in OptoElectronics International Journal of
Navigation and Observation Hindawi www.hindawi.com
Volume 2018
Hindawi www.hindawi.com
Hindawi www.hindawi.com
Chemical Engineering Hindawi www.hindawi.com
Volume 2018
Volume 2018
Active and Passive Electronic Components
Antennas and Propagation Hindawi www.hindawi.com
Aerospace Engineering
Hindawi www.hindawi.com
Volume 2018
Hindawi www.hindawi.com
Volume 2018
Volume 2018
International Journal of
International Journal of
International Journal of
Modelling & Simulation in Engineering
Volume 2018
Hindawi www.hindawi.com
Volume 2018
Shock and Vibration Hindawi www.hindawi.com
Volume 2018
Advances in
Acoustics and Vibration Hindawi www.hindawi.com
Volume 2018