of Apple HTTP Live Streaming video sessions obtained from a number of operational CDN nodes and traces of. Microsoft Smooth Streaming video sessions ...
Scalable Network-Based Video-Freeze Detection for HTTP Adaptive Streaming Tingyao Wu, Rafael Huysegems, Tom Bostoen Alcatel Lucent - Bell Labs, Copernicuslaan 50, B-2018 Antwerp, Belgium Email: {Tingyao.Wu, Rafael.Huysegems, Tom.Bostoen}@alcatel-lucent.com Abstract—HTTP adaptive streaming (HAS) has become a key video delivery technology for mobile and fixed networks. Internet service providers and CDN (Content Delivery Network) providers are interested in networkbased monitoring the client’s Quality of Experience (QoE) for HAS sessions. In our previous work, we designed a HAS QoE monitoring system based on the sequence of HTTP GET requests collected at the CDN nodes. The system relies on a technique called session reconstruction to retrieve the major QoE parameters without modification of the clients. However, session reconstruction is computationally intensive and requires manual configuration of reconstruction rules. To overcome the limitations of session reconstruction, this paper proposes a scalable machine learning (ML) based scheme that detects video freezes using a few high-level features extracted from the network-based monitoring data. We determine the discriminative features for session representation and assess five potential classifiers. We select the C4.5 decision tree as classifier because of its simplicity, scalability, accuracy, and explainability. To evaluate our solution, we use traces of Apple HTTP Live Streaming video sessions obtained from a number of operational CDN nodes and traces of Microsoft Smooth Streaming video sessions acquired in a controlled lab environment. Experimental results show that an accuracy of about 98%, 98%, and 90% can be obtained for the detection of a video freeze, a long video freeze, and multiple video freezes, respectively. Excluding log parsing, the computational cost of the proposed videofreeze detection is 33 times smaller than needed for session reconstruction.
I.
I NTRODUCTION
With the growing popularity of HAS-based video delivery and the increasing number of operational HTTP adaptive streaming (HAS) deployments, network and CDN providers are interested to monitor the perceived end-user QoE of HAS sessions over their network, because this QoE monitoring would reveal how satisfied the end users are about the video delivery. However, requested visual quality levels and the occurrence and duration of video freezes, which are important QoE related parameters, are only known to the client application, and in some cases, the server (for instance, the feature Advanced Logging in Microsoft Internet Information Services (IIS) enables Microsoft Silverlight clients [1] to send useful data to the IIS
server about how media content is consumed at a regular time basis). But typically these QoE related parameters are not reported to intermediate network providers. As a result, a network-based QoE assessment mechanism is a possible solution to understand the QoE parameters at the client side. In our previous work [2], we demonstrated that from session information that was collected by intermediate network elements, the HAS session can be reconstructed to derive all QoE related parameters. These parameters include the average playout quality, changes in the play-out quality, rebuffering due to buffer starvation, rebuffering caused by interactivity, etc. The session reconstruction technique, which applies manually defined rules, does not require any modification to the original HAS client to provide QoE related information and thus is a feasible method for network and CDN providers to assess the video delivery quality of HAS. Because each HTTP GET request contains the requested quality level for every video segment, the QoE parameters related to video quality can be obtained directly by parsing the HTTP requests. However, information about the video freezes, cannot be inferred directly from the HTTP requests. In fact, a video freeze is the most deleterious factor as far as viewers’ satisfaction and engagement are concerned. For example, [3] shows that the engagement for a freeze-free video session is 226% larger than for a video session with rebuffering; it also presents that a 1% increase in rebuffering duration results in 8 minutes of lost viewing time. In our previous work [2], we use the session reconstruction technique at the network side to fully reconstruct how video segments are consumed at the client side. By means of this method, one can determine whether and when rebuffering events occurred and the duration of such events. However, the proportion of video sessions with a freeze is moderate: [3]also claims that 39.3% of the analyzed streams experienced an interruption due to rebuffering; this figure is further reduced to 26.9% in its report published in 2014 [4]. This claim implies that 60-80% of streams do not contain any video freeze and therefore do not require session reconstruction for retrieving QoE parameters. If there are tens of thousands of concurrent video streams
delivered by a CDN, reconstructing all sessions is a high burden for network and CDN providers. In addition, manually-defined reconstruction rules required for the session reconstruction are usually client dependent and must be tuned for each new HAS deployments. All these arguments motivate us to study a scalable QoE assessment solution for detecting freezes in a video session without any pre-defined rules. With this scalable freeze dection, only the sessions which are identified as containing a freeze have to be further examined using session reconstruction to acquire the detailed properties of the rebuffering events such as their position and duration. This paper studies the use of scalable machinelearning techniques to detect freezes in HAS video sessions from the network or CDN side. The “scalable detection” means that we avoid to dive into the computationally intensive segment-by-segment reconstruction and that we also avoid manual effort to tune the deployment-dependent reconstruction rules to every particular HAS deployment as described in [2]. Instead, a few high-level features are extracted from monitored video sessions to represent the characteristics of the sessions. From these features we attempt to learn the rules automatically and answer the following questions: •
Does a video session contain any freeze?
•
If so, is the longest video freeze exceeding a predefined threshold of e.g. 10 seconds?
•
Are there multiple video freezes in the session?
The answers to the above three questions provide a sufficient understanding of video freeze regarding QoE. Note that these answers provide a coarse characterization of the video freezes and do not reveal the details, e.g., the position and the duration of the video freezes. Such detailed information can be obtained using the full session reconstruction. Also note that in this study, we do not consider intermediate caching nor do we take user interactivity in the video sessions into account because these two conditions occur very infrequently, if at all, in our available test-data. The remaining sections are organized as follows : in section II, we present the concept and background of HTTP adaptive streaming and its corresponding QoE research. In section III, we first position our study in the CDN loop, then we introduce and investigate discriminative high-level features for a video session, followed by looking for a classifier which is preferably simple, accurate, and scalable in section III-E. The experiments (Section IV) are performed on two log files containing multiple sessions. The first log file contains HTTP segment requests for Apple HTTP Live Streaming, collected in an operational CDN. The second log file contains HTTP segment requests for Microsoft Smooth Streaming, collected in a controlled lab setup. The conclusions are given in section V.
II.
BACKGROUND
A. HTTP Adaptive Streaming HTTP adaptive streaming is a video streaming technique which aims at reducing rebuffering events by adapting the video quality to the network conditions. Next to the adaptability, the advantages of HAS are the easy traversal of the HTTP based traffic through firewalls, and the possibility to reuse the standard HTTP infrastructure. HAS is widely supported by large companies such as Microsoft with Smooth Streaming [1], Apple with Live Streaming [5], Adobe with Adobe Dynamic Streaming [6] and is recently standardized by MPEG as Dynamic Adaptive Streaming over HTTP (DASH) [7]. For HTTP adaptive streaming, a video is encoded in different quality levels, resulting in different bit rates. Next, each quality level is divided into independent segments with a fixed duration (sometimes the duration may be various) that is typically between two and ten seconds. The encoded segments of the different quality levels are hosted on an HTTP Web server (or CDN), together with a manifest file describing the quality levels and the corresponding segments. The manifest file acts as a roadmap to navigate through the different segments, containing information about the number of segments in the play-out (audio and video), the available quality levels for each segment, the duration of the segments and all other data required by the client to perform a seamless play-out. At the start of a new HAS session, the HAS client downloads the manifest file using the HTTP GET command to know all available resources at the server or CDN side. Then the heuristic of the HAS client, acting as a Rate Determination Algorithm (RDA), is activated to decide the quality levels of video segments that will be downloaded. During the play-out, the downloaded segments with different quality levels will be seamlessly concatenated. To ensure a continuous play-out and avoid constantly changing quality levels due to fluctuation in the available bandwidth, the client maintains a buffer which typically can hold 10 to 30 seconds of video and audio. The maximum buffer size is deployment-dependent. To determine the most optimal quality level, the client heuristic uses the current buffer filling and the perceived end-to-end bandwidth from previous segment downloads. Other criteria, such as CPU load or playout screen size, can also be taken into account [8]. When the session starts, the client heuristic requests the next segment as soon as it has fully received the previous one, in order to quickly increase its bufferfilling level. Once the maximum buffer-filling level is reached, the inter-segment time between two request is roughly equal to the duration of segment. If the requested segments are not received in time for playout (the buffer runs empty), the playout stops and the video appears frozen to the viewer. At this point, the client
will re-buffer and continues the playout when a certain buffer level is reached again. The target of the heuristic is, on the premise of ensuring a continuous play-out, to request the best possible quality [9]. This is apparently a trade-off. If the heuristic sticks to a high quality level when the bandwidth is temporary reduced, it risks a rebuffering period, resulting in a bad viewing experience. However, if the heuristic is not aggressive enough in its attempt to increase the requested quality, the average quality will be low compared to the available bandwidth over the session and the result will also be a poor viewing experience.
experience. With QoE assessment, the help desk of the operator is able to reconstruct the HAS sessions viewed by the user, find out the QoE relevant events and then possibly provide a solution specifically for the user. Moreover, the availability of real-time QoE assessment could even enable providers to make realtime adjustments in the behavior of the network-nodes to generally improve the handling of HAS sessions [15] or to obtain a fairer assignment of network-resources for competing HAS sessions. Nodes can give priority to HAS sessions that are close to an under-run, thereby actively preventing a likely rebuffering event for that HAS client [16].
B. QoE Assessment
As HAS is becoming the most popular method to deliver Over The Top (OTT) video, the QoE monitoring of HAS streams will gain importance. A comprehensive survey [17] on this topic will appear soon. The survey revisits subjective studies which cover QoE aspects of quality adaptation, and identifies QoE influence factors of HAS and corresponding QoE models. In [18], the authors investigate how the varying quality introduced by network impairments influences the subjectives of MOS score for a few commercial HAS employments. Besides, there are some studies looking for a mathematical function to map QoS parameters to a subjective MOS score. For instance, Singh et al. [19] proposes to use a neural network to learn the client’s MOS scores, e.g., mapping the input for the learning system, including the parameters for play-out interruption and the encoding Quantization parameter (QP), to the MOS scores. Leister et al. [20] present a model for estimating the subjective quality from objective measurements, such as packet loss ratio and bit rate on the network. Such studies typically use a rather small population and short video sequences (typically videos less than 1 minute), as obtaining subjective-dependent MOS scores is very costly. Meanwhile, the estimation of client QoE relies on parameters in the transport layer.
Network based QoE monitoring/prediction/evaluation of video streams has attracted the interest of researchers for decades. Winkler et al. [10], [11] uses measurable QoS factors such as loss, delay and jitter to estimate the effect on the QoE of the session when dealing with traditional UDP-based video streaming. However These techniques are not applicable for HAS as it is delivered over a reliable transport protocol. There have been some studies specifically for the TCP based video streaming. Dalal et al. in [12] demonstrate a nearest-neighbor heuristic to assess the QoE of TCP video streams in real time, using 15 seconds of data. Latre et al. [13] proposes a method to predict the QoE of a progressive download session in real-time. It is based on information that can be retrieved from intermediate nodes in the access network, eliminating the need for additional feedback from the player. An interesting study is presented in [14], in which the relationship among three levels of quality of service (QoS) of HTTP video streaming, namely network QoS, application QoS, and user QoE, is investigated. The work aims at understanding how the network QoS affects the QoE of HTTP progressive video streaming. Analytical models and an empirical evaluation are performed to characterize the correlation between the application and network QoS. Subjective experiments are used to evaluate the relationship between application QoS and QoE. C. HAS QoE Assessment For CDN-providers and network operators, a reliable QoE assessment for HAS clients in an intermediate node can be a preliminary step to understand how satisfied end-users are about the delivery. This knowledge can further be used for actively managing, guarding and enhancing the QoE in their network in general. Macroscopically, aggregated HAS QoE for different sessions provides a good view on the state of the network. For example, a low average viewing quality and frequent rebuffering events could indicate traffic congestion, requiring an extension of the network to provide more bandwidth. On the other hand, microscopically, the support team of a network operator may receive a complaint from a user with a bad viewing
III.
S CALABLE NETWORK - BASED VIDEO - FREEZE DETECTION
A. The position of scalable network-based video-freeze detection in the CDN loop Figure 1 illustrates the utility and position of the proposed network-based video freeze detection in the CDN loop. A CDN node maintains a log file recording all segment-level HTTP requests from multiple clients. The log file is parsed and split into multiple session logs, each containing all HTTP requests for one single video session. Tracking different segments from the original CDN log file for the same video session is done through checking the unique MD5 of a session in each of HTTP request. These video sessions are the input of the freeze detection, as shown in the dashed box in Figure 1. There are two main modules in this study, namely modeling and detection respectively, which will be further explained in section III-C. The output of the freeze detection is the rebuffering information of a
Training
Models
HAS scalable videofreeze detection Evaluation Step
Feature evaluation and selection
with freeze
CDN logfile
CDN node
x1=[f13, f15, …]: 0 x2=[f23, f25, …]: 1 x3=[f33, f35, …]: 1
Feature extraction T1: x1 =[f11, f12, f13, f14…] T2: x2 =[f21, f22, f23, f24…] T3: x3 =[f31, f32, f33, f34…]
x1 =[f13, f18 …]: 0 x2 =[f23, f28…]: 0 x3 =[f33, f38…]: 1
x1 =[f14, f17 …]: 0 x2 =[f24, f27…]: 1 x3 =[f34, f27…]: 1
x1 =[f13, f15, …] x2 =[f23, f25, …]
x1 =[f13, f18 ,…] x2 =[f23, f28, …]
x1 =[f14, f17, …] x2 =[f24, f27, …]
x3 =[f33, f35, …]
x3 =[f33, f38, …]
x3 =[f34, f27, …]
Task 1
Task 2
Task 3
Classify
Task 1 QoE parameter estimation
Client
T3 T2 T1
without freeze
HAS session reconstruction Client requires no modification
Test Set: Video sessions
S2 S1
Feature extraction S1: x1=[f11, f12, f13, f14…]: (0 0 0) S2: x2=[f21, f22, f23, f24…]: (1 0 1) S3: x3=[f31, f32, f33, f34…]: (1 1 1)
Training Step
Session log parsing
S3
Training Set: Video sessions
Modeling
Origin server
Task 2
Modeling
Modeling
Classifiers Global QoE rating for the complete session
Fig. 1. The position of scalable network-based video-freeze detection in the CDN loop
single video session. If a session does not contain any freeze, then its global QoE rating can be achieved by combining with other QoE parameters (such as quality). If a session is identified as having a freeze, having at least one long freeze or having multiple freezes, this session is optionally sent to the HAS session reconstruction [2] module to obtain the detailed freezeinformation .
Off-line training
Fig. 2.
Classify
Classify
Task 3
T1: no freeze (0 0 0) T2: freeze, long freeze (1 1 0) T3: freeze, multiple freezes (1 0 1)
On-line test
The diagram of the freeze detection
as quickly as possible) or in panic state (the state in which the client buffer is close to an under-run). If the time interval of consecutive requests is much longer than the segment duration, there is a high probability that the client is experiencing a freeze. To identify based on network/CDN logs whether rebuffering events occurred at the client side, we rely on machine learning techniques.
B. Problem statement
C. System description
The difficulty of in-network HAS based QoE assessment in is to derive the QoE parameters of the session based on log data obtained from an origin server or a CDN delivery node (see section IV-A for a realisitc example). The input data is usually a series of GET requests of video and audio segments with the timestamps and requested quality levels. Because the size of audio segments is usually much smaller than that of video segments, audio segments are unlikely to be the reason of rebuffering. So in this paper, unless otherwise stated, the audio segments are ignored. When a client requests a segment, there is no guarantee that the client will receive the segment in time, due to for example traffic congestion. On the other hand, what the server/CDN node can observe is only the sequence of GET requests, without knowing the instant status of the heuristic, such as the buffer filling level, the perceived bandwidth, and the parameters of the client, such as the maximum buffer size, the initial delay, etc. Without access to the client data, CDN providers have to infer how these video segments are consumed based on the requests in the log files. If a server/CDN node receives requests with a fixed time interval between segments approximately equal to the duration of a segment, it probably means that the client-buffer is completely filled and the playback is currently free of freezes; if the requests are received close after each other, it may indicate the client is in loading state (the state in which the client wants to fill the buffer
The diagram of the proposed scalable freeze detection is shown in Figure 2. In the off-line step, we have a training set of video sessions, each of which contains a sequence of GET requests with the corresponding timestamps and quality levels, and we also have the ground truth of the freeze events occurring at the client for each session. Each session is associated with three binary labels, indicating the occurrence of a rebuffering event, the occurrence of a long rebuffering and the occurrence of multiple rebuffering events respectively, based on the ground truth. For example, a session with (1 0 1), as x2 in the training set (Figure 2), means that it contains more than one freeze, but none of them is a long freeze. A “long freeze” is a freeze longer than an arbitrary threshold (in our study, we set the threshold as 10 seconds). Each binary label represents one classification task. In the feature extraction step, for a video session Si , a feature vector xi = (fi1 , fi2 , fi3 ...), containing highlevel statistics of the session, is extracted to represent the characteristics of the video session. Then feature evaluation is performed to evaluate the discriminative capability of individual features for the classification tasks. After the feature evaluation step, each feature vector is pruned by removing the less-discriminative features. Then three models for different classification tasks are built based on the feature vectors and the corresponding ground-truth in the training set.
Assuming that the duration for a video segment L is fixed, a list of average inter-segment durations for k previously received segments can be calculated as
Client Buffer Filling Level 20s
14s 6s New segment
8s 6s
dkj 6s New segment
2s
Play-out time 0s
12s
24s
36s
( Pj 1 i=j−k+1 Ii = k 1P j i=1 Ii j
if j >= k if j < k
(1)
The lowest estimated buffer for a k-segment window is calculated as
4s freeze
b1k = Nk × L −
Nk X
Ii ,
(2)
i=1
Fig. 3. An example of the occurrence of a freeze when multiple moderately long inter-segment durations happen. At t = 0, the client buffer filling level is 20 seconds. The three subsequent segments are retrieved in every 12 seconds in a row, resulting in a 4-second freeze at t = 36.
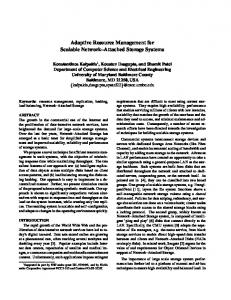
In the online test phase, we extract for each video session the discriminative features learned from the training set. Then each feature vector will be classified by the three models, and the output are three binary labels, describing the information of freeze occurrence. D. Feature extraction and selection Given a video session, with the timestamp of the segment-level HTTP GET request ti and the quality levels qi for a segment i, the inter-segment duration between two consecutive requested segments is then calculated as Ii = ti+1 − ti . The inter-segment duration Ii is the most informative source that we rely on to detect freeze. Intuitively, the longer the intersegment duration, the higher the probability that the client experiences a rebuffering event. However a single high inter-segment duration is usually not enough to push the client into buffer under-run; the inter-segment durations for a few previously requested segments must also be taken into account. Indeed, in video viewing, the occurrence of a freeze for a large inter-segment retrieval duration largely depends on how evenly/smoothly previous segments are received. Suppose at a certain time the video buffer filling level at the client is 20 seconds, a single 19-second inter-segment duration will not lead to a picture-freeze if the next segments can be retrieved on time. However, as shown in the example of Figure 3, three subsequent 12-second inter-segment durations will result in a 4-second freeze (assuming a segment duration of 6 seconds, the standard segment duration used by Apple Live Streaming). On the other hand, covering previous segments too widely may neutralize the large inter-segment intervals, making freeze detection more difficult. This requires us to look for an appropriate window size. To this end, we extensively examine different window sizes in the training set.
where Nk = arg max∀j dkj , denoting the most possible place that a rebuffering event occurs, if any, for the k-segment window. The first part Nk × L in fact is the playout time at Nk , assuming there are no smaller freezes between the starting playout point and Nk , and the second apart is the aggreated duration that all Nk segments are received. Note that the buffer estimation obtained from Eq. 2 is only the relative buffer, but not the true buffer filling level at the client. The difference between the estimated buffer filling level and the true value is due to two reasons. The first is the initial delay, the time that a heuristic waits to start the playout after it receives the first seconds of videos. Because the initial delay applied by the client in unknown, it is impossible to infer the true buffer filling level. However, if all the video sessions are associated with the same HAS heuristic, the initial delay is identical in the training video sessions and in the test set. In this case the function of initial delay in the classification is merely a translation of the decision plane and does not change the classification capability. The second reason for the descrenpancy of the estimated buffer filling level and the true value is the possible existence of smaller rebuffering events between the starting playout time and Nk . The existence of less prominent freezes makes us over-estimate the real playout time at Nk . Nevertheless, we can take the estimated buffer filling level obtained from Eq. 2 as the clue to detect the rebuffering events. Figure 4 explains the necessity of feature extraction performed over different window sizes. The curves in the three subplots represents the average inter-segment duration dkj with different window sizes k (k=1, 3, and 5 from the top to the bottom) for a single video session. As can be seen, when k = 1, the most possible rebuffering place is at N1 = 58, with the intersegment duration of 30 seconds, which is significant. But in fact, the rebuffering does not occur at this position because of the fast refilling of the buffer by the subsequent segment retrievals. On the other hand, when k = 5, the most possible rebuffering place is at N5 = 46, with an average duration of 11 seconds for five subsequent inter-segment durations. This actually leads to a rebuffering event. With different window sizes k, a few possible rebuffering places are found, and the buffer filling at these places, b1k is calculated.
Nk=58
Nk=33
In order to find an appropriate feature set from all extracted features, we evaluate the worth of each feature by ranking the information gain with respect to the class [21] and select features with high information gain (IG). Denote the training set X , each of the form z = (x, y) = (x1 , x2 , ..., y), in which xs ∈vals(s) the value of the sth feature of vector x and y the corresponding class label, the information gain for feature s is defined as: IG(X , s) =H(X ) X |{z ∈ X |xs = v}| − · H({z ∈ X |xs = v}) |X | v
(3)
Nk=46
P where entropy H(X ) = − i P (zi )log2 P (zi ) andP the conditional entropy H({z|xs = v}) = − P (v, y)log(P (y|v)). Fig. 4. A real example of feature extraction for one video session with different window sizes.
For the sake of the multi-freeze classification, we also include the second lowest estimated buffer, b2k , into our feature set. Furthermore, the average intersegment duration and the median inter-segment duration are taken as the first-order statistics of the whole video session. In summary, a feature vector ¯ M edian(I)) (|x| = 2 × x = (b11 , b21 , ...b1K , b2K , I, K + 2, K is the maximum window size) is extracted to represent the high level information of one single video session. In our preliminary experiments, we also included quality-related features, but such features did not improve the classification, implying that rebuffering events are independent of the chosen quality levels by the client. In Eq. 2, the precise segment duration L is crucial for buffer filling estimation. In this study, only the fixed segment duration is concerned. But this parameter is usually unknown and deployment-dependent. One way to obtain the segment duration is to intercept and parse the manifest file at the CDN, which is an extra effort. The other way is to use the property of HAS itself: in a freeze-free session, a segment cannot be requested too early, due to the limitation of the maximum buffer length; the segment cannot be retrieved too late either because the late arrival could result in a freeze. If the initial delay is u seconds, the maximum buffer limit is M seconds (M > u), and the number of segments in a session is N , then for a session without any freeze, the last segment must be fully obtained between N × L − M + u and N × L + u,Pto guarantee a freeze-free session: N × L − M +P u < Ii < N × L + u, leading P Ii u −N < L < NIi − u−M to NP N . When N → +∞, Ii L ≈ N . This gives us a way to estimate the segment duration from a few long freeze-free video sessions in the training set. In practice, we select the 10Plongest freeze-free sessions and take the average of NIi for the 10 sessions as the estimation of segment duration, resulting in a marginal 0.2% error from the true value.
E. Classifiers Given the most relevant feature vectors, the desirable classifier should be simple, accurate and quick in the test phase. The capability of being visually explainable is also a plus. We will compare some widely-used classical machine learning algorithms [21], including Support Vector Machine (SVM), logistic regression (LR), multi-layer perceptron (MLP), AdaBoost and C4.5 decision tree and choose the most appropriate one. IV.
E XPERIMENTS
A. Data sets 1) Data set 1: Apple HTTP Live Streaming (HLS) linear TV sessions: We use two CDN log files containing HTTP Adaptive Stream requests. The log files were recorded in an operational CDN used to deliver live/linear HAS TV services. The first log file, denoted as Field Dataset 2012 contains 24-hour segment requests on one day in the first quarter of 2012, and the second log, Field Dataset 2014 contains a one-hour trace on another day in the first quarter of 2014. After logline and URL parsing, we collect all relevant segment retrievals per video session. In each video session, the following information is available: client IP-address, TV channel, the quality of each video segment and the timestamp indicating when the request was received by the CDN. 99% of all available HTTP Adaptive Streaming sessions are the streams of Apple HLS linear TV and the rest are mainly Microsoft Smooth Streaming. In this data set, we focus on Apple HLS Linear TV. The duration of a segment is six seconds. Every segment is available in five different quality levels. Dataset Field Dataset 2012 contains 88109 sessions, in which there are 58729 (or 66.6%) sessions without freeze, 21476 (or 24.3%) sessions with at least one significant freeze (longer than 10 seconds), and 18493 (or 21.0%) sessions with two or more freezes. Dataset Field Dataset 2014 contains 52173 video sessions, in which 7998 (or 15.3%) sessions contain rebuffering events, 6469 (or 12.4%) sessions have at least one
Click Modular Router Bandwidth Limitation Module
HAS Server: sliverlight
bw HAS client A video clip: 10mins, 299 segments
Microsoft Smooth Streaming t
Server Log Client Log
Fig. 5.
Simulation design for the Lab Dataset
192.168.3.102 - - [03/Apr/2014:07:08:42 +0200] "GET /Big_Buck_Bunny/Big Buck Bunny.ism?Manifest HTTP/1.1" 200 58916 192.168.3.102 - - [03/Apr/2014:07:08:43 +0200] "GET /Big_Buck_Bunny/Big Buck Bunny.ism?QualityLevels(300000)&Fragments(video =0) HTTP/1.1" 200 73266 192.168.3.102 - - [03/Apr/2014:07:08:45 +0200] "GET /Big_Buck_Bunny/Big Buck Bunny.ism?QualityLevels(300000)&Fragments(video =20000000) HTTP/1.1" 200 67896 192.168.3.102 - - [03/Apr/2014:07:08:46 +0200] "GET /Big_Buck_Bunny/Big Buck Bunny.ism?QualityLevels(300000)&Fragments(video =40000000) HTTP/1.1" 200 83951 192.168.3.102 - - [03/Apr/2014:07:08:48 +0200] "GET /Big_Buck_Bunny/Big Buck Bunny.ism?QualityLevels(300000)&Fragments(video =60000000) HTTP/1.1" 200 80568 …
Server log
[SmoothStream-heuristic] received 58916 bytes [2014/4/3 6:8:32 heuristic] request segment [1/0] at time 0 /QualityLevels( 300000 )/Fragments(video= 0 ) [SmoothStream-heuristic] perceived BW = 666.055 Kbps
[heuristic] new ql = 1 buffer = 2 tot-freezetime = 0.885 /QualityLevels( 300000 )/Fragments(video= 20000000 ) [SmoothStream-heuristic] perceived BW = 416.221 Kbps
[heuristic] new ql = 1 buffer = 2.684 tot-freezetime = 0.885 /QualityLevels( 300000 )/Fragments(video= 40000000 ) [SmoothStream-heuristic] perceived BW = 444.774 Kbps [heuristic] new ql = 1 buffer = 3.162 tot-freezetime = 0.885 /QualityLevels( 300000 )/Fragments(video= 60000000 ) [SmoothStream-heuristic] perceived BW = 376.266 Kbps [heuristic] new ql = 1 buffer = 3.437 tot-freezetime = 0.885 /QualityLevels( 300000 )/Fragments(video= 80000000 ) [SmoothStream-heuristic] perceived BW = 359.053 Kbps …
Client log
Fig. 6. An example of server log and client log for the experiment setup of the Lab Dataset
long freeze, and 3750 (or 7.2%) sessions have multiplefreezes. In the log files, the timestamp for each request is the time that the CDN received for the HTTP GET request; we do not know whether and when end-users fully received a segment. Therefore, the ground truth of freeze-related information is unknown. To retrieve freeze information, we base our work on the results of session reconstruction done by Huysegems [2], to reveal the location, frequency and duration of freezes in each of the sessions. We also assume that no caching or user interactivity occurred in the video sessions. A 10-fold cross-validation scheme is used to generate training sets and test sets for Field Dataset 2012. For a single classification task, the performance is evaluated by averaging all classification rates over 10-fold test sets . Furthermore, to test the stability of the algorithm, we use the models trained from Field Dataset 2012, and test them with the video sessions in Field Dataset 2014.
2) Data set 2: Microsoft Smooth Streaming in a lab-controlled environment: Besides the Field Dataset, we also collect a database in a lab-controlled environment for Microsoft Smooth Streaming. The emulated setup of a Video-on-Demand (VOD) system is demonstrated in Figure 5 . At the server side, a video clip, Big Buck Bunny, is hosted and available for retrieval by the clients. This video clip, about 10 minutes long, consists of 299 segments, each with a fixed length of 2 seconds. Each video segment is encoded in 7 quality levels: 300 kb/s, 427 kb/s, 608 kb/s, 866 kb/s, 1233 kb/s, 1636 kb/s and 2436 kb/s. The server side also maintains a log file recording all GET requests from the client. At the client side, an emulation version of the standard Microsoft Smooth Streaming [1] runs. Between the HAS server and the client, a bandwidth limitation module, which is implemented on Click Modular Router [22], is used to limit the bandwidth between the server and the client. The module contains two random values, namely, the available bandwidth and its duration. The limited bandwidth is in the range of 300 kb/s and 2700 kb/s. However, because of the burstiness of TCP connections, the client could encounter very low bandwidth for a short period. In total, this data set, denoted as Lab Dataset, consists of 3016 video sessions, of which 2155 (or 71.4%) sessions experience freeze events, 1962 (or 65.1%) sessions contain at least one long freeze and 1976 (65.5%) sessions encounter multiple freezes. This data set consists of proportionally less freeze-free sessions intentionally as we are more concerned about sessions with rebuffering. The emulation version of the Microsoft Smooth Streaming client does not have the capability to decode and render the received segments, but it is able to record the status of the heuristic, including perceived bandwidth, buffer filling, requested quality, and more importantly, experienced freeze time. An example of the coupled logs for the server side and the client side is shown in Figure 6. The log at the server side provides the timestamp when each GET request is received, from which a feature vector x is extracted as introduced in section III-D. The log at the client side is the ground truth of rebuffering events, containing information about location, frequency and duration of rebuffering events. Based on this knowledge, every session logged at the server side then is assigned three binary class labels. We also follow the 10-fold cross-validation scheme for evaluating the classification performance. B. Feature evaluation The feature matrix X is extracted from a training set. We set the largest window size for the Field Dataset and Lab Dataset to 6 segments (=36 seconds) and 20 segments (=40 seconds) respectively. Then information gain is used to rank all features. For the three classification tasks, Table I and Table II list the top
eight features with the highest IG, and the IGs of the first-order statistics. There are a few observations from the results. First, for the first two tasks, freeze/nonfreeze classification and long-freeze identification, features concerning about the lowest buffer estimation, e.g., b1,· are dominant; but for the multi-freeze task, features with the second lowest buffer estimation, like b2,5 and b2,4 are prominent. This is reasonable, as the second lowest buffer estimation reveals the information of another potential freeze, which helps for the multifreeze classification. Secondly, the first order statistics, including the mean and the median inter-segment time, contain little information, if any. Based on the ranking of the features, we select the five most discriminative features, which yield the highest IGs, for each classification task. TABLE I.
F EATURE RANKING . DATA SET: Field Dataset 2012
Freeze/non-freeze feature IG b1,2 0.76 b1,3 0.76 b1,4 0.75 b1,1 0.75 b1,5 0.75 b2,2 0.68 b2,3 0.67 b2,4 0.66 M ean(I) 0.50 M edian(I) 0.09
TABLE II.
Long Freeze feature IG b1,3 0.66 b1,2 0.66 b1,4 0.66 b1,5 0.66 b1,1 0.65 b2,2 0.60 b2,3 0.60 b2,4 0.59 M ean(I) 0.42 M edian(I) 0.06
Multi-Freeze feature IG b2,5 0.39 b2,4 0.39 b2,1 0.39 b2,3 0.39 b1,5 0.38 b1,3 0.38 b2,2 0.37 b1,2 0.36 M ean(I) 0.25 M edian(I) 0.07
F EATURE RANKING . DATA SET: Lab Dataset
Freeze/non-freeze feature IG b1,12 0.77 b1,13 0.77 b2,15 0.77 b2,10 0.77 b2,11 0.77 b2,14 0.77 b1,11 0.76 b2,13 0.76 M ean(I) 0.51 M edian(I) 0
Long Freeze feature IG b1,16 0.88 b1,19 0.88 b1,15 0.88 b1,17 0.88 b1,18 0.88 b1,13 0.88 b1,20 0.87 b2,20 0.87 M ean(I) 0.68 M edian(I) 0
Multi-Freeze feature IG b2,15 0.52 b2,11 0.51 b2,14 0.51 b2,13 0.51 b2,12 0.51 b2,16 0.51 b1,13 0.51 b2,10 0.51 M ean(I) 0.34 M edian(I) 0
C. Classifier comparison Using the selected features, we evaluate the performance and accuracy of three classification methods based on a well-known machine learning tool, Weka 3.6 [23]. The results can be found in Table Table III and Table IV. In general, we can see that C4.5 and AdaBoost show consistently satisfied classification rates in all tasks for both data sets with less consumption of CPU time. The performance of LinearSVM is moderate but the algorithm is quite time-consuming, especially when the training set is large. LR obtained a poor accuracy in the task of multi-freeze classification and M LP acts as a weak classifier in the Field Dataset 2012. From the aspects of accuracy, simplicity, explainability and execution speed, we finally adopt C4.5 as
TABLE III. ACCURACY OF THE AVERAGE CLASSIFICATION (%) AND THE STANDARD DEVIATION OF THE 10- FOLD CROSS VALIDATION . DATA SET: Field Dataset 2012. T HE LAST COLUMN IS THE TRAINING / TESTING CPU TIME ( IN SECONDS ) FOR THE FREEZE / NON - FREEZE CLASSIFICATION IN A SINGLE 90%-10% TRAINING - TESTING SEPARATION . C4.5 AdaBoost LinearSVM LR MLP
freeze/non-freeze 98.42 (±0.19) 96.66 (±0.26) 97.47 (±0.22) 96.73 (±0.26) 95.93 (±0.31)
long-freeze 98.01 (±0.20) 96.60 (±0.23) 96.98 (±0.21) 96.48 (±0.25) 92.76 (±0.27)
multi-freeze 92.38 (±0.47) 91.09 (±0.50) 90.38 (±0.43) 83.43 (±0.44) 85.40 (±0.52)
CPU time 3.49/0.06 2.26/0.00 1146.69/14.07 27.14.92/0.02 38.20/0.02
TABLE IV. ACCURACY OF THE AVERAGE CLASSIFICATION (%) AND THE STANDARD DEVIATION OF THE 10- FOLD CROSS VALIDATION . DATA SET: Lab Dataset. T HE LAST COLUMN IS THE TRAINING / TESTING CPU TIME ( IN SECONDS ) FOR THE FREEZE / NON - FREEZE CLASSIFICATION IN A SINGLE 90%-10% TRAINING - TESTING SEPARATION . C4.5 AdaBoost LinearSVM LR MLP
freeze/non-freeze 98.12 (±0.80) 98.32 (±0.75) 94.05 (±1.23) 97.72 (±0.92) 96.93 (±1.20)
long-freeze 98.71 (±0.64) 98.61 (±0.71) 96.43 (±1.08) 98.71 (±0.62) 98.71 (±0.81)
multi-freeze 90.78 (±1.63) 90.78 (±1.65) 88.01 (±1.57) 90.19 (±2.19) 90.19 (±1.69)
CPU time 0.08/0.02 0.11/0.00 0.51/0.12 0.41/0.00 1.00/0.00
our final classifier. For both datasets, the accuracy for the freeze/non-freeze classification and the long-freeze classification is about 98%, while the performance of multi-freeze classification is about 90%. Table V shows the precision and recall of the C4.5 classifier for the Field Dataset and the Lab Dataset with the three tasks. Interestingly, when we take the C4.5 classifiers trained by Field Dataset 2012 and take the video sessions in the Field Dataset 2014 as the test set, the accuracy does not decrease a lot: 94.51%, 94.77% and 95.61% for three classification tasks, implying the stability of our trained classifiers. To visualize the decision plane, a classifier of C4.5 for the freeze/non-freeze task obtained from the Field Dataset 2012 training set is shown in Figure 7. For accuracy reasons, every leaf contains at least 1000 sessions. The classification model first uses the most discriminative feature b1,1 . If the value of this feature is less than -3, the whole session is classified as having at least one freeze. If the value is higher than -3, the model examines if the value of feature b1,5 is greater or less than -24, and so on, until a leaf is reached. From the visualization of the model, we can see that in the test, a video session will be identified by only asking a few “if-then” questions as shown in the figure, which greatly speeds up the decision process. D. Computational Cost All experiments were performed using an HP ProBook 6470b laptop, with Intel(R) Core(TM) i5-3320M CPU @ 2.60Hz. For the training set (79298 sessions, 48.9 million video seconds) and the test set (8811 sessions, 5.4 million video seconds) in the Field Dataset 2012, the CPU time consumed by feature extraction is 25.1/2.9 seconds. Taking C4.5 decision tree as the classifier, the CPU time for modeling and recognition
TABLE V.
P RECISION (%) AND RECALL (%) OF THE CLASSIFIER FOR Field Dataset AND Lab Dataset
Field Dataset Lab Dataset
freeze/non-freeze 98.80 97.62 98.28 95.80
Precision Recall Precision Recall
long-freeze 98.38 97.36 98.70 98.21
C4.5
multi-freeze 90.39 93.64 77.60 95.17
b1,1 >-3