(IJACSA) International Journal of Advanced Computer Science and Applications,. Vol. 7, No. ... KeywordsâECG Signal; QRS Complex; multilevel algorithm;.
(IJACSA) International Journal of Advanced Computer Science and Applications, Vol. 7, No. 1, 2016
QRS Detection Based on an Advanced Multilevel Algorithm Wissam Jenkal, Rachid Latif, Ahmed Toumanari, Azzedine Dliou, Oussama El B’charri Laboratory of Systems Engineering and Information Technology (LiSTi) National School of Applied Sciences, Ibn Zohr University Agadir, Morocco
Abstract—This paper presents an advanced multilevel algorithm used for the QRS complex detection. This method is based on three levels. The first permits the extraction of higher peaks using an adaptive thresholding technique. The second allows the QRS region detection. The last level permits the detection of Q, R and S waves. The proposed algorithm shows interesting results compared to recently published methods. The perspective of this work is the implementation of this method on an embedded system for a real time ECG monitoring system. Keywords—ECG Signal; QRS Complex; multilevel algorithm; thresholding technique
I.
INTRODUCTION
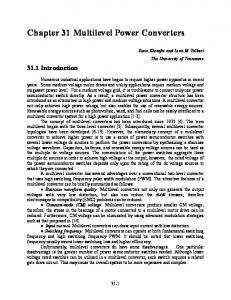
The electrocardiogram (ECG), as illustrated in Fig. 1, presents the electrical activity of the heart. This activity is collected on a patient by electrodes placed on the surface of his skin. The heart is made of muscle cells that conduct electrical impulses. In addition, there are specialized cells organized into a preferential conduction tissue and endowed with the power to depolarize spontaneously, creating cardiac automatism [1]. The ECG is an essential element both in patient monitoring or diagnosis of cardiovascular disease. The theoretical basis and practice of cardiac electrical activity recording were set out by Einthoven. in 1901. The analyses of the ECG signal permit to evaluate the heart condition of the patients. This signal contains different waves that present repolarization and depolarization of the heart muscle [2-5]. Among these waves, the QRS complex corresponds to the depolarization of the ventricles. This complex shows a large amplitude compared to other waves. This gives it a top priority during the diagnosis of the ECG signal. The QRS complex represents three contiguous waves following the P wave, namely the waves Q, R and S. By definition, the Q wave is the first negative wave, the R wave is the first positive wave, and the S wave is first negative wave after the R wave [6-7]. The average duration of the QRS complex is 0.08 s. It must remain below 0.12 s. Above, it is most often an asynchronous depolarization of two ventricles associated with intraventricular conduction disorder [1]. The automatic processing of the ECG signal is a major challenge to researchers and the engineers in the different tasks of research that deal with this signal, likewise, the ECG signal
Fadel Mrabih Rabou Maoulainine Team of Child, Health and Development CHU, Faculty of Medicine, Cadi Ayyad University Marrakech, Morocco
denoising, the QRS complex detection and the real time monitoring [8-9]. The ECG signal could be affected by several types of noise, which influence negatively on this signal [1012]. e.g., the baseline wandering, the high frequency noise and the power line interference. These noises are attested in the recording of the ECG signal. Fluctuations of the baseline are internal noises that disturb the ECG signal. These fluctuations are due to respiration and patient motion during the recording of this signal. The high frequency noises beyond the frequency of the normal ECG signal, which is variable between 0.5 Hz and 150 Hz. These noises are caused by the extra-cardiac muscle activity. The power line interferences are induced by the electrical power supply of appliances. After the ECG signal denoising, the QRS complex detection is the first steps of any analyses of ECG signal’s waves. The extraction of this complex is a major issue of the ECG signal processing and it presents an important task for researchers from long time. This difficulty is due to the different morphology of the ECG signal, as illustrated in Fig. 2. Several research works have been proposed to deal with this task. e.g., derivative algorithms [1315], artificial neural networks [9], DWT [16-17], filter banks [9]. The problem with the majority of these methods is the high complexity of the implementation in the embedded systems. As a solution for this problem, this paper proposes an efficient method based on a multilevel algorithm to solve this issue. This method is based on three levels, namely the extraction of higher peaks using an adaptive thresholding technique, the QRS region detection and the detection of Q, R and S waves. This method is tested on some of the MIT-BIH arrhythmia signals. The perspective of this work is the implementation of this method on an embedded system for the ECG monitoring system. This gives the possibility of evaluating the patient's cardiac status in real time. This paper is organized as follows, after the introduction, the next section presents the advanced multilevel algorithm based on adaptive thresholding technique. Next, the results section shows the qualitative and the quantitative results and comparisons of this method over some of the MIT-BIH arrhythmia signals as presented in [1]. Afterwards, the discussion section proposes a detailed analysis of the results. Finally, the last section concludes this paper.
253 | P a g e www.ijacsa.thesai.org
(IJACSA) International Journal of Advanced Computer Science and Applications, Vol. 7, No. 1, 2016
Fig. 1. Normal ECG signal with his different features
Fig. 2. Example of different morphologies of the ECG signal
II.
PROPOSED METHOD
A. ECG Signal denoising The ECG signal is fragile to different kinds of noises. This makes of the filtering step an essential element of every sort of analysis of the ECG signal. In our case, we have proposed an efficient solution of the baseline wandering correction and the high frequency noises, which will be presented in further works. The power line interference (50Hz or 60Hz) is not treated with this solution considering the perspective of implementation of this method in an embedded system with a DC supply. This denoising approach shows interesting results in the case of the baseline wandering issue, as shown in Fig. 3, as well as the high frequency noises as presented in Fig. 4.
Fig. 3. The baseline wandering correction. (a) noisy signal, (b) corrected signal
254 | P a g e www.ijacsa.thesai.org
(IJACSA) International Journal of Advanced Computer Science and Applications, Vol. 7, No. 1, 2016
The length of the moving window is 5 seconds that permits to compare every QRS to its neighbours and extract the majority of these complex. In addition, this length doesn’t allow to have a large difference between the largest and smallest QRS in this window. This due to the behaviour of the ECG signal, which changes gradually. Therefore, the right choice of the window’s length guarantees the high performance of this method.
Fig. 4. The high frequency noise correction. (a) original signal, (b) noisy signal, (c) corrected signal
B. Advanced multilevel algorithm Fig. 5 presents the diagram of the proposed method. The first step presents the ECG signal denoising. Then, the advanced multilevel algorithm, which consists of three levels, namely the extraction of higher peaks using an adaptive thresholding technique, the detection of the QRS region and the detection of Q, R and S waves.
Fig. 5. The diagram of the proposed method
1) The extraction of higher peaks: This level is the major element of this method. It permits to locate the position of the QRS complex in the ECG signal. In this level we propose an adaptive thresholding technique. The aim of this technique is to introduce an adaptive threshold, which vary according to the maximum of a moving window. The threshold value is chosen as follows: β = ΜΑ × α (1) Where β presents the threshold value, M A is the maximum value of the moving window and α is the adaptive thresholding coefficient.
The MIT-BIH arrhythmia database is frequently used in the evaluation of different algorithms in several thematic interested by the ECG signal [18]. This database contains 48 records; each record is of 30 min length with 360 Hz sampling frequency [18]. This means that the window’s length is 1800 samples (5 seconds) and the signal length is 650000 samples (30 minutes). The maximum heartbeats are estimated at 160 beats per minute (bpm). Therefore, the minimum interval between two complexes corresponds to 145 samples for this method. Following is the algorithm of the adaptive thresholding technique, where X(i) is the absolute value of the original signal and W(i) is the result of this level: Algorithm of the higher peaks extraction: 1. i=1, j=1, α=50%, m=1800, n=650000, d=145, Loop1: c=1; 2. For i < n j=i; 2.1. For j < m+i M A= Maxima of (X(i : i+m)); Loop2: β = M A × α ; 2.1.1 For (j=i ; j=m+i ; j++) if X(j) >= β W(j)= X(j); j= j +d; c=c+1; else W(j)= 0; end if end 2.1.2 if c < 5 if α >30% α= α -5%, j=i; goto Loop2; end if end if end 2.2. i=i+m; goto Loop1; End
As presented in this algorithm, the threshold coefficient starts at 50% and decreases by 5% until it reaches at 30%. This coefficient permits to extract the maximum of the peaks present in the moving window.
255 | P a g e www.ijacsa.thesai.org
(IJACSA) International Journal of Advanced Computer Science and Applications, Vol. 7, No. 1, 2016
The condition of the decrease is that the numbers of peaks should be lesser than 5 peaks, which is corresponding to 60 bpm. To simplify the analysis, it is recommended to divide the original signal. This permits to readily analyse the conduct of the proposed method. 2) The detection of the QRS region: After the extraction of the higher peaks, this level consists of the detection of the QRS regions around these peaks. As presented in Fig.3, the S waves in some cases could be higher than the R waves in the absolute value of the original signal. In order to select the right QRS region around a peak, this method proposes to select this region differently depending on the nature of the peaks. Following is the algorithm of the adaptive thresholding technique, where U(i) is the original signal, X(i) is the absolute value of the original signal and Q(i) is the result of this level: Algorithm of the QRS region extraction: 1.i=1, n=650000, d=145, Loop1: c=1; 2.For i < n if W(i) > 0 2.1. if U(i) > 0 Q(i-30:i+30)= U(i-30:i+30); else Q(i-45:i+15)= U(i-45:i+15); end if i=i+d; else Q(i)=0; i=i+1; end if End
As presented in this algorithm, the length of the QRS region is 60 samples, which presents to the maximum duration of the QRS complex. This duration corresponds to 160 milliseconds. This coefficient permits to extract the maximum of the peaks present in the moving window. The decrease condition of this coefficient is that the numbers of peaks should be lesser than 5 peaks, which is corresponding to 60 bpm. As shown in the condition {2.1}, the position of the QRS region depends to the nature of the peaks. If the peak represents the R wave, then the length of the QRS region will be divided equally around this peak. Otherwise, if the peak represents the S wave, then the position of the QRS region will be selected to make the R wave in the middle of this region. 3) The detection of the waves Q, R and S: This level permits the detection of the waves present in the QRS complex. The algorithm of the detection of the waves Q, R and S is as follows:
Algorithm of the QRS region extraction: 1.i=1, n=650000, d=145, Loop1: c=1; 2.For i < n if Q (i) ≠ 0 M R = Maxima of (Q(i : i+60)); j=i; For j