Jagmeet P Singh, Peter Sleight, Attila Kardos, George Hart. Abstract. A 71 year old man with hypertensive heart disease and chronic renal failure was wearing a ...
Downloaded from heart.bmj.com on July 15, 2011 - Published by group.bmj.com
Heart 1997;77:375-377
375
CASE REPORT
QT interval dynamics and heart rate variability preceding a case of cardiac arrest Jagmeet P Singh, Peter Sleight, Attila Kardos, George Hart
Abstract A 71 year old man with hypertensive heart disease and chronic renal failure was wearing a Holter monitor when he had a cardiac arrest. He had ventricular fibrillation (VF) and died despite prompt resuscitation. In the 15 minutes preceding the VF there was a sudden increase in heart rate, followed by a brief period of atrial fibrillation leading to ventricular tachycardia, which in turn rapidly degenerated into VF. The QT interval and heart rate variability were studied half hourly over the seven hours preceding the cardiac arrest, using a computerised Holter system. A further detailed analysis was performed over the final hour before the cardiac arrest. An abrupt increase in the steepness of the QT/RR slope, a prolonged QTc, and a reduction in the heart rate variability were observed in the interval that immediately preceded the onset of the terminal rhythm disturbance. (Heart 1997;77:375-377)
Keywords: QT interval variability; heart rate variability; cardiac arrest; left ventricular hypertrophy
Department of Cardiovascular Medicine, John Radcliffe Hospital, University of Oxford, Oxford P Singh P Sleight A Kardos G Hart
J
Correspondence to: Dr J P Singh, Framingham Heart Study, 5 Thurber Street, Framingham, MA 01701, USA. Accepted for publication 13 November 1996
Despite the high prevalence of sudden cardiac death, few patients have a cardiac arrest while wearing an ambulatory electrocardiographic recorder, which would enable analysis of the initiating cardiac arrhythmia and the period immediately preceding the arrhythmia. The duration of ventricular repolarisation is poorly explored on the conventional electrocardiogram. Static QT interval measurements from the surface electrocardiogram and their correction for the influence of heart rate using Bazett's formula may be inadequate, since the QT interval is also continually conditioned by changes in the activity of the autonomic nervous system.' 2 We therefore studied for the first time the dynamic behaviour of the QT interval on a beat to beat basis together with heart rate variability, in the period immediately preceding the terminal rhythm.
Case report The patient was a 71 year old man with a history of hypertensive heart disease and chronic renal failure who was on maintenance dialysis. Two months previously he had an episode of paroxysmal atrial fibrillation. His medication included digoxin 62-5 mg once a day, ferrous sulphate 200 mg twice a day, and temazepam 10 mg at bedtime. He was admitted to hospital with a transient ischaemic attack. On physical examination the pulse was regular at 82 beats/min, blood pressure was 200/108 mm Hg, and the jugular venous pressure was normal. There were no pulmonary abnormalities. The heart sounds were normal; there was a soft ejection systolic murmur over the second right intercostal space. His serum potassium was 5-7 mmol/l. The ECG showed sinus rhythm, left ventricular hypertrophy, and a QS pattern in the inferior leads. On chest x ray there was moderate cardiomegaly, confirmed by echocardiography which showed moderate left ventricular hypertrophy and mild dilatation, but with preserved ventricular function. A few days after admission a Holter monitor was fitted because of repeated episodes of giddiness. Seven hours into this recording he developed atrial fibrillation followed by a polymorphic ventricular tachycardia which rapidly degenerated into ventricular fibrillation, from which he could not be resuscitated (fig 1). A computerised Holter analysis system was used to measure the QT interval on a beat to beat basis over the seven hours. The Holter tape was replayed at 200 times the recording speed into a programmable waveform analyser (Century Colour Trace Model, Biomedical Systems). The electrocardiogram was digitised at a sampling rate of 400 Hz, with the QRS signals detected by a template matching algorithm. The working algorithm for QT interval measurement involved a rate dependent search window to locate the T wave peak, following which the point with steepest slope along the descending limb of the T wave and area of least variation were identified. The end of the T wave was defined as the point where the maximum negative slope intersected the
Downloaded from heart.bmj.com on July 15, 2011 - Published by group.bmj.com
Singh, Sleight, Kardos, Hart
376
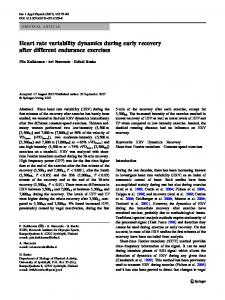
Figure 1 Ambulatory ECG recording showing a normal sinus rhythm, atrialfibrillation (AF) leading to ventricular tachycardia (VT), VT degenerating into ventricular fibrillation
(VF).
basel mine. The QT interval was measured in lead V2 in a semi-automated and interactive manrner under operator control. Markers for onsett of the QRS and the end of the T wave coulcI be reset by altering the algorithm paramete;rs and rescanning the relevant segments whenlever required. A moving average of 10 beats was used to improve signal quality and in tul rn allow for a more accurate identification of th e end of the T wave. Time intervals were
Figure 2 Half hourly distribution of the electrophysiological parameters assessed preceding the cardiac arrest. SDRR, standard deviation of the consecutive RR intervals over 5 min segments; SDA-QT, standard deviation of the average of consecutive uncorrected QT intervals over 5 min segments; QTc, corrected QT interval; QTIRR, the slope of the regression line between the QT and RR intervals.
1001 cr 85' ,o
_ O_