Hindawi Publishing Corporation ISRN Chromatography Volume 2013, Article ID 738397, 10 pages http://dx.doi.org/10.1155/2013/738397
Research Article Quality by Design Approach for the Development and Validation of Glipizide, an Antidiabetic Drug, by RP-UPLC with Application to Formulated Forms and Urine Cijo M. Xavier, Kanakapura Basavaiah, K. B. Vinay, and N. Swamy Department of Studies in Chemistry, University of Mysore, Manasagangothri, Mysore Karnataka 570006, India Correspondence should be addressed to Kanakapura Basavaiah;
[email protected] Received 30 November 2012; Accepted 10 January 2013 Academic Editors: M. C. Bruzzoniti, M. Hassan, and A. I. Suarez Copyright © 2013 Cijo M. Xavier et al. This is an open access article distributed under the Creative Commons Attribution License, which permits unrestricted use, distribution, and reproduction in any medium, provided the original work is properly cited. Quality by design (QbD) refers to the achievement of certain predictable quality with desired and predetermined specifications. The objective of this study was to develop and demonstrate an integrated multivariate approach to develop and quantify the constituent concentrations of glipizide (GPZ) drug in its pure and tablet forms. The method was developed using Zorbax Extend C-18 (50 mm × 4.6 mm × 1.8 𝜇m) column with mobile phase consisting of a mixture of phosphate buffer of pH 3.5 and acetonitrile (60 : 40 v/v). The method fulfilled validation criteria and was shown to be sensitive, with limits of detection (LOD) and quantitation (LOQ) of 0.001 and 0.005 𝜇g mL−1 , respectively. The percentage relative standard deviations for robustness and ruggedness were observed within the range of 0.1 and 0.99. The calibration graph was linear in the range of 0.005–300 𝜇g mL−1 . The applicability of the method was shown by the analysis of formulated drug and spiked urine samples. The proposed method can be used for routine analysis in quality control laboratories for its bulk and formulated product, and this is the first UPLC method reported for the assay of GPZ in bulk, formulated form and urine.
1. Introduction Quality by design (QbD) is a systematic approach to development that begins with predefined objectives and emphasizes product and process understanding and process control, based on sound science and quality risk management [1, 2]. The objective of the QbD initiative is to demonstrate both understanding and control of pharmaceutical processes to deliver high quality pharmaceutical products while affording opportunities for continuous improvement. QbD delivers a better understanding of method capabilities and limitations and ensures a superior chance of successful downstream method validation and transfer. It has become an important paradigm in the pharmaceutical industry since its introduction by the US Food and Drug Administration [3–8]. The QbD concept can be extended to analytical methods [9–16]. In addition, all international drug administration agencies endorse the QbD approach because it is expected that such performance-based routine methods can be changed within the analytical target profile without regulatory resubmission and approval.
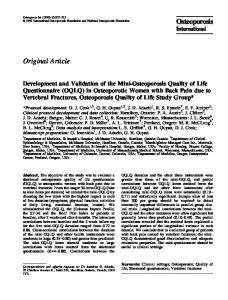
Glipizide (GPZ), chemically known as N-[2-[4[[[(Cyclohexylamino) carbonyl] amino] sulfonyl]phenyl]ethyl]-5-methylpyrazine carboxamide] (Figure 1) is an oral antihyperglycemic agent [17] used in the treatment of noninsulin-dependent diabetes mellitus [18]. It lowers the blood glucose level in humans by stimulating the release of insulin from the pancreas and helping the body to use insulin efficiently [19]. Among its other qualities, it has been shown (i) to stimulate insulin action through extrapancreatic effects; (ii) to favorably influence the principal pathophysiologic abnormalities, defective secretory dynamics, and target-cell resistance to insulin observed in noninsulin-dependent diabetes; (iii) to improve control of blood glucose; and (iv) to lower the level of plasma glucose and to maintain this effect despite a short half-life [20]. GPZ is included in the United States Pharmacopoeia [21] and European Pharmacopoeia [22]. The former recommends HPLC method for its assay and the latter recommends titrimetry. In the literature, several HPLC methods are available for the determination of GPZ in plasma [18, 19, 23– 30] dosage forms [31–38] and urine [30, 39, 40]. Reported
2
ISRN Chromatography O HN
O N H
ambient temperature (25∘ C) and an injection volume of 2 𝜇L was used. The run time was fixed for 5 minutes and the diluent used was mobile phase.
O S
O N H
N N
CH3
Figure 1: Structure of glipizide.
methods for the determination of GPZ in pharmaceuticals include UV spectrophotometry [41–44], HPLC, and capillary electrophoresis [45]. According to literature survey, there are quite a few publications on UPLC method development [46, 47] strategy. The reported methods either lack instability indicating study or used huge costly mass spectra for the determination. However, method development approach with RP-UPLC specifically focused on pharmaceutical development in a QbD environment for GPZ that has not been reported anywhere. Therefore, there is an unmet need to investigate a systematic UPLC method development approach for pharmaceutical development using QbD principles to ensure the quality of the method throughout the product lifecycle. The primary objective of this study was to implement QbD approach to develop and validate an RP-UPLC method that could separate drug in the bulk, formulated forms and human urine with in-depth understanding of the method and build in the quality during the method development to ensure optimum method performance over the lifetime of the product with a suitable degradation data.
2. Methods 2.1. Materials and Reagents. Pure active ingredient sample of GPZ was kindly supplied by Bal Pharma, Bangalore, India, as gift. GPZ-containing tablets, Dibizide (5 mg) (Micro Labs Limited, Hosur, India) and Glynase-5 (5 mg) (USV Limited, Aurangabad), were procured from the local market. HPLC grade acetonitrile was purchased from Merck Specialities, Mumbai, India. Potassium dihydrogen orthophosphate, benzene, and orthophosphoric acid were from Qualigens, India. Doubly distilled water was used throughout the investigation. 2.2. Chromatographic Conditions and Equipment and Instrumental Parameters. Waters (Waters Chromatography Division, Milford, MA, USA) AQUITY UPLC system with a tunable UV detector was used for the determination of GPZ. Empower 2 software was used to record and evaluate the data collected during and following chromatographic analysis. Shimadzu Pharmaspec 1700 UV/Visible spectrophotometer was used for the initial absorbance measurement. The chromatographic separation was achieved on a Zorbax Extend C-18 (50 mm × 4.6 mm × 1.8 𝜇) column using a mobile phase consisting of acetonitrile buffer (0.025 M KH2 PO4 of pH 3.5) with 40 : 60 v/v ratio at a flow rate of 0.2 mL/min. The mobile phase was filtered through 0.22 𝜇m nylon-66 filter prior to use. The eluent was monitored using UV detection at a wavelength of 220 nm. The column was maintained at
2.3. Stress Study. In order to establish whether the analytical method and the assay were stability indicating, pure active pharmaceutical ingredient (API) of GPZ was subjected to stress under various conditions to conduct forced degradation studies [48, 49]. As the drug is freely soluble and stable in mobile phase, the same was used as a cosolvent in all forced degradation studies. All solutions used in forced degradation studies were prepared by dissolving GPZ in small volume of diluent and later diluted with aqueous hydrogen peroxide (5%), distilled water, aqueous hydrochloric acid (1N), and aqueous sodium hydroxide (1N) for 2 h. For photolytic degradation studies, pure drug in solid state was exposed to 1.2 million lux hours in a photostability chamber [49]. Additionally, the drug powder was exposed to dry heat at 105∘ C for 2 h. After the degradation these solutions were diluted with mobile phase to yield starting concentration of 200 𝜇g mL−1 and subjected to UPLC analysis. 2.4. Preparation of Stock Solution. Stock solution of GPZ (1 mg/mL) was prepared in diluent and it was stored at 5∘ C until use. 2.5. Procedures 2.5.1. Procedure for Preparation of Calibration Curve. Working solutions containing 0.005–300 𝜇g mL−1 GPZ were prepared by serial dilutions of aliquots of the stock solution. Aliquots of 2 𝜇L were injected (six injections) and eluted with the mobile phase under the reported chromatographic conditions. The mean peak areas were plotted against the corresponding concentrations of the pure drug to obtain the calibration graphs and corresponding regression equation was also computed. 2.5.2. Preparation of Tablet Extracts and Assay Procedure. Fifty numbers, each of Glynase and Dibizide tablets (each tablet contained 5.0 mg GPZ), were weighed and powdered. Tablet powder equivalent to 20 mg of GPZ was transferred into 100 mL volumetric flasks and 60 mL of the mobile phase were added. The solution was sonicated for 20 min to achieve complete dissolution of GPZ, made up to the mark with mobile phase and then filtered through 0.22 𝜇m nylon membrane filter. The resultant solution (200 𝜇g mL−1 in GPZ) obtained was analyzed through the UPLC system. 2.5.3. Preparation of Urine Sample. A 1.00 mL of 0.05 M hydrochloric acid was added to 0.50 mL of urine, resulting in a pH of 3. The mixture was extracted with 3.00 mL of benzene in a 12 mL glass tube, which was shaken gently for 15 min. After centrifugation for 5 min, the organic phase was transferred to a conical tube for evaporation to dryness under a stream of a well-ventilated fume chambers. The residue was redissolved in mobile phase and an aliquot of 2 𝜇L was injected into the chromatograph.
ISRN Chromatography
3 1
Accuracy and Precision. To determine the accuracy and intra-day precision, pure GPZ solutions at three different concentrations were analyzed in seven replicates during the same day. Mobile phase was injected as blank solution before sample injection and the RSD (%) values of peak area and retention time were calculated.
Abs.
2.5.4. Procedure for Method Validation
Limits of Detection (LOD) and Quantification (LOQ). LOQ and LOD determinations were performed on samples containing very low concentrations of analyte under the ICH guidelines. By applying the signal to noise ratio (S/N) method, LOD was expressed by establishing the minimum level at which the analyte can be reliably detected. LOQ was considered as the lowest concentration of analytes in standards that can be reproducibly measured with acceptable accuracy and precision. Precision study was performed at LOQ. LOQ solution was injected seven times (𝑛 = 7) and calculated the % RSD values for the obtained peak area and retention time. Linearity. Linearity solutions were prepared from LOQ level to 150% of the actual sample concentration (200 𝜇g mL−1 GPZ). A total of seven concentrations of the solutions were made separately and injected (LOQ: 50, 100, 150, 200, 250, and 300 𝜇g mL−1 levels). Robustness and Ruggedness. To determine the robustness of the method the experimental conditions were deliberately changed. The flow rate of the mobile phase (0.2 ± 0.02 mL min−1 ), column oven temperature (25 ± 1∘ C), mobile phase composition ratio (35 : 65, 45 : 55, acetonitrile : buffer), and detection wavelength (220 ± 1 nm) were the varied parameters. In each case, the % RSD values were calculated for the obtained peak area and retention time. The number of theoretical plates and tailing factors were compared with those obtained under the optimized conditions. Three different columns of same dimensions were used for the analyses. The studies were performed on the same day (intra day) and on three different days (inter day) by three different analysts for three different concentrations of GPZ (triplicate injections). The area obtained from each concentration was compared with that of the optimized one. The relative standard deviation values were evaluated for each concentration. Solution Stability and Mobile Phase Stability. The stability of GPZ in solution was determined by leaving test solutions of the sample and reference standard in tightly capped volumetric flasks at room temperature for 48 h during which they were assayed at 12 h intervals. Stability of mobile phase was determined by analysing freshly prepared sample solutions at 12 h intervals for 48 h and comparing the results with those obtained from freshly prepared reference standard solutions. The mobile phase was prepared at the beginning of the study period and was not changed during the experiment. The % assay of the results was calculated for both the mobile phase and solution-stability experiments.
0.5
0
−0.1 200
250
300
400
350
(nm)
Figure 2: UV absorption spectra of glipizide.
Table 1: Screening: summary of method selection∗ . S. no. Column 1
2
3
4
5
Acquity BEH C8 (100 × 2.1) mm, 1.7 𝜇m Acquity BEH C18 (100 × 2.1) mm, 1.7 𝜇m Acquity HSS cyano (50 × 2.1) mm, 1.7 𝜇m Acquity HSS BEH shield RP18 (50 × 2.1) mm, 1.7 𝜇m Zorbax Extend C-18 (50 × 4.6) mm, 1.8 𝜇m
Observations
Remarks
Asymmetrical peak with fronting and tailing
Not satisfactory
Asymmetrical peak with tailing
Not satisfactory
Split peak
Not satisfactory
Asymmetrical peak
Not satisfactory
Symmetrical peak
satisfactory
∗ By keeping one column constant, the mobile phase, temperature, buffer, and sample concentration parameters were changed.
3. Results The method development consisted of two phases: the first is screening and the second is optimisation. 3.1. Screening. Solubility of the drug is the main criteria for any method to develop and then the UV response of the product at varying wavelengths. GPZ was found soluble in a mixture of acetonitrile and phosphate buffer. A 200 𝜇gml−1 solution showed excellent response at 220 nm when it was scanned from 400 to 200 nm in a UV spectrophotometer (Figure 2). In UPLC, variables such as mobile phase, buffer, temperature, sample concentration, and pH were varied by keeping one parameter (stationary phase) constant. Summarized observations are made as per the Table 1.
4
ISRN Chromatography Table 2: Final optimization of pH with Zorbax Extend C-18 (50 × 4.6) mm, 1.8 𝜇m column.
S. no.
Trails taken
Observations
1
ACN : buffer (pH 3.5) (40 : 60% v/v)
Peaks found symmetrical
2
ACN : buffer (pH 4) (40 : 60% v/v)
Peak eluted before 1 min with less theoretical plates
3
ACN : buffer (pH 3) (40 : 60% v/v)
Broad peak
Not satisfactory
4
ACN : buffer (pH 5) (40 : 60% v/v)
Broad peak and late elution
Not satisfactory
0.4
0.1 0.08
(a.u.)
(a.u.)
0.3 0.2
0.06
0.1
0.04
0
0.02
−0.1
0
0
0.5
1
1.5
2
2.5 3 Minutes
3.5
4
4.5
5
0
(a) ACN: buffer (pH 3.5) (40 : 60% v/v)
0
5
10
15
20 25 Minutes
30
35
4
6
8
10 12 Minutes
14
16
18
20
40
(c) ACN: buffer (pH 2.2) (20 : 80% v/v)
0.16 0.14 0.12 0.1 0.08 0.06 0.04 0.02 0
8
9
5.48
7.383
0.2 0.18 0.16 0.14 0.12 0.1 0.08 0.06 0.04 0.02 0
2
(b) ACN: buffer (pH 4.0) (20 : 80% v/v)
(a.u.)
(a.u.)
Not satisfactory
0.718
0.12
2.132
0.5
Remarks Satisfactory
0
1
2
3
4
5 6 Minutes
7
(d) ACN: buffer (pH 5.5) (20 : 80% v/v)
Figure 3: Method optimization at different pH conditions.
3.2. Optimisation. Zorbax Extend C-18 (50 × 4.6) mm, 1.8 𝜇m column, was found suitable and the fine tuning of the method was performed with suitable adjustment of pH. All the trials are as shown in Table 2 and chromatograms are as shown in Figure 3.
3.2.2. Validation of the Method. The described method for the assay of GPZ was validated as per the current ICH Q2 (R1) guidelines.
3.2.1. Final Method Conditions
Linearity. A calibration curve was obtained for GPZ from LOQ to 150% of its stock solution. The response of the drug was found to be linear in the investigation concentration range from 0.005 to 300 𝜇g mL−1 and the linear regression equation was 𝑌 = 11623.31𝑋 + 22535.76 with correlation coefficient of 0.9999, where Y is the mean peak area. The LOD and LOQ values and their standard deviations were evaluated and presented in Table 3. These results confirm the linear relation between the mean peak area and concentration as well as the sensitivity of the method.
Column: Zorbax Extend C-18 (50 × 4.6) mm, 1.8 𝜇m. Oven temp.: 25∘ C. Mobile phase: ACN: buffer (pH 3.5) (40 : 60% v/v). Run time: 5 min. Flow rate: 0.2 mL/min. Diluent: mobile phase. Injection volume: 2 𝜇L. Blank: diluent. Wavelength: 220 nm.
3.2.3. Analytical Parameters
Accuracy and Precision. The percentage relative error which is an index of accuracy is ≤1.56 and is indicative of high accuracy. The calculated percentage relative standard deviation
0.5
0.5
0.4
0.4
0.3
0.3
0.2
0.2
0.1
0.1
0
0
−0.1
0
0.5
1
1.5
2 2.5 Minutes
3
3.5
4
(a) Placebo blank
2.145
5
(a.u.)
(a.u.)
ISRN Chromatography
−0.1
0
0.5
1
1.5
2 2.5 Minutes
3
3.5
4
(b) Tablet extract
Figure 4: Chromatograms obtained for placebo blank and tablet extract. Table 3: Linearity and regression parameters with precision data. Parameter Linear range, 𝜇g mL−1 Limits of quantification (LOQ), 𝜇g mL−1 Limits of detection (LOD), 𝜇g mL−1 Regression equation Slope (𝑏) Intercept (𝑎) Correlation coefficient (𝑟)
(%RSD) can be considered to be satisfactory. The peakarea-based and retention-time-based RSD values were found